Section 1 of 9The aim
This required practical measures the population size of a common species in a habitat and investigates how the distribution of organisms is affected by an environmental factor. Because it is impossible to count every organism in a large area, you take samples and scale up.
Section 2 of 9Estimating population size with random quadrats


For example
- mean of 6 daisies per 0.25 m2 = 24 per m2.
- In an area of 500 m2, the estimate is 24 × 500 = 12 000 daisies.
For plants that are difficult to count, such as grass, estimate the percentage cover of each quadrat.
Section 3 of 9Investigating distribution with a transect

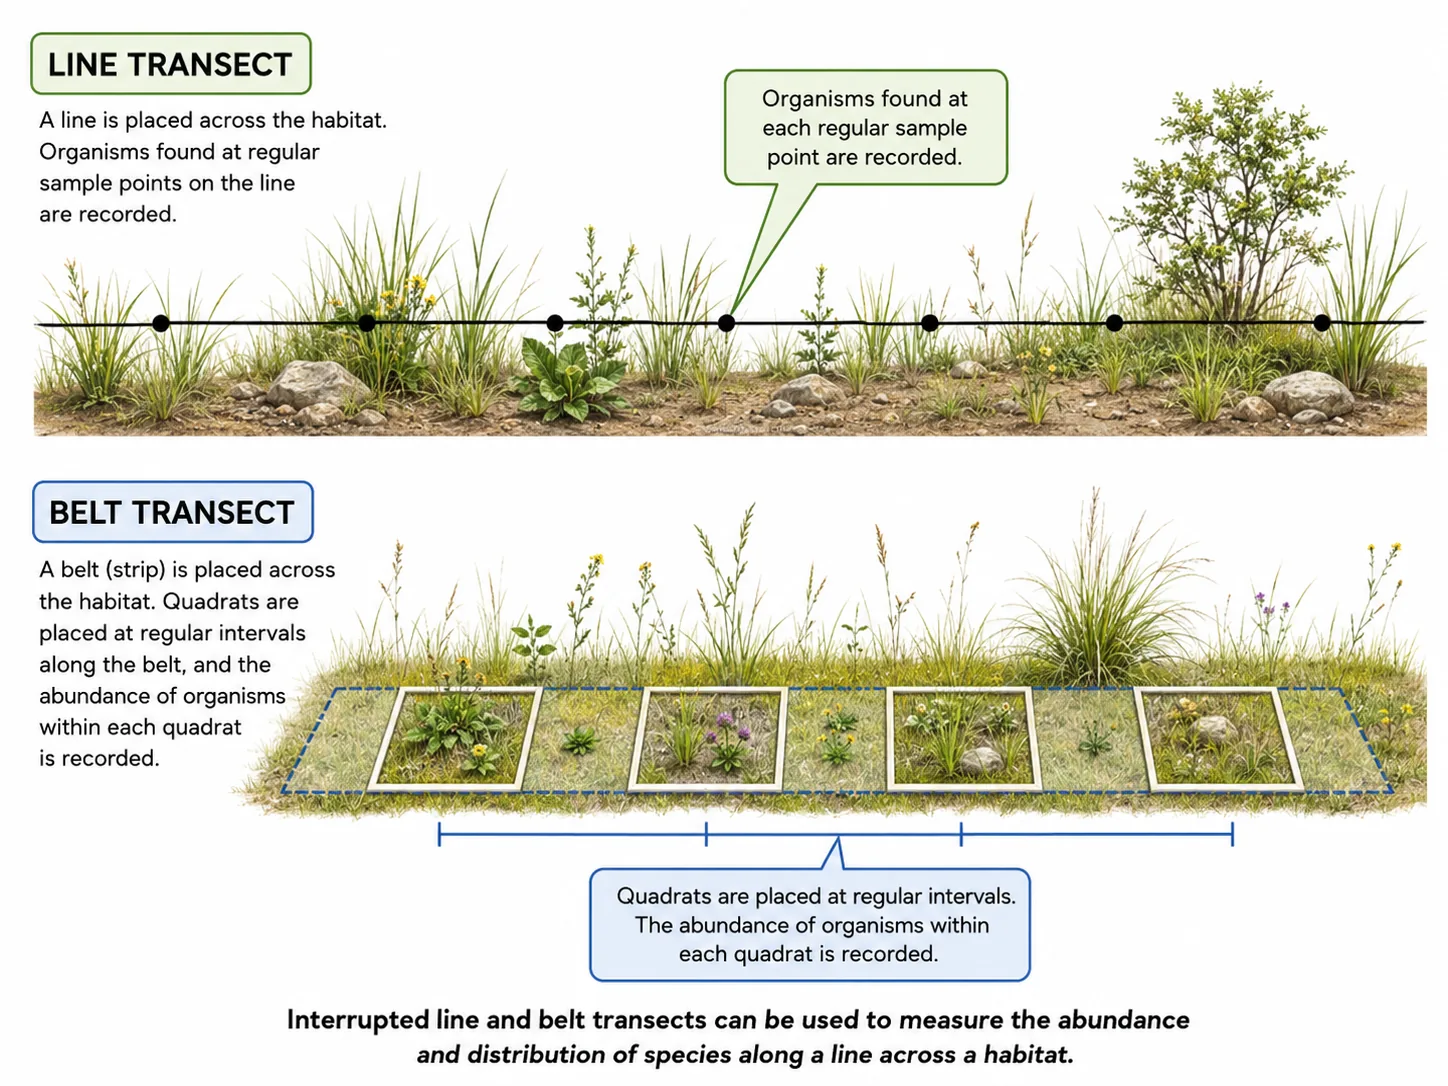
Where an environmental factor changes gradually, such as light moving from a hedge into an open field, use a belt or line transect.
- such as light intensity with a light meter, soil moisture with a probe,
- or soil pH.
Plot the abundance against distance, or against the value of the factor, and describe the pattern.
Section 4 of 9Reliability and sources of error
Section 5 of 9Safety and ethics
Take care in the field
- wear suitable clothing, avoid contact with poisonous plants, wash hands, and do not damage habitats.
- Leave the area as you found it and avoid collecting organisms unnecessarily.
Section 6 of 9Worked analysis of field data


This section shows how results from a quadrat investigation are processed and evaluated.
- which suggests that light is a limiting factor,
- but other things such as soil moisture might also change from the hedge to the lawn,
- so it is not proven.
To calculate a mean density, divide the total number of organisms by the total area sampled.
- then the estimated population is about 5700,
- but this assumes the plants are evenly spread,
- which is not the case on a transect with a gradient,
- so a random sample would be a better basis for estimating the population.
The choice of quadrat size depends on the organisms. A small quadrat is suitable for small, dense plants, whereas a larger one is needed for sparse plants such as trees. A pilot study can show how many quadrats are required: when the mean stops changing as more quadrats are added, the sample is large enough.
For animals that move, such as beetles, quadrats are not suitable and capture methods such as pitfall traps are used, but at GCSE the emphasis is on quadrats and transects for plants and slow-moving animals.
Section 7 of 9Exam-style questions
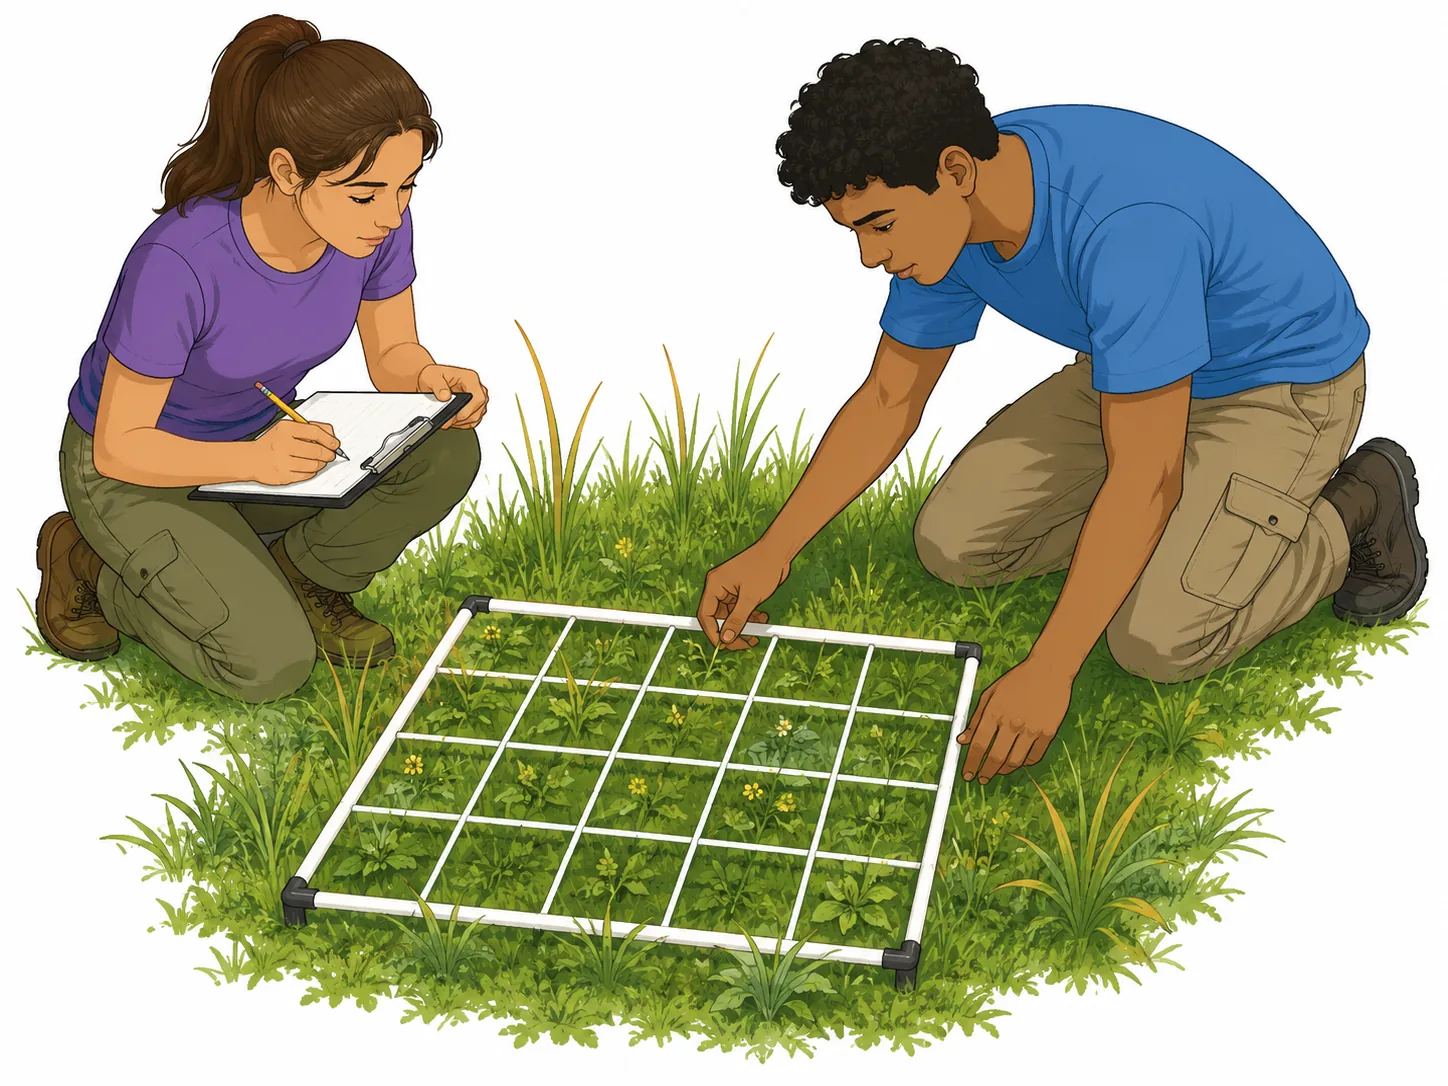
Describe how you would estimate the number of dandelions in a field of area 800 m2 using 1 m2 quadrats. [5]5 marks
Use random coordinates to place quadrats (1). Count the dandelions in each quadrat (1). Repeat at least ten times (1). Calculate the mean per quadrat (1). Multiply the mean by 800 to estimate the total (1).
In ten 0.25 m2 quadrats a student counted a total of 45 buttercups. Estimate the number in a 600 m2 field. [3]3 marks
Total area sampled = 10 × 0.25 = 2.5 m2 (1). Mean per m2 = 45 ÷ 2.5 = 18 (1). Estimate = 18 × 600 = 10 800 (1).
Explain why a transect is better than random sampling for investigating the effect of shade on moss growth. [2]2 marks
A transect samples along a line where the light changes steadily (1), so abundance can be linked to changes in light intensity, which random sampling cannot show (1).
Section 8 of 9Key terms
| Term | Meaning |
|---|---|
| Quadrat | A square frame of known area used for sampling. |
| Transect | A line along which samples are taken to show change in distribution. |
| Random sampling | Choosing sampling positions by chance to avoid bias. |
| Percentage cover | The proportion of the quadrat area covered by a species. |
| Population size | The total number of individuals of one species in an area. |
| Abiotic factor | A non-living part of the environment. |