6.1.6Plant Nutrition
Environmental Factors and the Rate of Photosynthesis
5 min read 6 parts Lesson 7 of 11 1 quiz
Section 1 of 6Factors that change the rate



Rate of photosynthesis
Light intensity
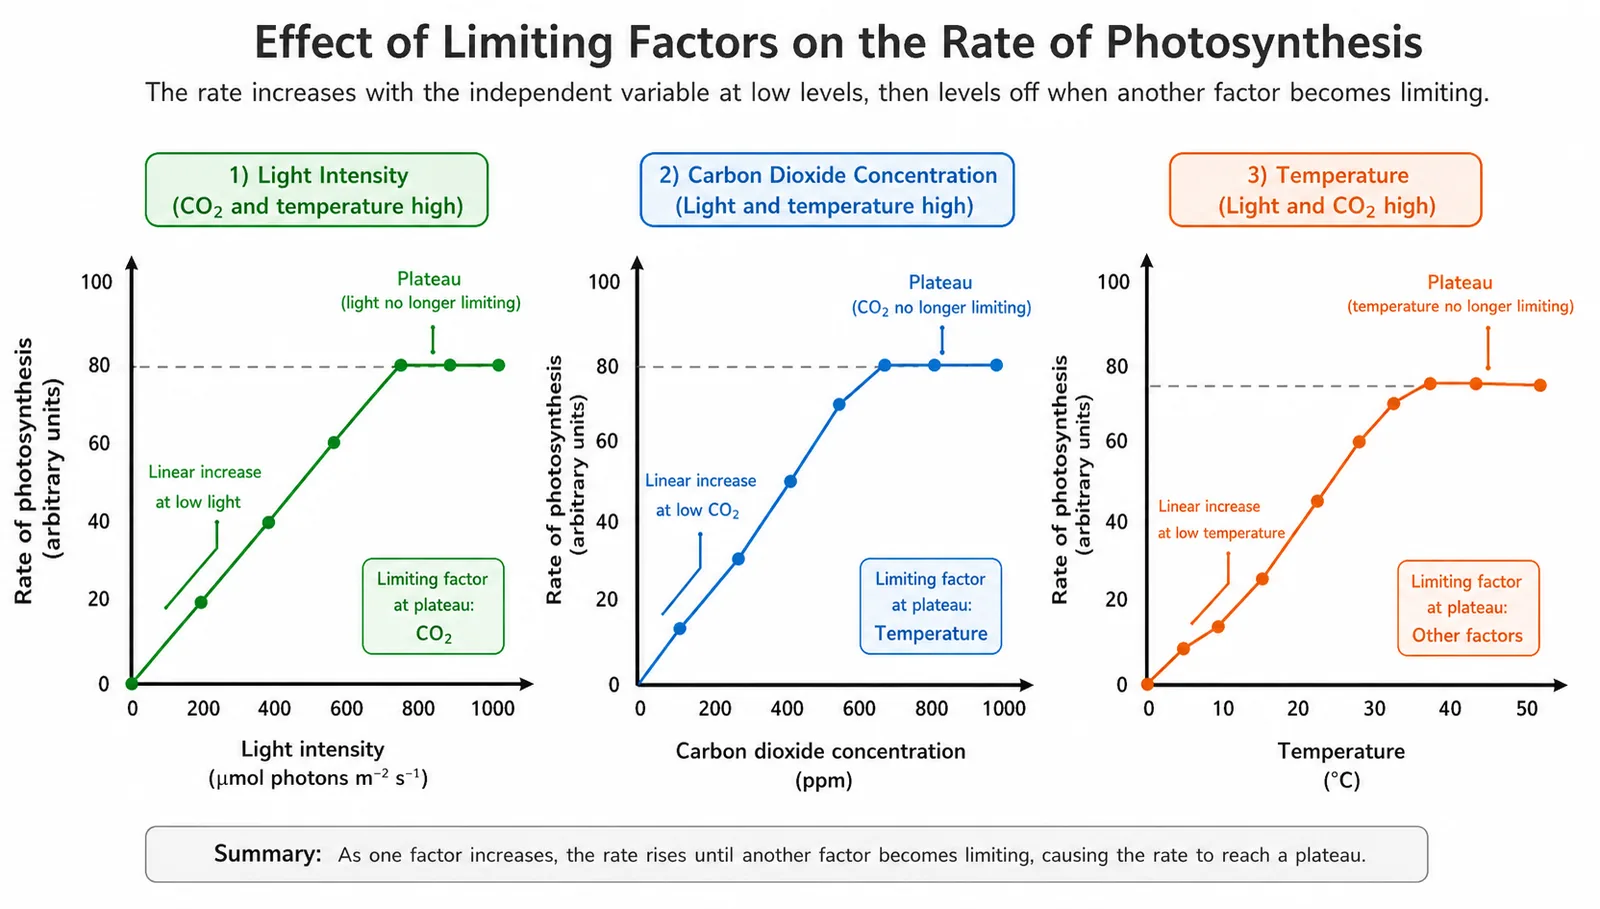
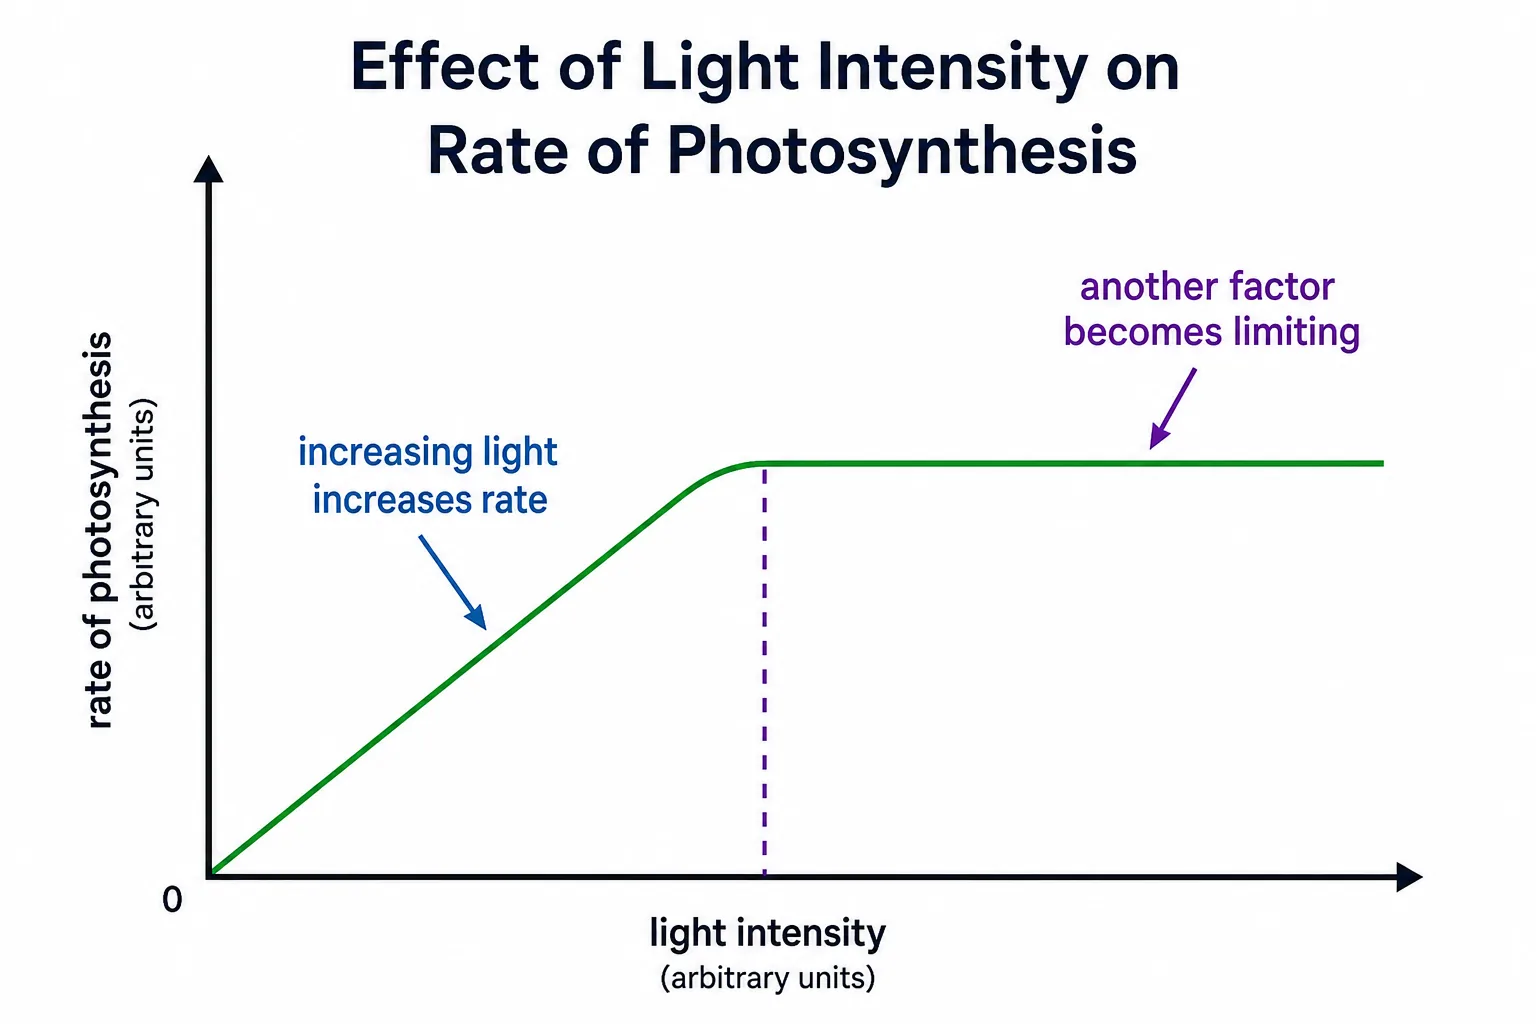
- Light intensity Light provides the energy for photosynthesis, so increasing light intensity increases the rate, until another factor becomes limiting.
Carbon dioxide concentration
- Carbon dioxide concentration Carbon dioxide is a raw material, so a higher concentration increases the rate, until something else limits it.
Temperature
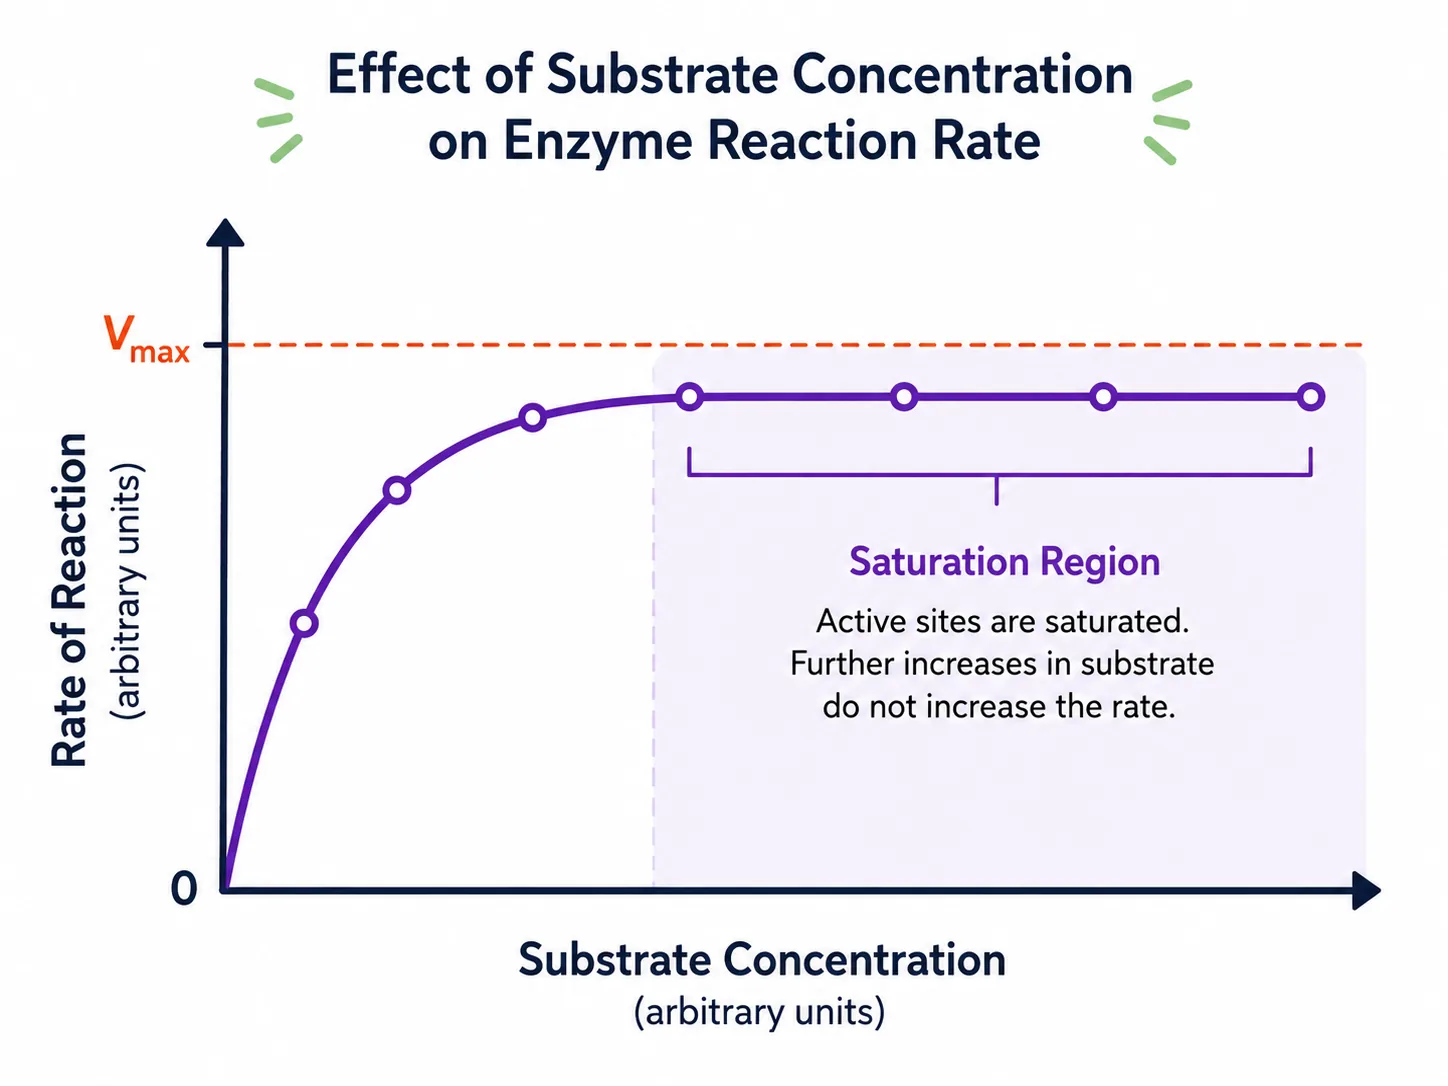
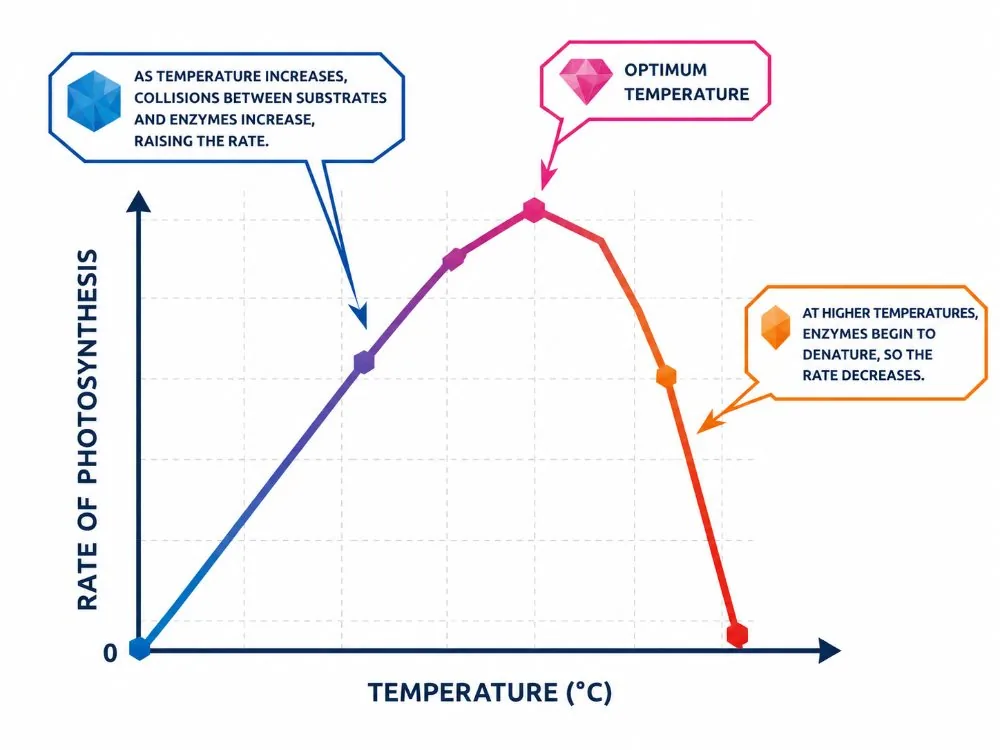
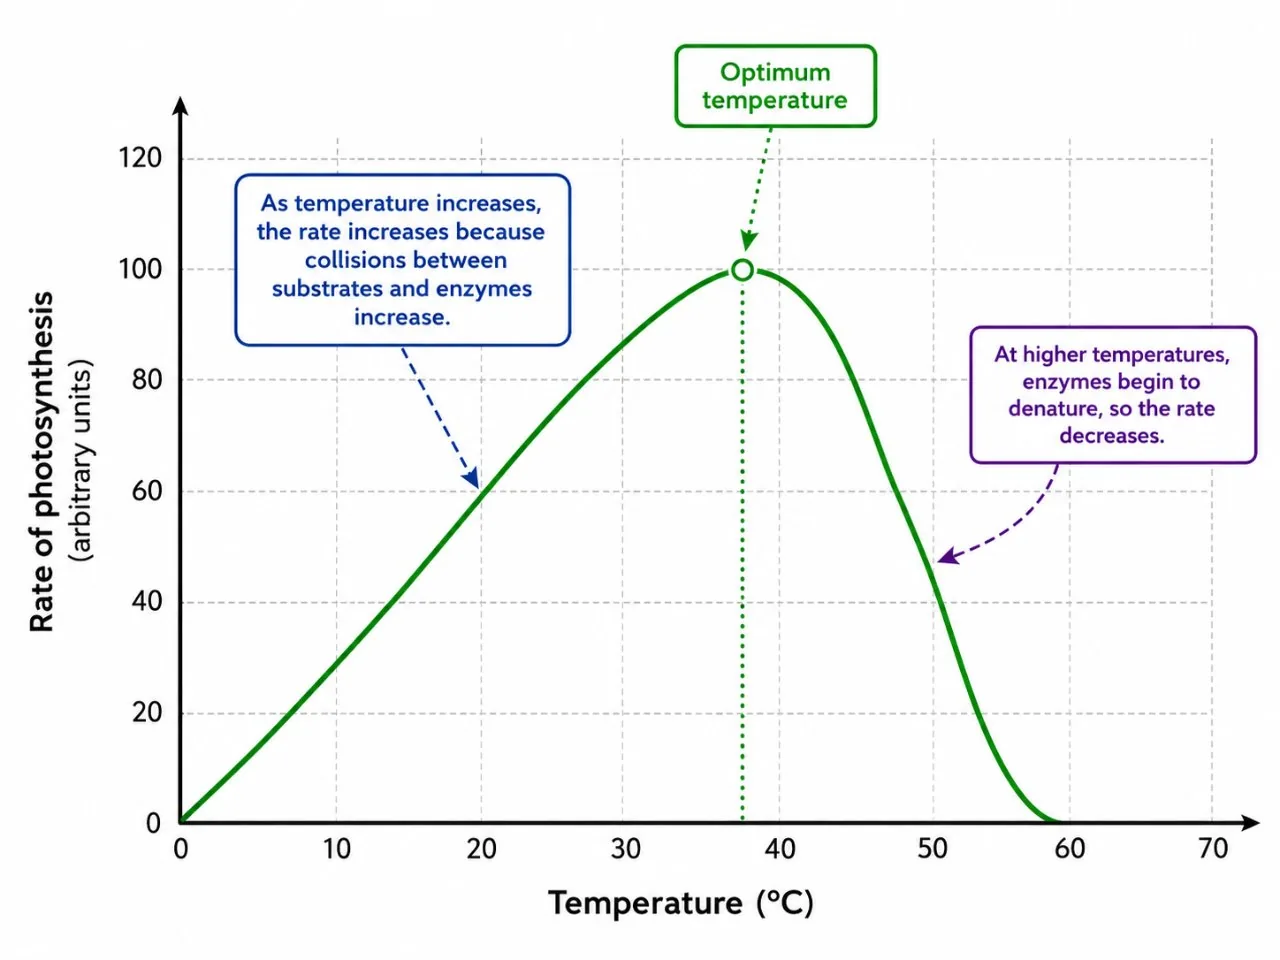
- Temperature Photosynthesis is controlled by enzymes.
- Warming increases the rate because molecules have more kinetic energy and collide more often.
Too hot
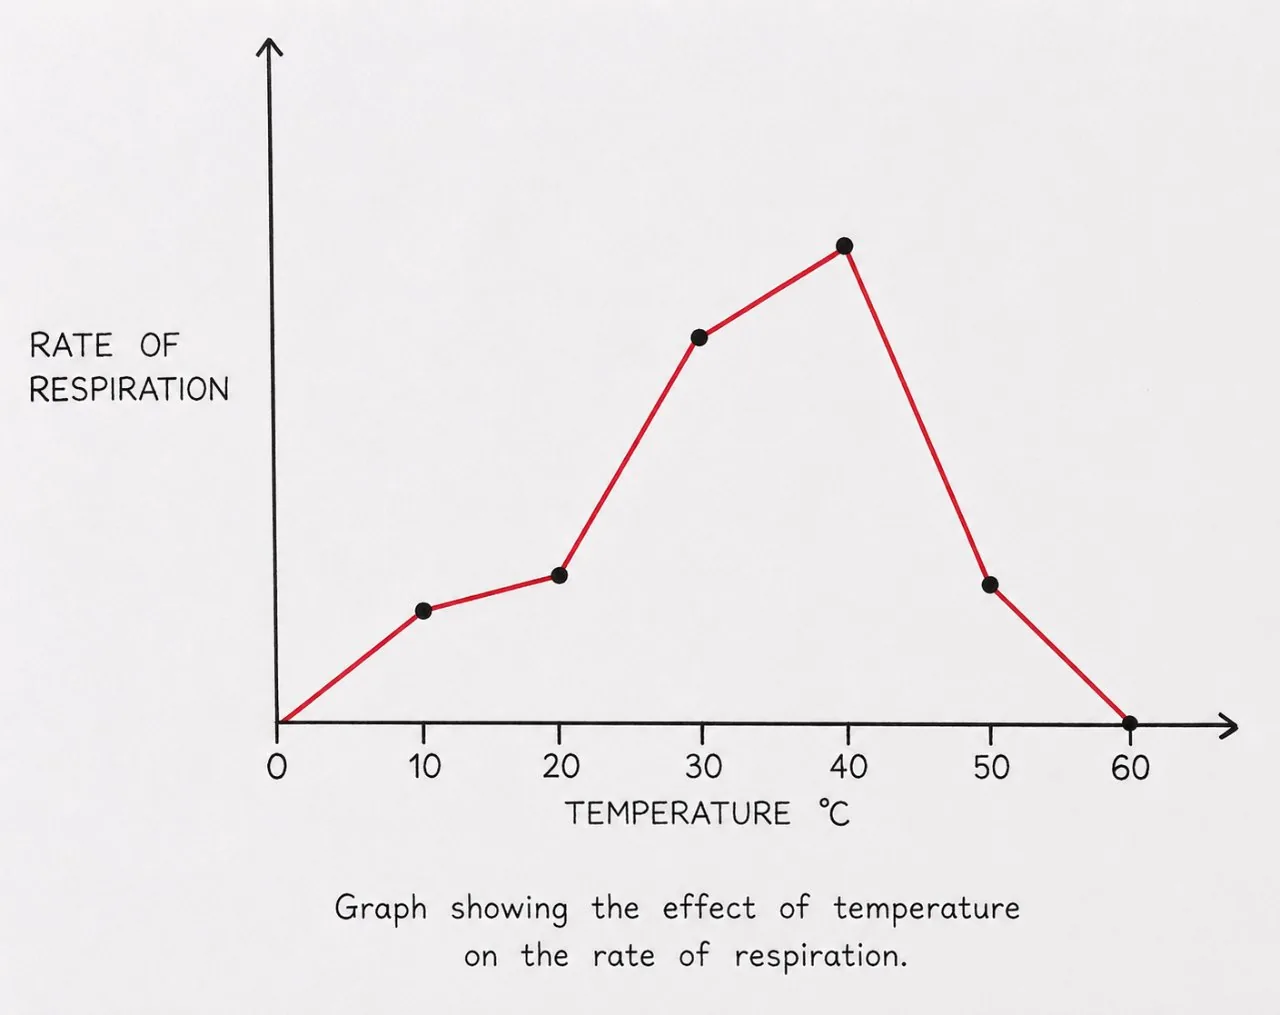
- Too hot Above the optimum temperature the enzymes are denatured and the rate falls.
Section 2 of 6Method: counting bubbles from pondweed
1
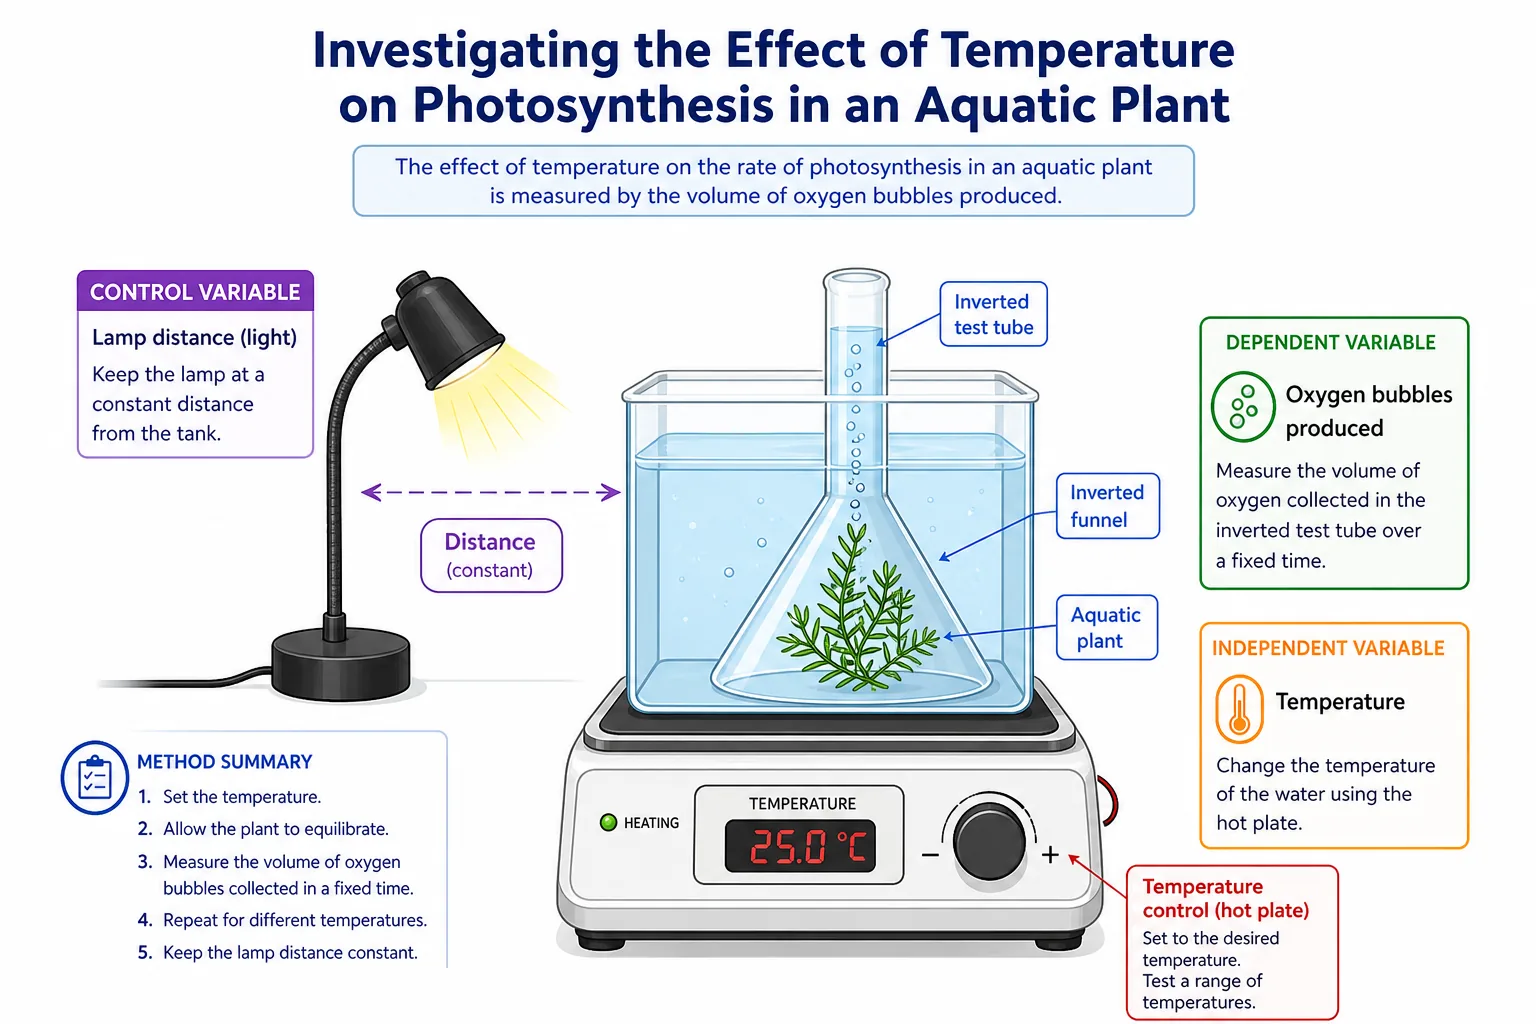
Place a piece of pondweed such as Elodea or Cabomba in a beaker of water, with the cut end upwards.
2
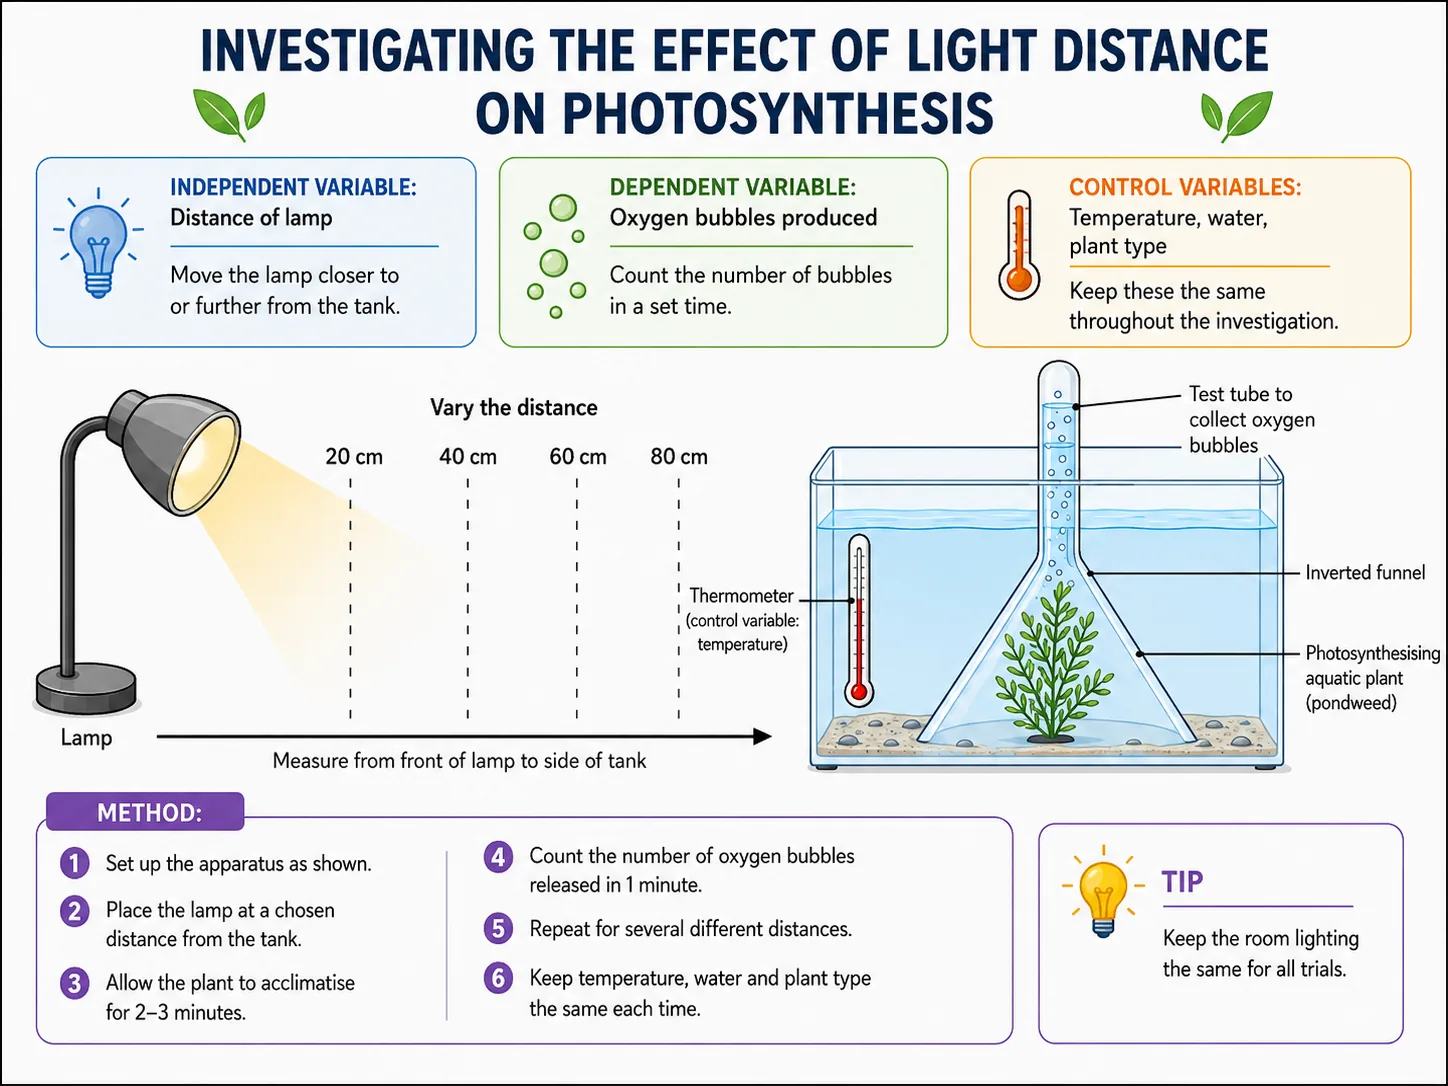
Set up a lamp at a measured distance from the beaker and allow the plant to adjust for a few minutes.
3
Count the bubbles of oxygen released from the cut stem in one minute.
4
Repeat the count to calculate a mean, then change the independent variable and repeat.
5
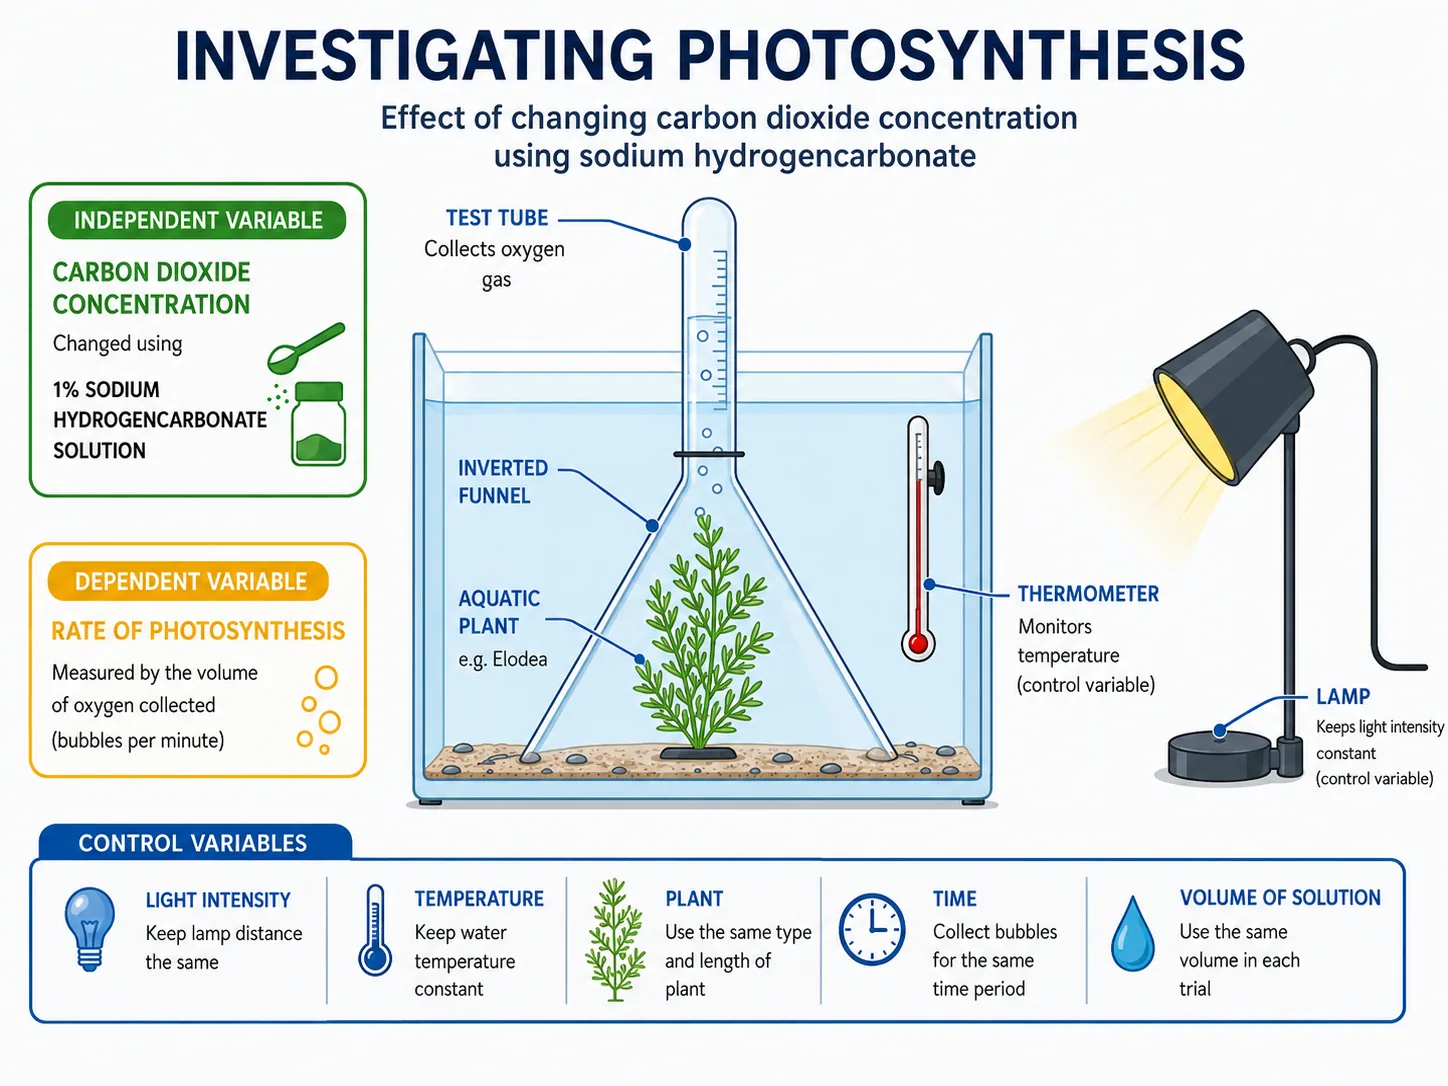
For greater accuracy, collect the oxygen in a gas syringe or an inverted tube over a longer time and measure its volume.
Section 3 of 6Varying each factor
| Factor | How it is varied | Control needed |
|---|---|---|
| Light intensity | Change the distance of the lamp from the beaker | Place a glass tank of water between lamp and plant to absorb heat so the temperature does not change |
| Temperature | Use a water bath set to different temperatures | Same lamp distance and same carbon dioxide level |
| Carbon dioxide concentration | Dissolve different amounts of sodium hydrogen carbonate in the water | Same temperature and light |
Section 4 of 6Interpreting the graphs






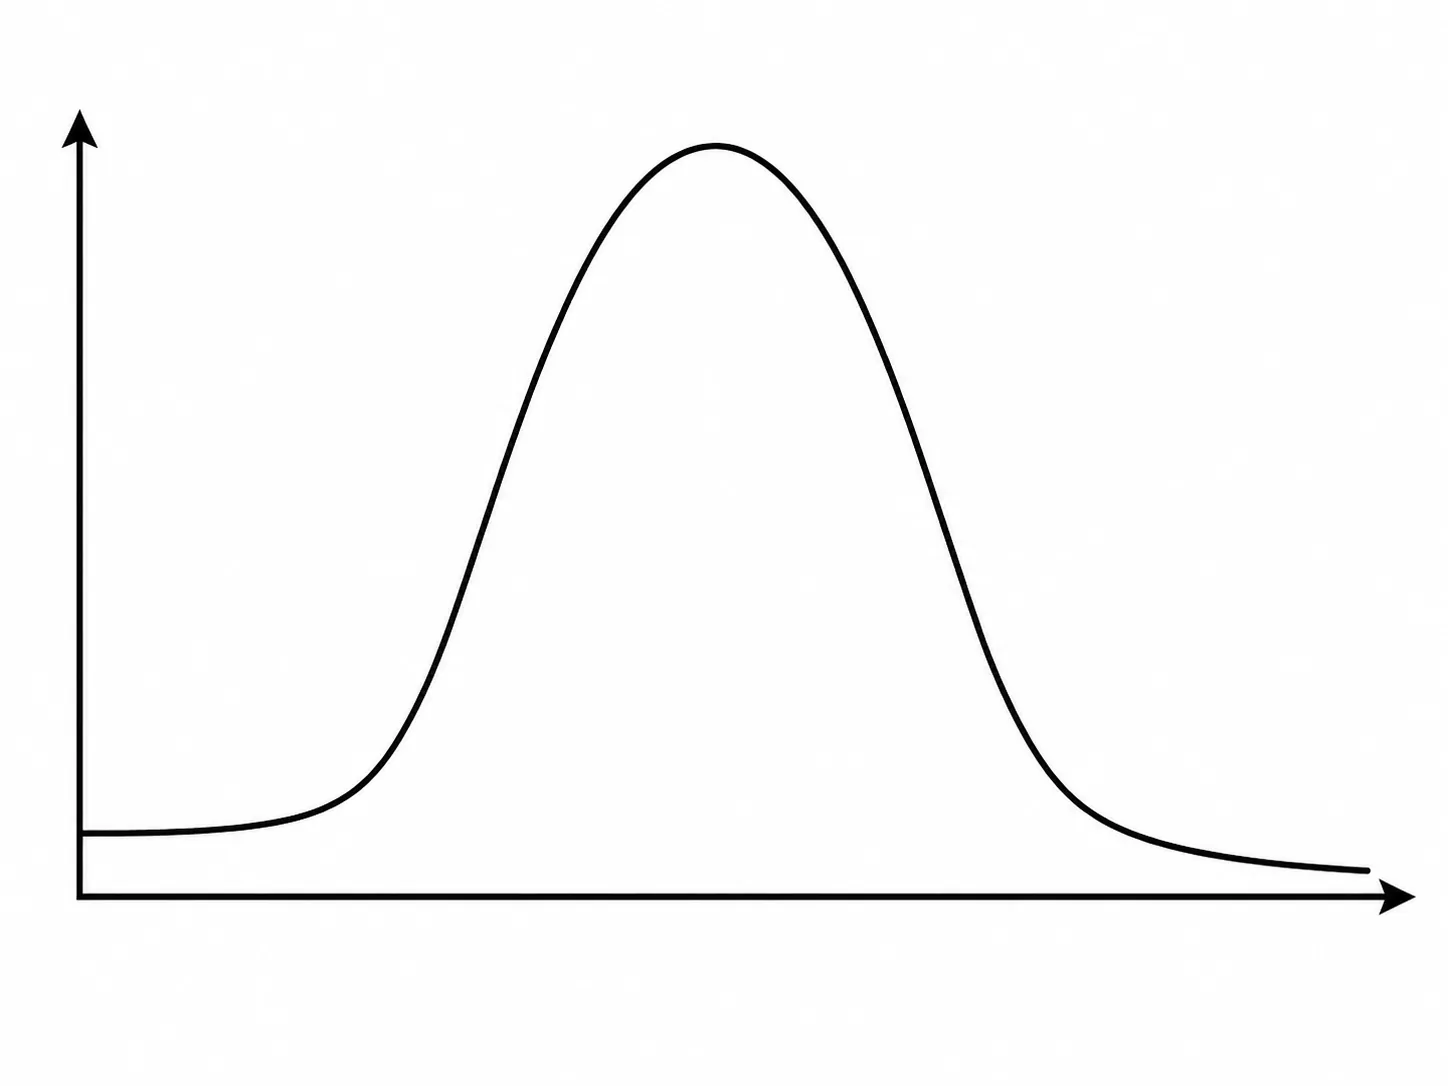


1Rate rises steeply
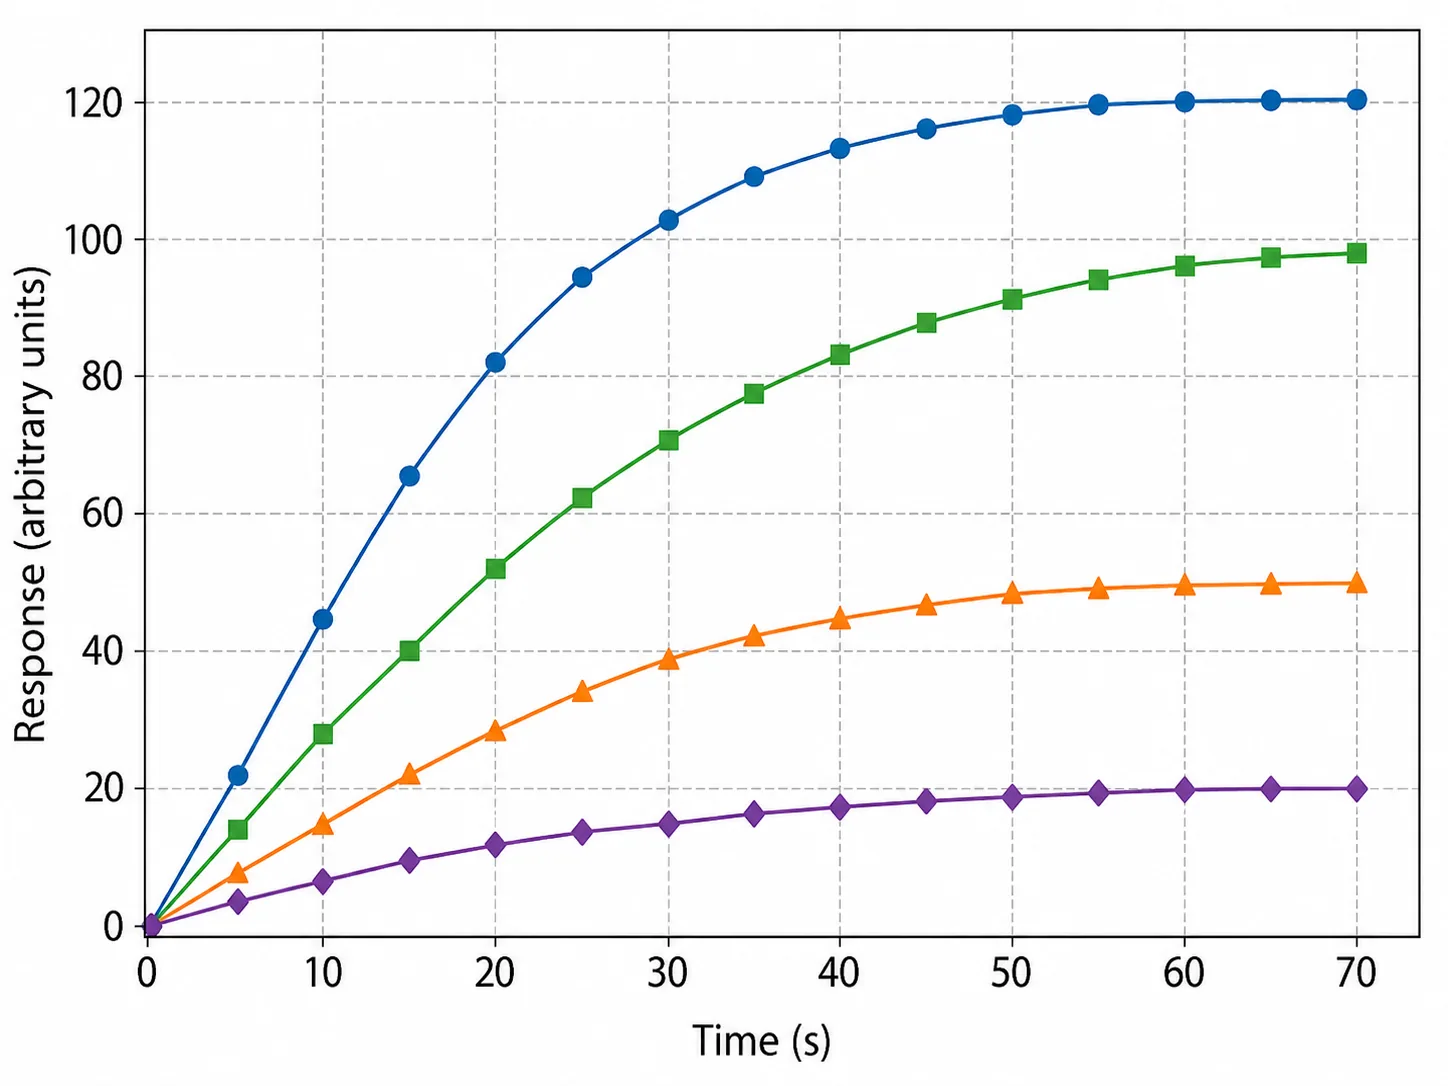
- Rate rises steeply At first the factor being increased is limiting, so the rate increases with it.
2Line begins to level
- Line begins to level Another factor becomes limiting.
3Plateau
- Plateau Adding more of the first factor makes no difference;
- the rate is controlled by a different factor, such as temperature or carbon dioxide.
4Temperature curve falls
- Temperature curve falls At high temperature the enzymes denature, so the rate decreases.
Section 5 of 6Key terms
| Term | Meaning |
|---|---|
| Rate of photosynthesis | How quickly a plant makes glucose, measured here by oxygen released per unit time. |
| Limiting factor | The factor in shortest supply, which limits the rate of a process. |
| Light intensity | A measure of how bright the light is; it decreases as distance from the source increases. |
| Sodium hydrogen carbonate | A compound that dissolves in water to provide carbon dioxide for the plant. |
| Aquatic plant | A plant that grows in water, such as Elodea, used because its oxygen bubbles can be seen. |
Section 6 of 6Exam technique
1
Saying that raising temperature always increases photosynthesis; beyond the optimum, enzymes denature and the rate drops.
2
Not controlling temperature when changing light distance, because the lamp also heats the water.
3
Counting bubbles for too short a time or only once, which gives unreliable results.
4
Assuming the graph levels off because the plant has 'run out of light', when another factor has become limiting.
5
Forgetting to explain that bubbles of gas are oxygen, a product of photosynthesis.
Marked practiceQuizzes for this lesson
Biology 0610 & 9700 Exam Model
Limiting Factors Master
Photosynthesis: Limiting Factors & Graph Plateau
6CO2 + 6H2O → C6H12O6 + 6O2 (Light & Chlorophyll required)
- Limiting Factor Definition: Something present in the environment in such short supply that it restricts life processes.
- Graph Plateau: When rate levels off as light intensity increases, light is no longer the limiting factor; CO2 concentration or temperature has become limiting.
- High Temperature Drop: Beyond optimum temp (~40°C), enzymes (e.g. RuBisCO) denature, permanently decreasing rate.