Section 1 of 9Monohybrid crosses
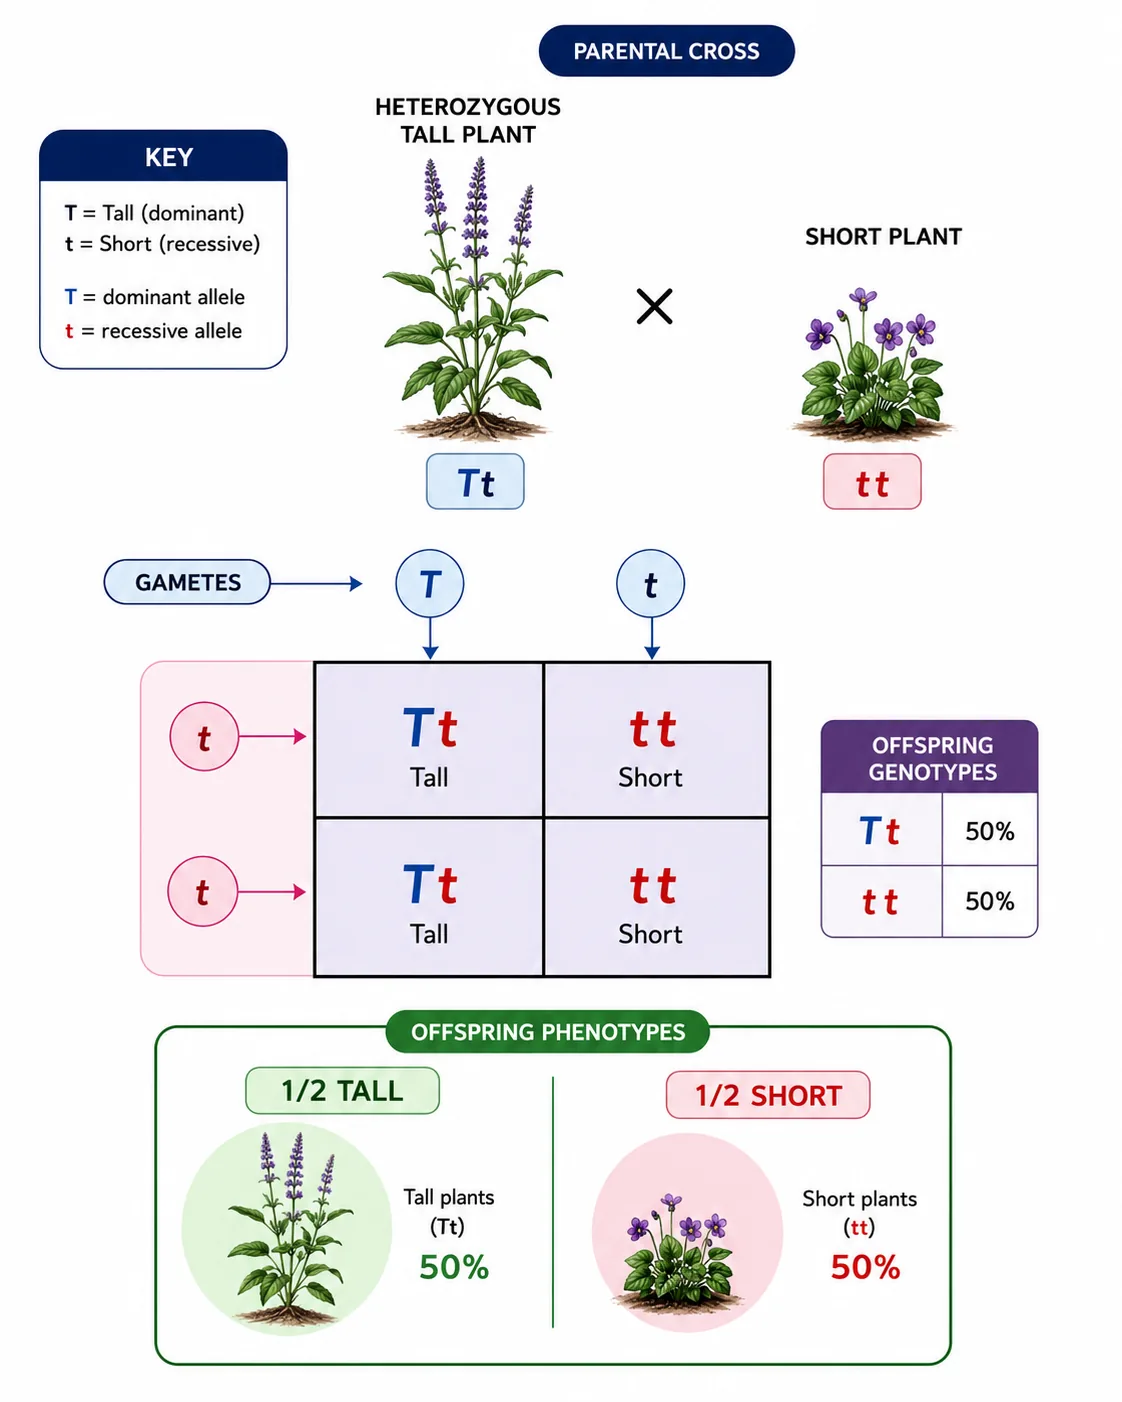

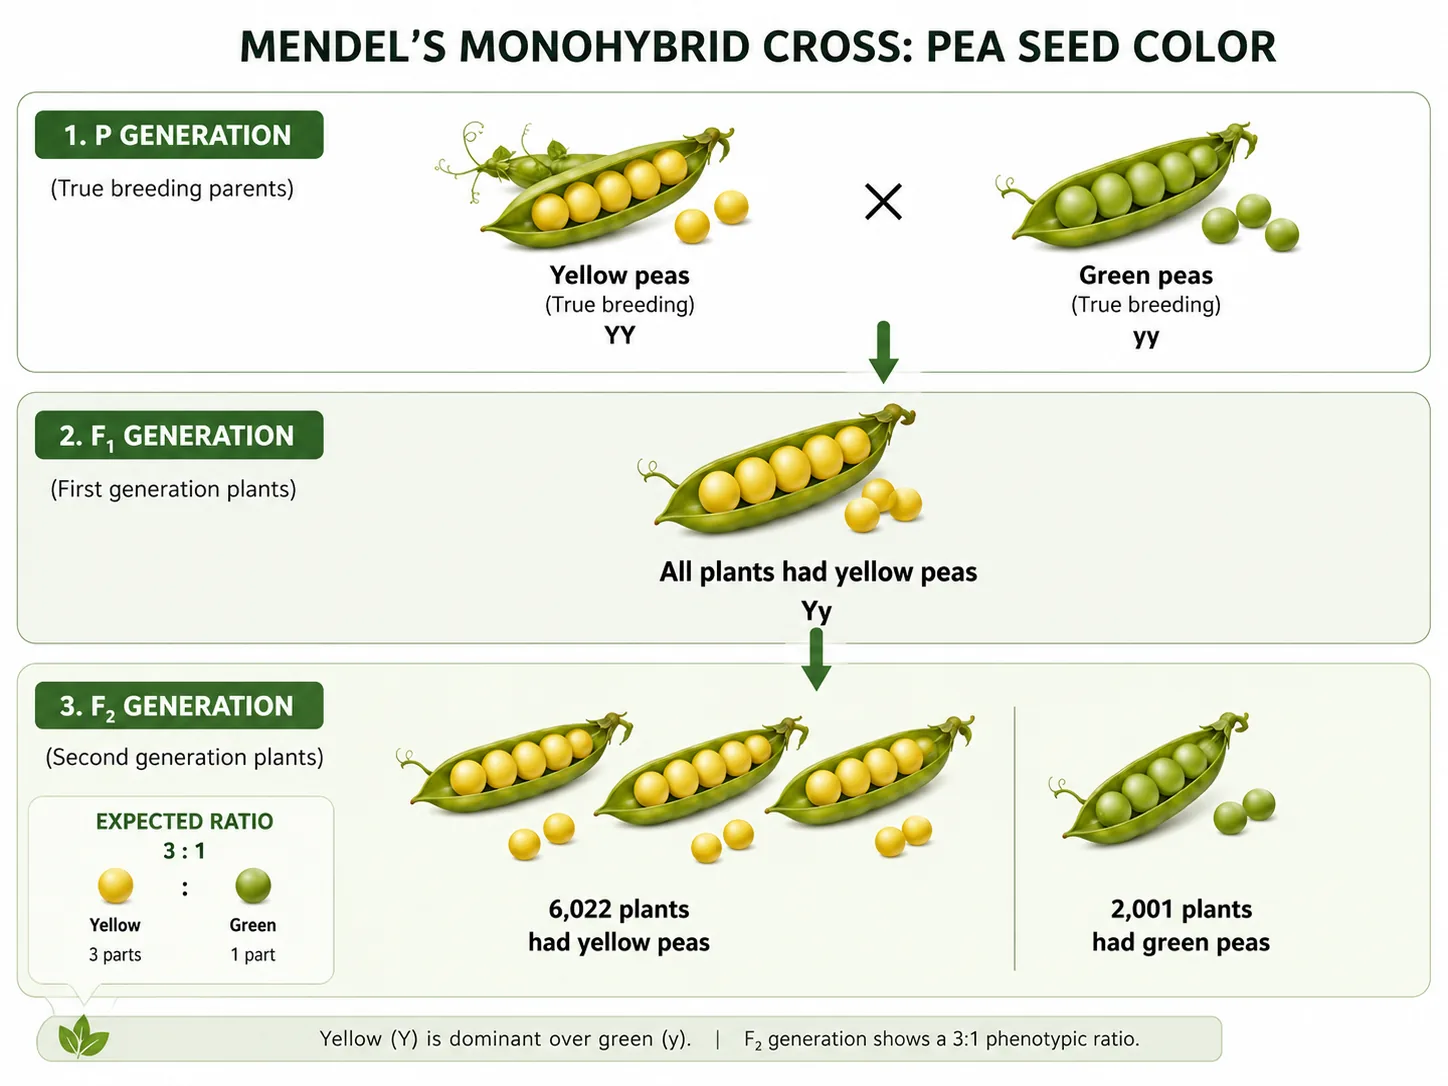

A monohybrid cross follows the inheritance of one gene with two alleles. A genetic diagram shows the parents, the gametes they produce, and the possible offspring. Follow these steps every time:
Section 2 of 9Example: heterozygous parents


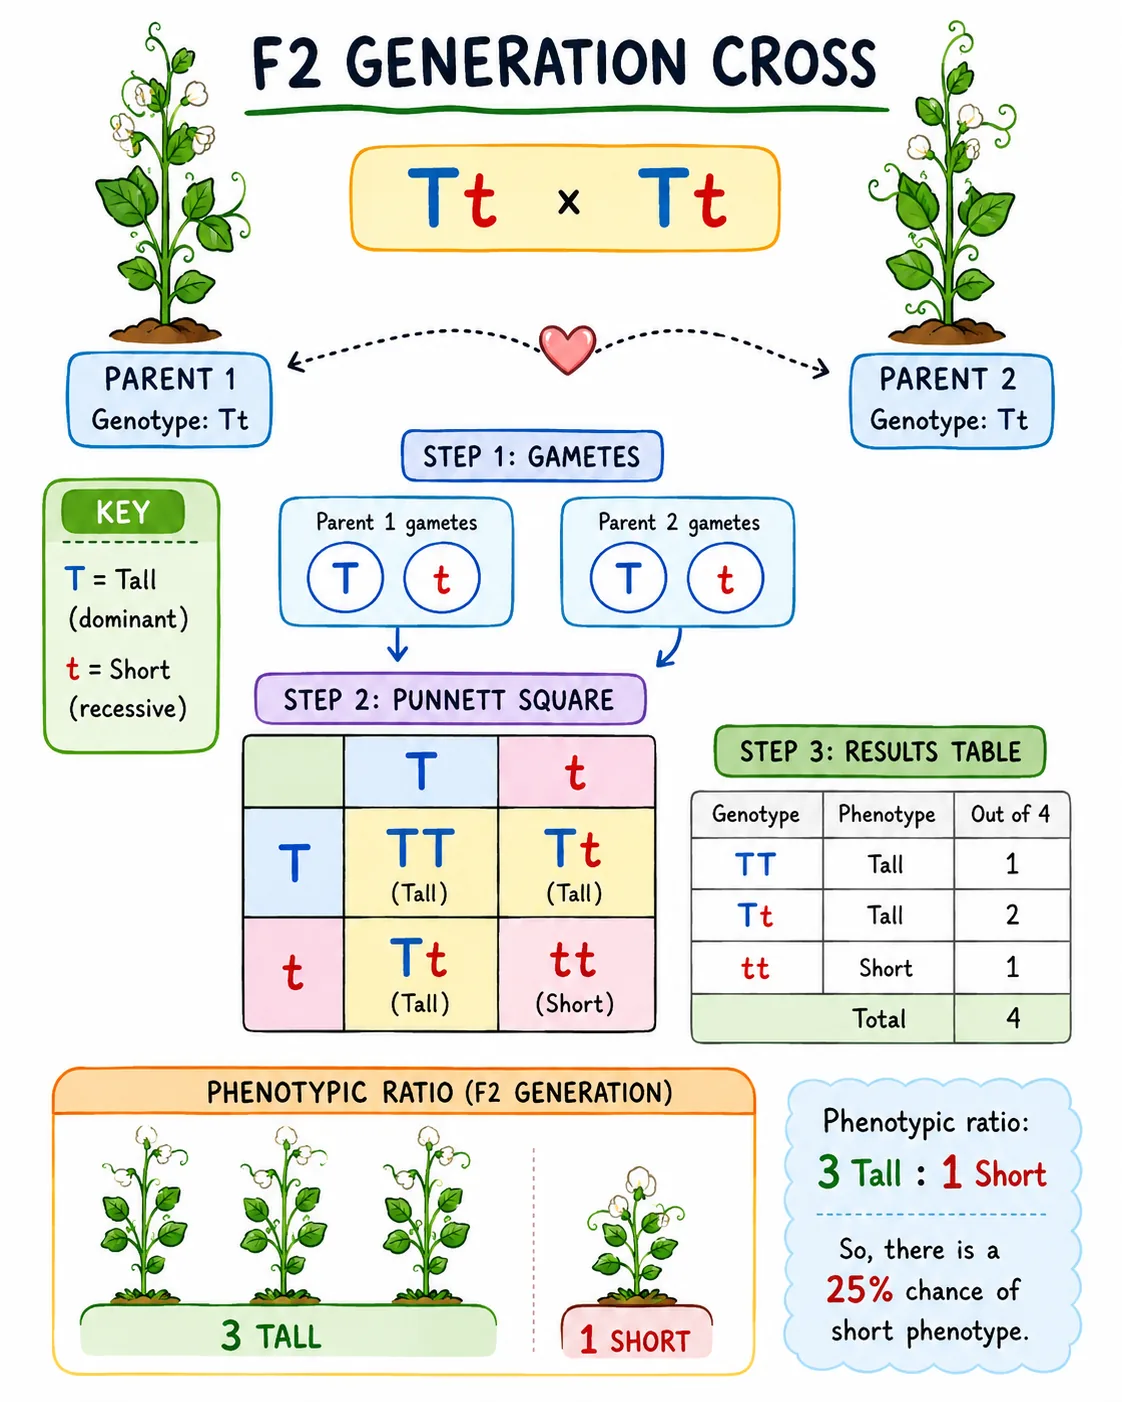
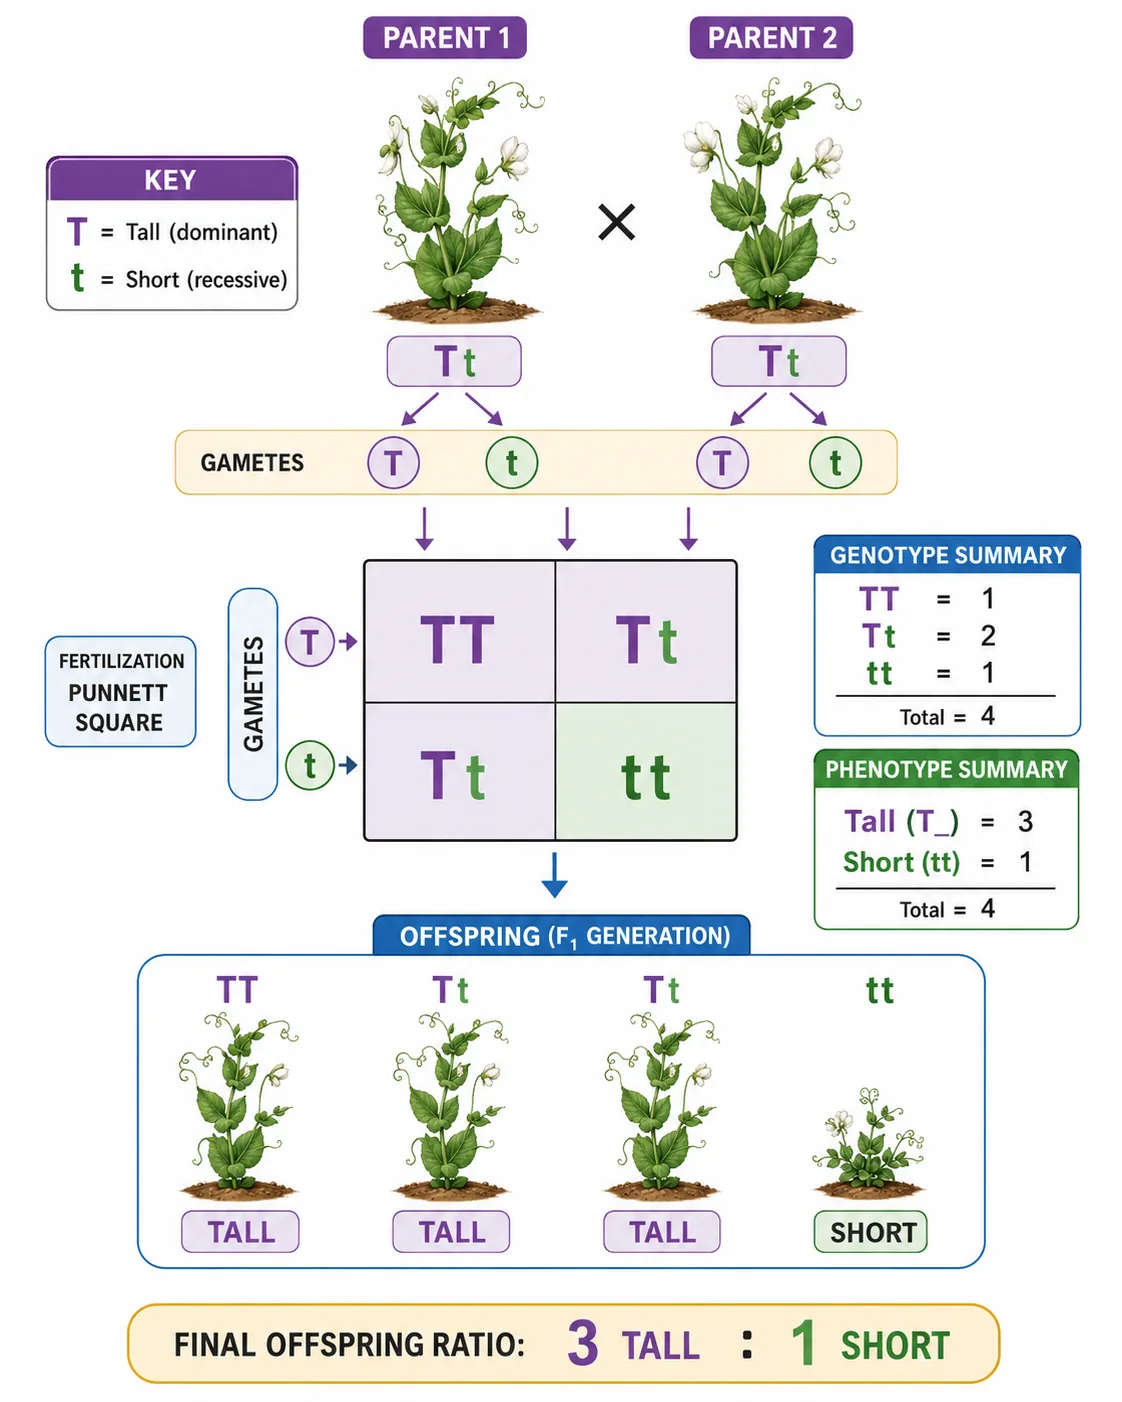
Cross two heterozygous plants, Tt x Tt. The gametes from each parent are T or t.
| T | t | |
|---|---|---|
| T | TT | Tt |
| t | Tt | tt |
The genotypes occur in the ratio 1 TT : 2 Tt : 1 tt.
Section 3 of 9Other crosses
Homozygous dominant x homozygous recessive (TT x tt) gives all Tt, all tall (F1). Heterozygous x homozygous recessive (Tt x tt) gives 1 Tt : 1 tt, a 1 : 1 ratio of tall to short; this is the test cross. Homozygous dominant x anything gives all offspring showing the dominant phenotype.
Ratios are predictions based on probability. Small families rarely show exact ratios, but in large numbers of offspring the observed results come closer to the predicted ones, the same reason that Mendel counted so many plants.
Section 4 of 9Family pedigrees

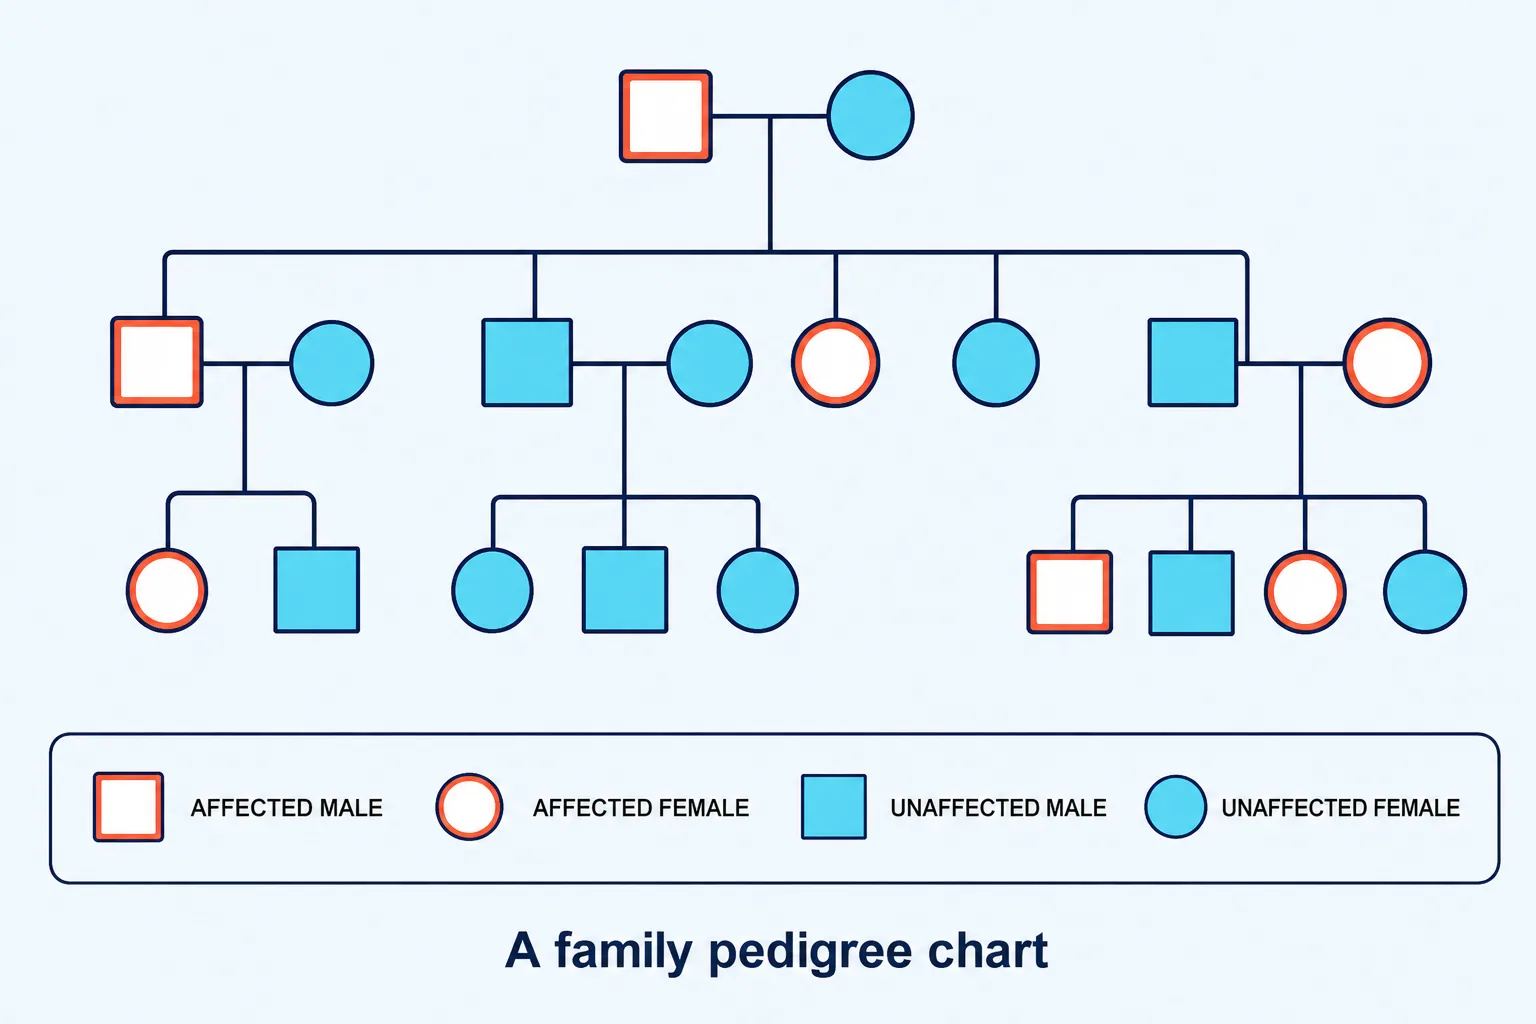
A family tree (pedigree) can show how an inherited condition passes through a family.
Cystic fibrosis is a standard example. A person with the condition has the genotype ff; their parents are both Ff. Cystic fibrosis affects roughly 1 in 2500 births in the UK and 1 in 25 people carry the allele.
Section 5 of 9Probability and decisions
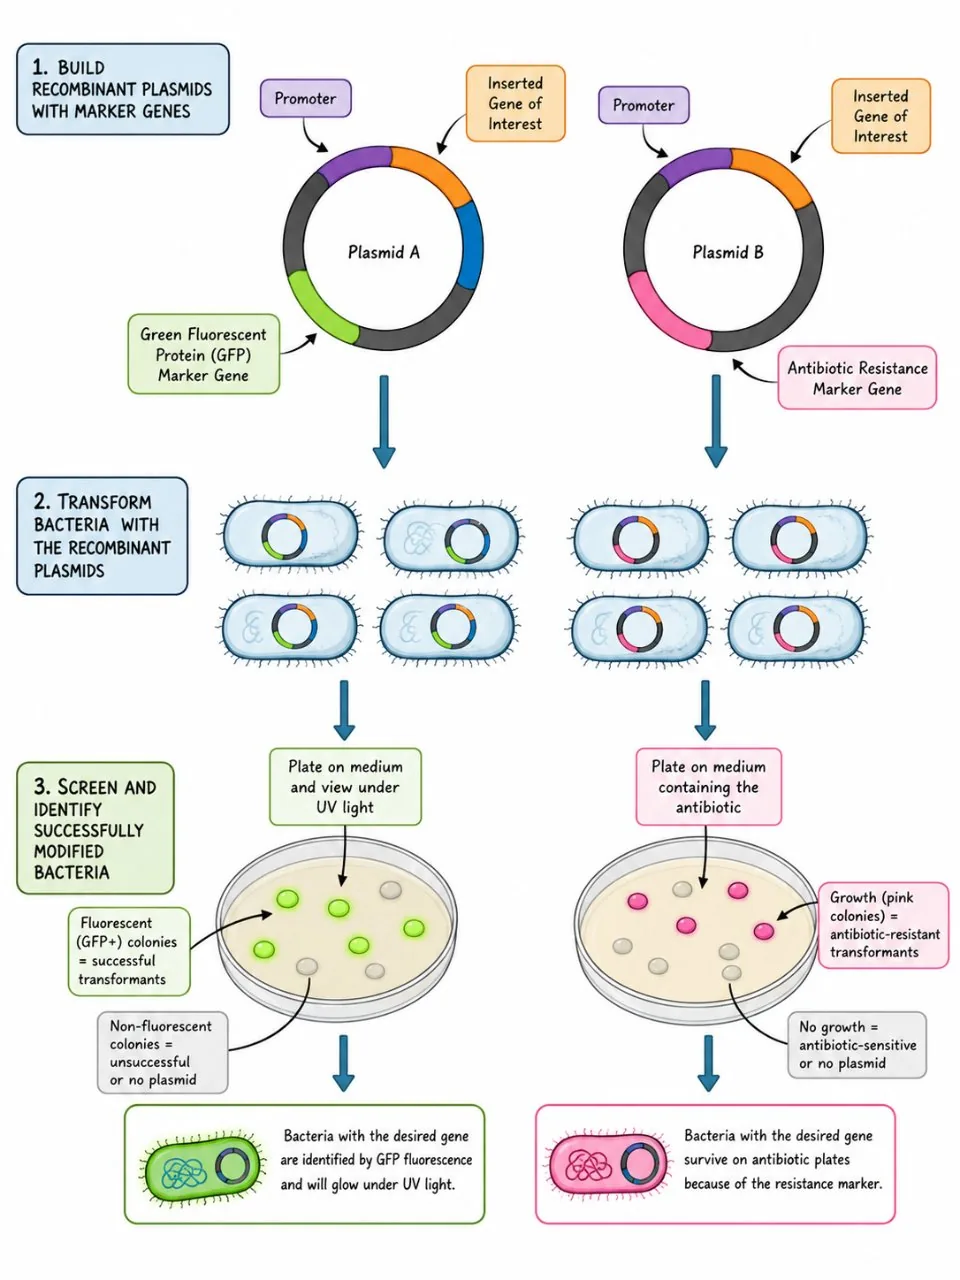
Genetic diagrams give probabilities, not certainties.
Keep a clear layout, show the gametes in circles if your teacher uses them, and always state the phenotype in words. Markers look for the key, parent genotypes, gametes, offspring genotypes and final ratio, so missing one can lose a mark even when the square is correct.
Section 6 of 9Using ratios and sample sizes
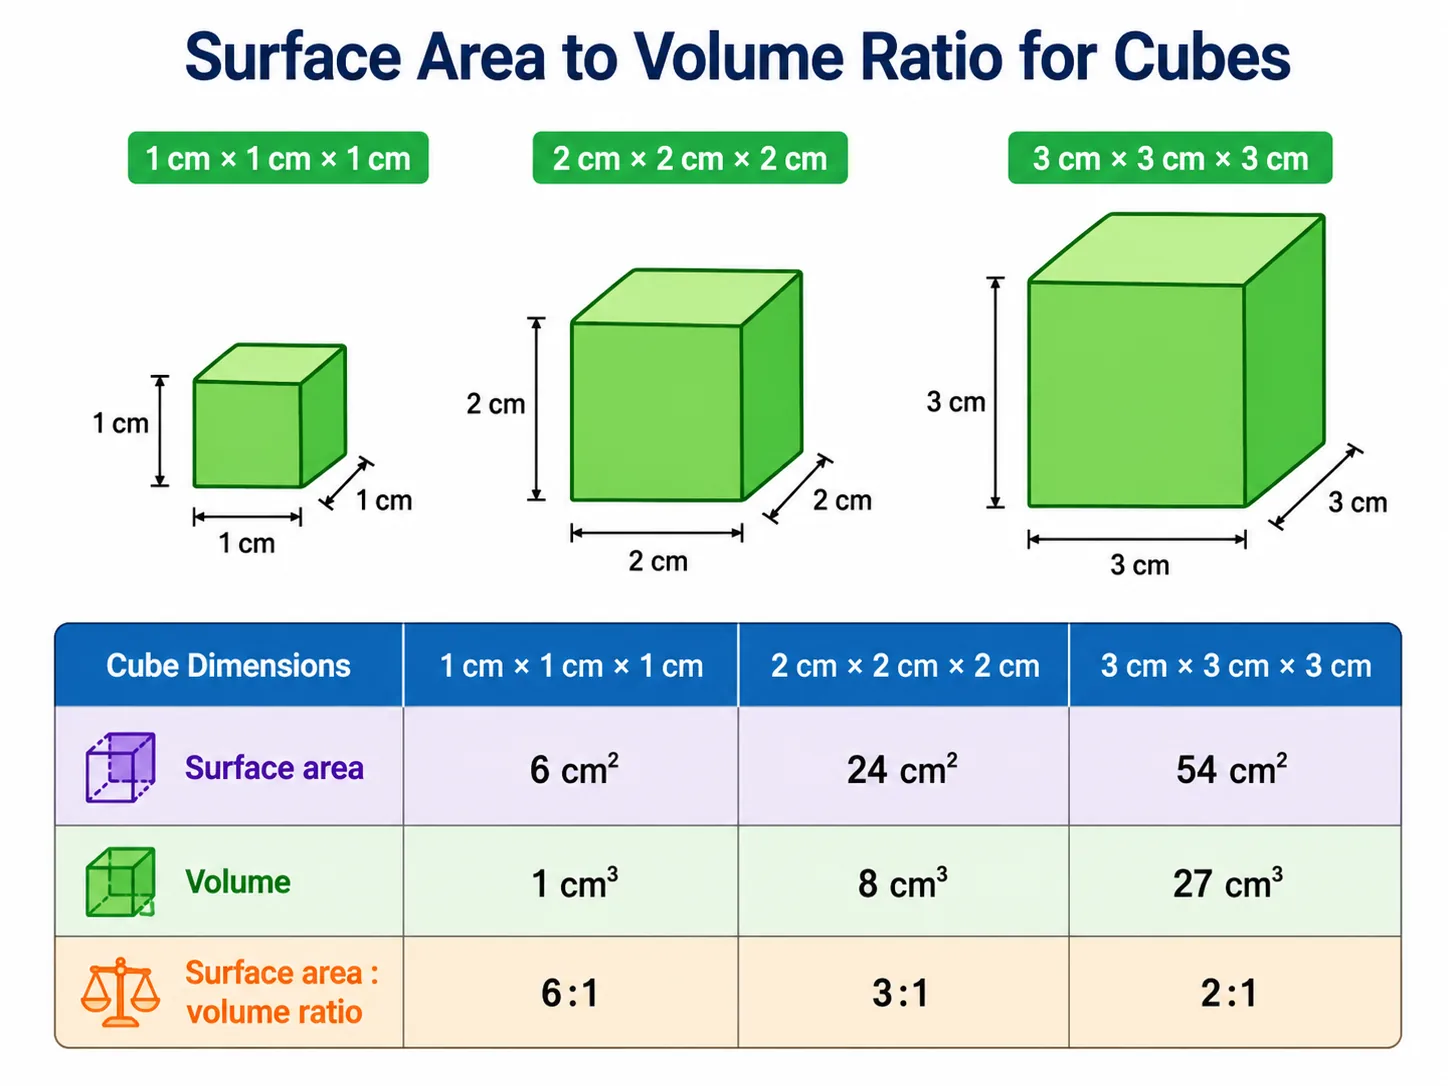
To turn a predicted ratio into numbers, divide the total by the sum of the parts.
- and the difference is explained by chance in which gametes meet at fertilisation.
- which the breeder could test.
You may meet a question where a result is given as a ratio of genotypes, as a ratio of phenotypes, or as a probability. Check the question carefully, and always show the working: the key, parent genotypes, gametes, Punnett square, offspring genotypes and the final statement in words.
Section 7 of 9Exam-style questions





In cats, the allele for black fur (B) is dominant to the allele for ginger fur (b). Two heterozygous black cats are mated. Draw a genetic diagram to show the possible offspring and state the probability that a kitten is ginger. [5]5 marks
Parents Bb x Bb [1]; gametes B, b and B, b [1]; offspring BB, Bb, Bb, bb [2]; probability of ginger (bb) = 1 in 4, 25% or 0.25 [1].
Two parents without cystic fibrosis have a child with the condition. Explain how this is possible. [3]3 marks
Cystic fibrosis is caused by a recessive allele [1]; both parents are heterozygous carriers (Ff) [1]; each passed on the recessive allele in their gametes, so the child is ff [1].
A heterozygous tall plant is crossed with a short plant. In total 60 offspring are produced. Predict the number of short plants. [2]2 marks
Tt x tt gives a ratio 1 tall : 1 short [1]; so 30 short plants expected [1].
Section 8 of 9Key terms
| Term | Meaning |
|---|---|
| Monohybrid cross | A genetic cross that looks at the inheritance of one gene. |
| Punnett square | A grid showing all possible combinations of gametes in a cross. |
| Genetic diagram | A diagram showing parents, gametes and offspring of a cross. |
| Ratio | A comparison of the numbers of each phenotype, such as 3:1. |
| Probability | The chance of an outcome happening. |
| Pedigree | A family tree showing the inheritance of a feature. |
| Carrier | A person with one copy of a recessive allele who does not show the condition. |
| Test cross | A cross with a homozygous recessive to find an unknown genotype. |