Section 1 of 9Single-gene and polygenic characteristics

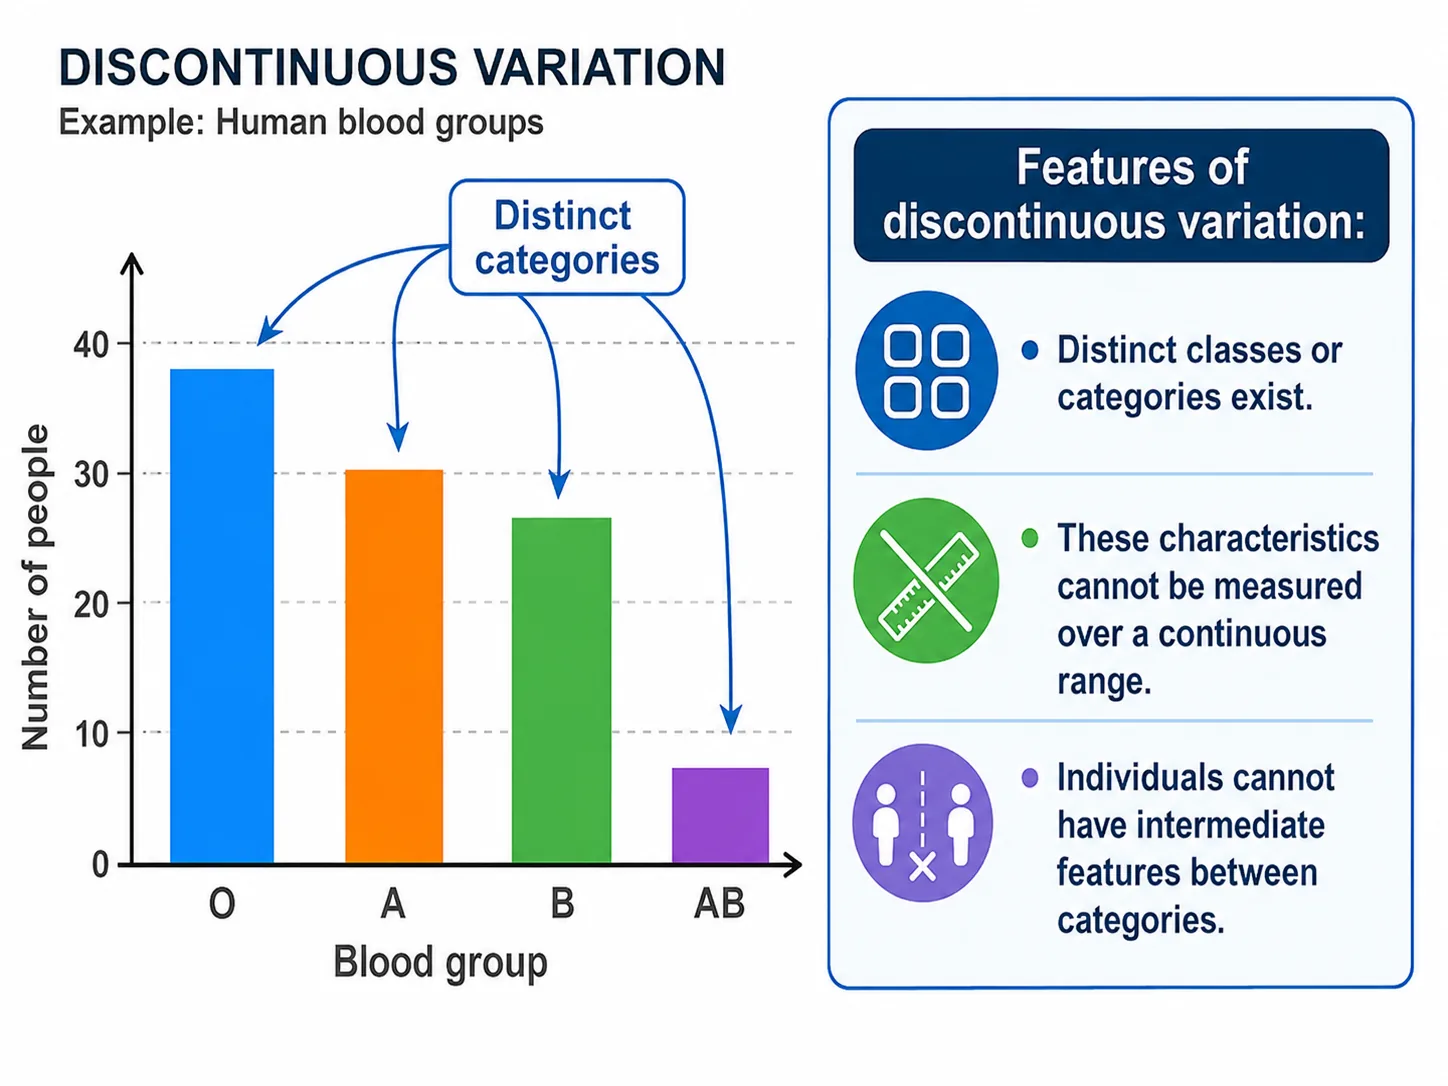
So far, we have looked at characteristics controlled by a single gene, such as pea height or blood group.
Section 2 of 9Continuous variation

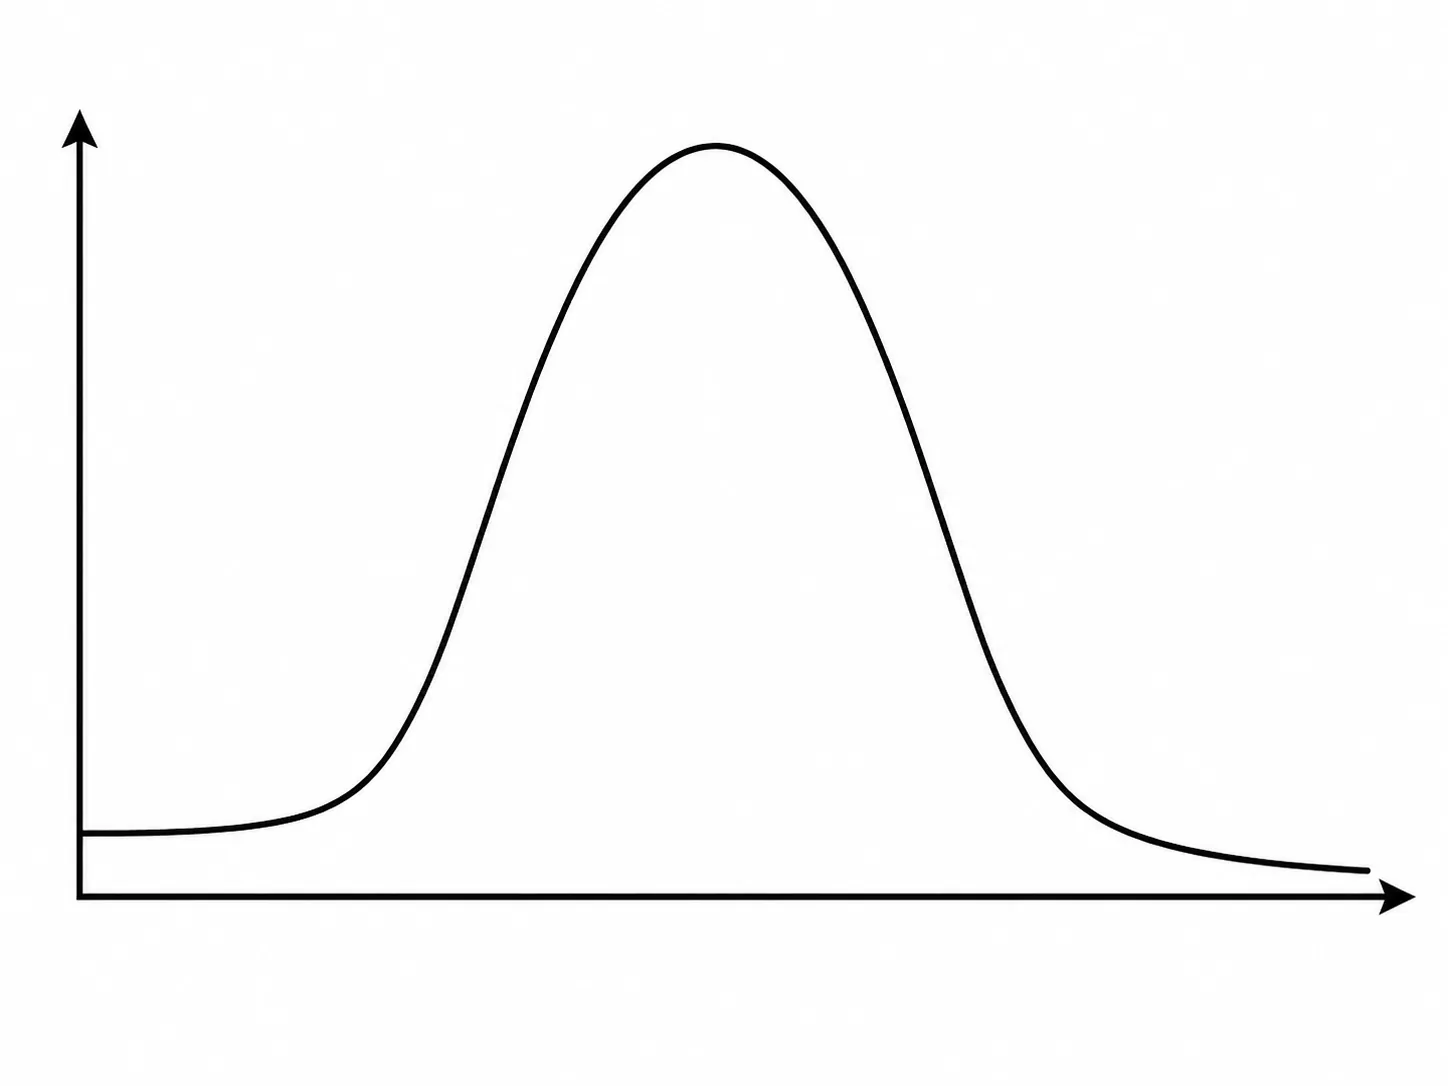

With many genes involved, there are many possible combinations of alleles, so individuals show every value in a range.
| Feature | Continuous variation | Discontinuous variation |
|---|---|---|
| Number of categories | A complete range of values | Distinct categories |
| Genes | Often many genes (polygenic) plus environment | Usually one or a few genes |
| Examples | Height, mass, skin colour | Blood group, tongue rolling |
| Graph | Histogram or line (bell shape) | Bar chart |
Section 3 of 9The role of the environment
Many polygenic features are also affected by the environment.
- so differences between them,
- such as in body mass or health, are largely the result of environmental influences,
- and studies of twins are used to separate effects of genes and environment.
Section 4 of 9Why polygenic traits do not give simple ratios
Mendel's 3:1 ratios appear only for single-gene characteristics with clear dominance.
- so it is impossible to predict the phenotype with a Punnett square.
- and this is described using the average and spread of values.
Polygenic traits can also be influenced by selection: in a population, if tall individuals are selected, the mean height of the next generation increases, which relates to selective breeding and evolution.
Section 5 of 9Genes, health and lifestyle
Many common diseases, such as heart disease, type 2 diabetes and some cancers, are influenced by many genes and the environment, so they are not inherited in a simple way.
Section 6 of 9Measuring and displaying variation
Continuous variation is investigated by measuring a large random sample, for example the heights of 100 students, and grouping the values into classes (such as 150-154 cm, 155-159 cm).
Discontinuous characteristics such as blood group are shown as a bar chart with gaps between bars, since the categories are separate.
- and for any influence of the environment that would need to be controlled.
Selection for polygenic characteristics can shift the whole distribution. In crops and farm animals, breeders choose the highest-yielding individuals as parents, and over many generations the mean yield rises, even though no single gene is responsible.
Section 7 of 9Exam-style questions


Explain why human height shows continuous variation. [3]3 marks
Height is controlled by many genes (polygenic) [1]; each has a small additive effect, so many combinations of alleles are possible and there is a range of values [1]; environmental factors such as diet also influence height, which blurs any categories [1].
Give one example of continuous variation and one of discontinuous variation in humans. [2]2 marks
Continuous: height, body mass or skin colour [1]. Discontinuous: blood group (or ability to roll tongue) [1].
Identical twins separated at birth grow up in different environments. One twin is 4 cm taller than the other. Suggest an explanation. [2]2 marks
They have identical genes [1], so the difference must be due to environmental factors such as diet or health [1].
Section 8 of 9Key terms
| Term | Meaning |
|---|---|
| Polygenic inheritance | Control of a characteristic by many genes acting together. |
| Continuous variation | A full range of values of a characteristic, with no distinct categories. |
| Discontinuous variation | Distinct categories with no intermediates. |
| Environmental variation | Differences caused by environment such as diet or climate. |
| Phenotype | The observable characteristics, produced by genes and environment. |
| Normal distribution | A bell-shaped curve of the frequency of values around the mean. |
| Melanin | The pigment that gives colour to skin. |