Section 1 of 8Why we sample
It is usually impossible to count every organism in a large area such as a field. Instead, ecologists take samples from small parts of the area and use them to estimate the whole. For a sample to be reliable it must be representative, which means large enough and taken without bias.
Section 2 of 8Using a quadrat to estimate population size


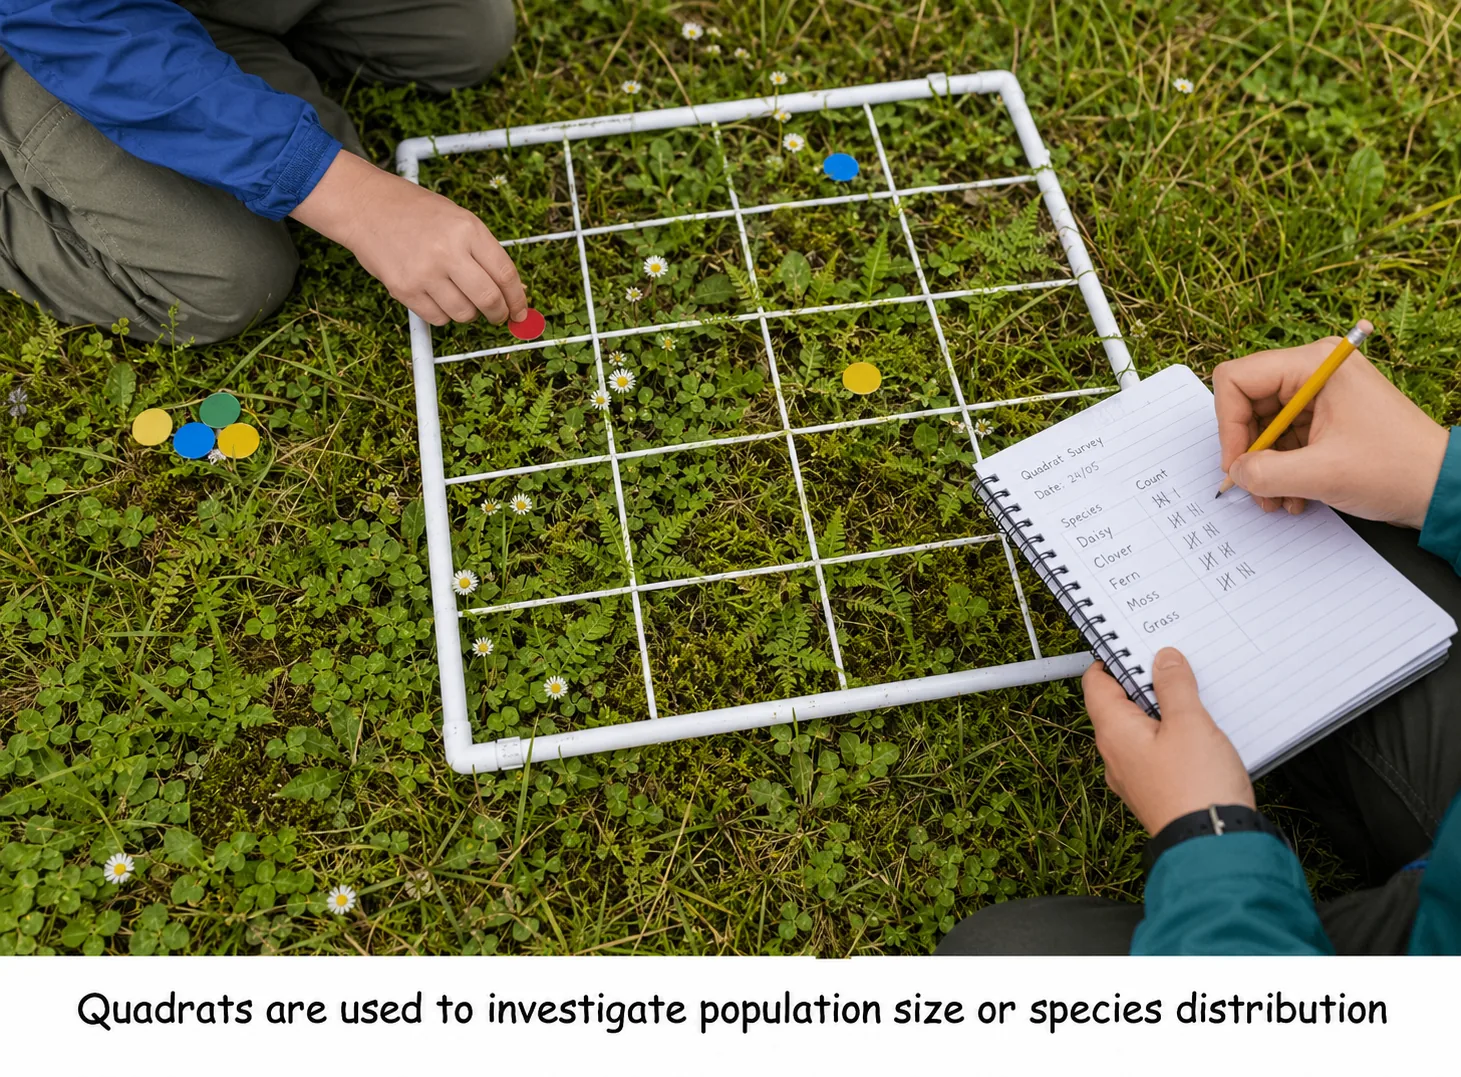
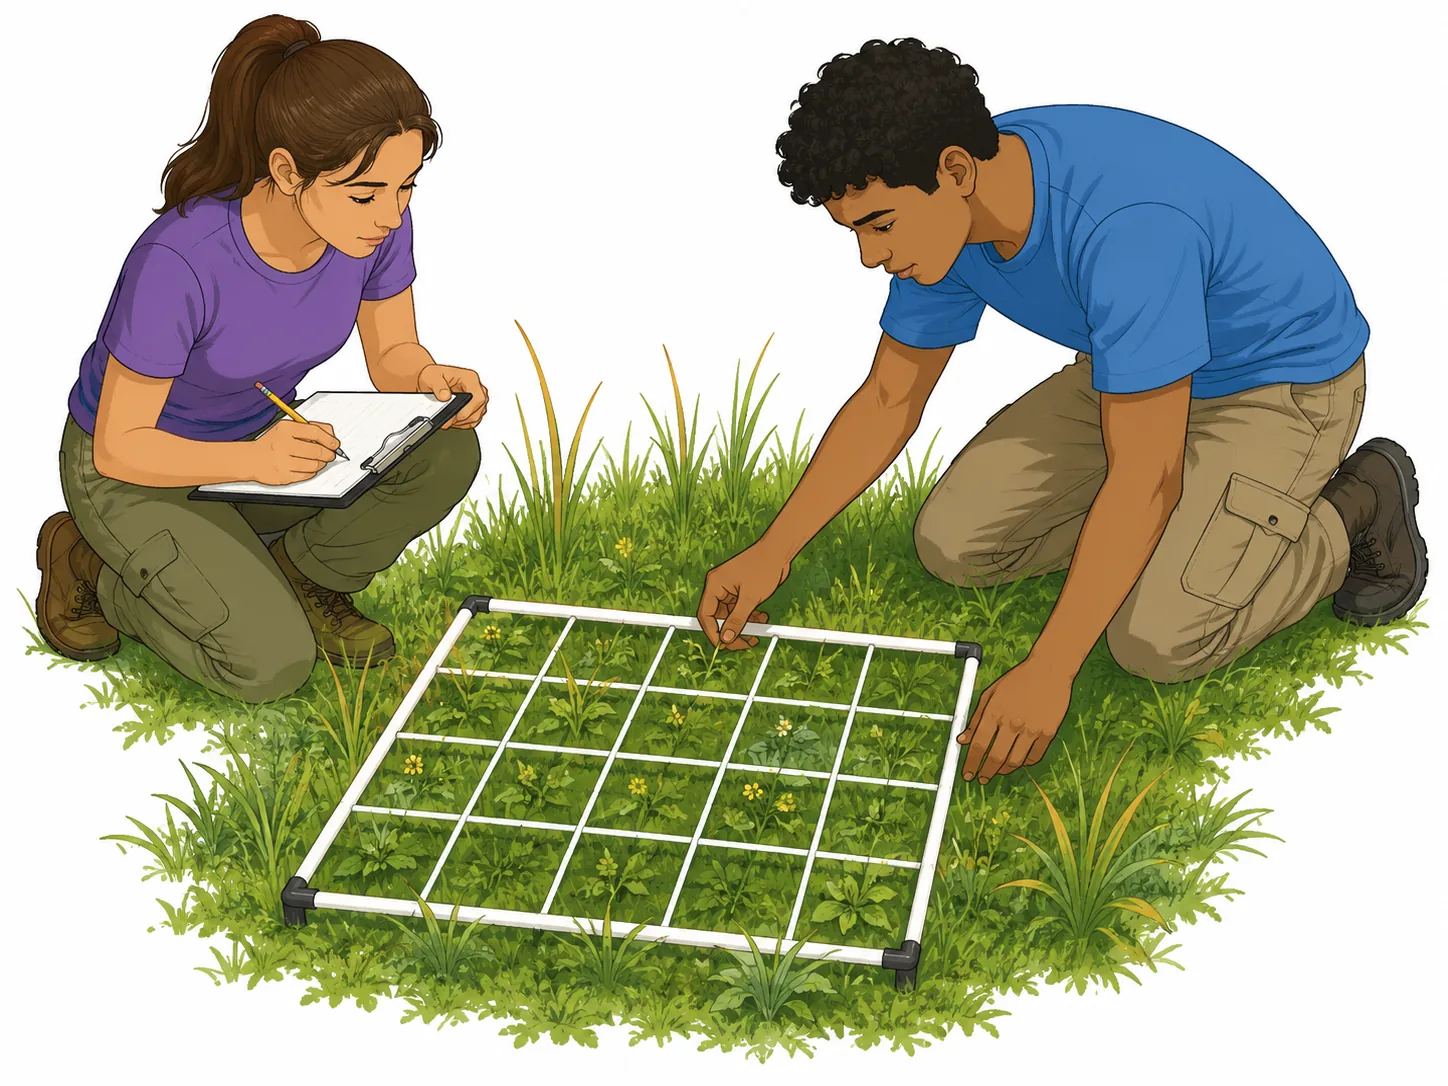
A quadrat is a square frame, often 0.5 m by 0.5 m or 1 m by 1 m, placed on the ground to mark out a sample area. The method for estimating the population of a plant such as daisies in a field is:
Random placement is essential to avoid bias, such as only choosing places where plants look plentiful. To estimate the total population, calculate the mean number per square metre and multiply by the total area:
Population estimate = mean number per m2 × total area in m2
You can also estimate percentage cover for plants that are hard to count individually, such as grass, by estimating the percentage of each quadrat covered by the species.
Section 3 of 8Using a transect to study distribution

To find out how the distribution of a species changes across a habitat, such as from a hedge into a field or from the shade of a tree into the open, a transect is used.
- and the results can be compared with abiotic factors measured at the same points,
- such as light intensity or soil moisture.
Section 4 of 8Reliability and animals
- and measure abiotic factors using the same method.
- To compare two areas, such as a shaded and an open field, you must keep every other variable the same.
- Other methods are used for animalspitfall traps for ground invertebrates, sweep nets for insects in long grass,
- and pooters for small insects.
- Mobile animals can be sampled with a capture-mark-recapture technique, but this is more advanced than the GCSE requirement.
- and are the starting point for judging human impact on ecosystems.
Section 5 of 8Worked example: interpreting results
Suppose a student places ten quadrats along a transect that begins at a hedge and ends 20 m into a field, and records the number of dandelions.
- which fits the idea that dandelions need high light for photosynthesis.
The standard way to improve such an investigation is to take more transects and average them, use more quadrats at each point, and measure the other abiotic factors. Calculating a mean reduces the effect of anomalies, and identifying an anomaly (for example a count that does not fit the pattern) and repeating it improves reliability.
Safety and ethics also appear in exam questions. Wear gloves when working with soil, avoid damaging the habitat by trampling it, return any animals to the place where they were collected and wash your hands after the fieldwork.
Section 6 of 8Exam-style questions

A student counted daisies in ten 1 m2 quadrats placed randomly in a field of area 800 m2. The total number counted was 45. Calculate the estimated population of daisies in the field. [3]3 marks
1. Mean per quadrat = 45 / 10 = 4.5 per m2 [1].
2. Estimated population = 4.5 × 800 [1].
3. = 3600 daisies [1].
Describe how you would investigate the effect of light intensity on the distribution of moss from the base of a large tree outwards. [4]4 marks
11. Lay a tape measure in a straight line from the tree outwards to make a transect [1].22. Place a quadrat at regular intervals, such as every 1 m [1].33. Record the percentage cover of moss in each quadrat [1].44. Measure light intensity at each point with a light meter and compare with moss cover [1].
Section 7 of 8Key terms
| Term | Meaning |
|---|---|
| Quadrat | A square frame used to mark a small sample area. |
| Transect | A line along which samples are taken to show a gradient in distribution. |
| Random sampling | Choosing sample positions by chance to avoid bias. |
| Percentage cover | The proportion of a quadrat covered by a species, as a percentage. |
| Representative | Typical of the whole area being studied. |
| Mean | The total of the values divided by the number of values. |
| Pitfall trap | A container sunk in the ground to catch small ground-dwelling animals. |