Section 1 of 9What a pyramid shows

A pyramid is a diagram in which each horizontal bar represents one trophic level, with producers at the base. The width of each bar represents the quantity at that level. The three types of pyramid you need to know about are pyramids of number, of biomass and of energy.
Section 2 of 9Pyramids of number
A pyramid of numbers shows the number of individual organisms at each trophic level.
- which feed thousands of insect-eating birds,
- so the bar for the producer is very narrow while the bar for the consumers is wider.
Section 3 of 9Pyramids of biomass
Biomass is the mass of living material, usually measured as dry mass, for example in kg per m2.
Biomass pyramids can occasionally appear inverted, in the case of a phytoplankton and zooplankton ecosystem in the sea. Phytoplankton have a small biomass at any moment but reproduce extremely fast, so a small standing stock supports a larger biomass of consumers. This is explained by the fast turnover of the producers.
Section 4 of 9Drawing and using pyramids
To draw a pyramid to scale, choose a scale such as 1 cm for every 10 units. Draw each bar centred on a vertical line so the shape is symmetrical, with the producer at the bottom. Label every bar with the trophic level and the organism.
| Level | Biomass (kg per m2) | Bar width at 1 cm per 10 kg |
|---|---|---|
| Producer | 500 | 50 cm (use a smaller scale if needed) |
| Primary consumer | 50 | 5 cm |
| Secondary consumer | 5 | 0.5 cm |
If the pyramid would be too wide for the page, change the scale, for instance 1 cm for every 100 kg, and the shape stays the same.
Section 5 of 9What pyramids tell us
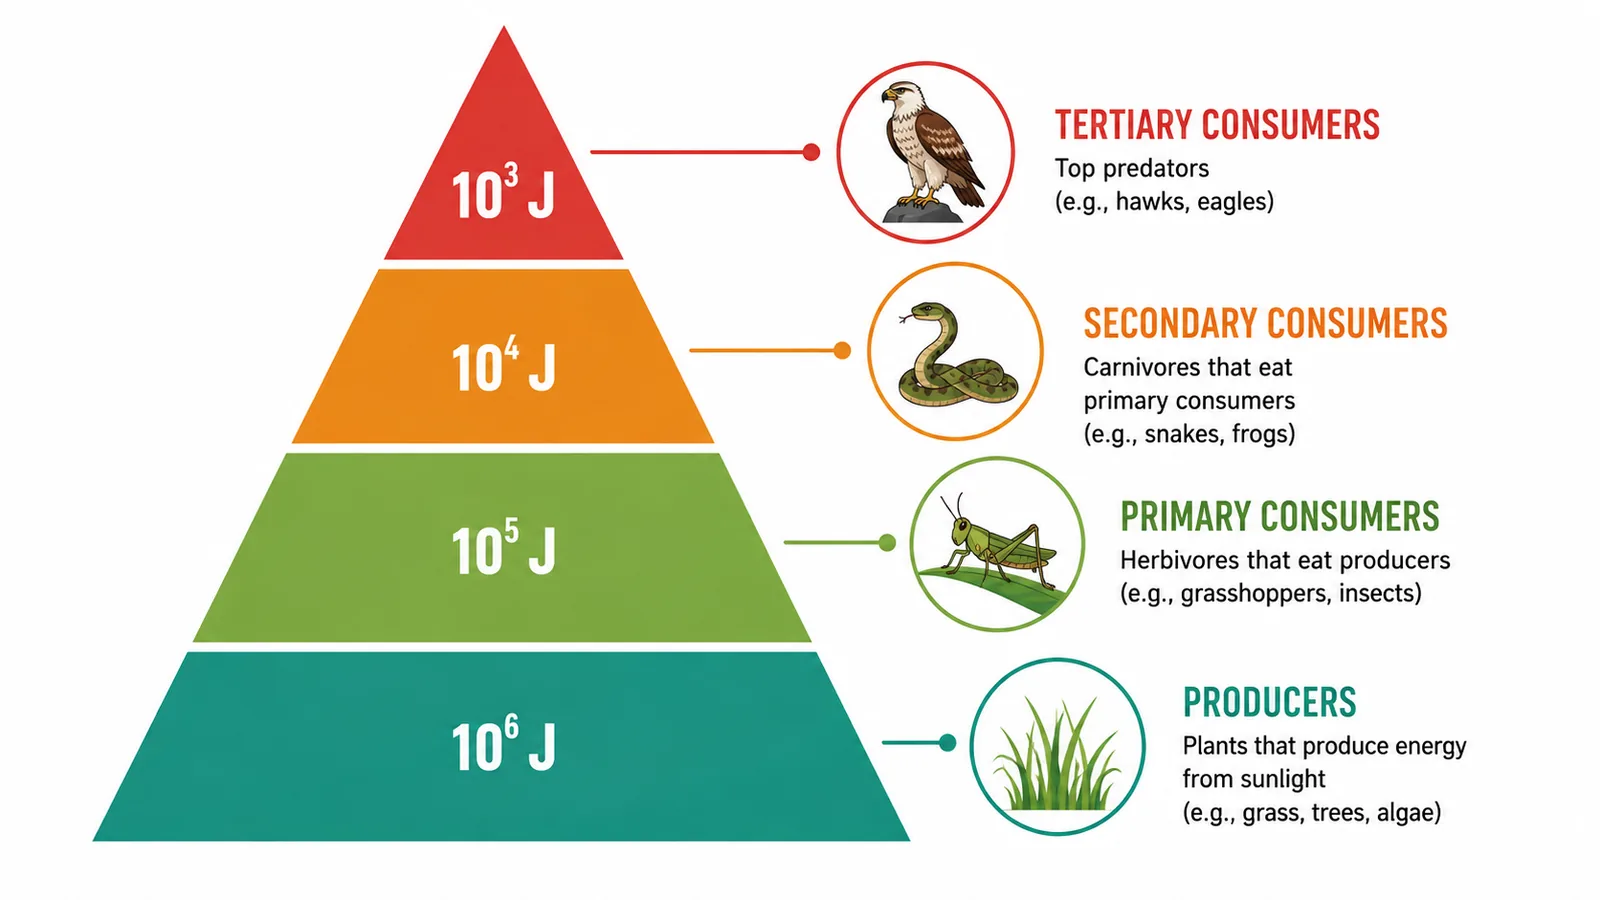

The pyramid shape shows that there is less biomass and energy at each higher level, which explains why food chains are short and why there are fewer top predators than herbivores.
- since it avoids the loss of energy at the extra trophic level.
- which show energy transferred per unit area per year, are always a true pyramid shape because energy is lost at each level,
- and are dealt with in the next lesson.
Section 6 of 9Worked example: why the biomass pyramid narrows
Take a meadow where 1000 kg of grass lives in a given area.
If you are given the numbers of organisms, you cannot use them to deduce biomass because the organisms have different masses. A data table of biomass can be converted to a percentage of the producer level so that pyramids from different ecosystems can be compared, for instance temperate grassland versus rainforest.
Section 7 of 9Exam-style questions

A pyramid of biomass has 800 kg of producers, 90 kg of primary consumers and 8 kg of secondary consumers. Calculate the percentage of biomass passed from producers to primary consumers. [2]2 marks
1. 90 / 800 × 100 [1].
2. = 11.25 per cent (about 11 per cent) [1].
Explain why a pyramid of biomass is a better way of showing the food chain oak tree → caterpillar → blue tit than a pyramid of numbers. [3]3 marks
Exam-style questions1.- One oak tree supports many caterpillars,
- so the number of producers is smaller than the number of consumers and the pyramid of numbers is not a pyramid shape [1].
2. A pyramid of biomass takes into account the mass of the organisms, and the oak tree has a huge mass compared with the caterpillars [1].3. So the biomass pyramid shows the true pyramid shape and the amount of living material at each level [1].
Section 8 of 9Key terms
| Term | Meaning |
|---|---|
| Pyramid of numbers | A diagram showing how many organisms are at each trophic level. |
| Biomass | The mass of living material, normally measured as dry mass. |
| Pyramid of biomass | A diagram showing the dry mass of organisms at each trophic level. |
| Dry mass | The mass of an organism after all water has been removed. |
| Standing crop | The biomass present at one time in a trophic level. |
| Trophic level | A feeding stage in a food chain. |