Ecology and the Environment
4. Ecology and the Environment — Edexcel Linear - OL Revision Notes & Topical Questions
10 min read 23 parts Lesson 1 of 10 1 quiz
Curriculum Equation Key قوانين الرقم الهيدروجيني والاتزان الأيوني - pH & Acid-Base Equilibrium FormulasFast Exam Solution
pH = -log[H⁺] | pOH = -log[OH⁻] | pH + pOH = 14 | [H⁺][OH⁻] = 10⁻¹⁴
Word Equation & Conditions: الرقم الهيدروجيني = -لوغاريتم تركيز أيون الهيدروجين | pH + pOH = 14
Location & Specifications: الاتزان الأيوني، كيمياء 3 ثانوي، التحصيلي، و AP Chemistry.
Lesson summary
Ecology and the Environment — notes: Use ecological terms, sample populations, explain factors affecting distribution, trace energy and nutrient cycles, and evaluate human impacts on the environment.Population — a group of organisms of the same species living in the same place a…
- Measures of abundance
- Use two tape measures, quadrats, a random number generator and a species key
- Biotic influences
- Limitations
- Valid data
- CORMS for biodiversity
Part 1 of 21Key ecological terms
Key ecological terms
Population
- Population a group of organisms of the same species living in the same place at the same time.
Community
- Community all the populations living in the same area at the same time;
- species depend on each other, so removing one affects the whole community.
Habitat
- Habitat the place where an organism lives.
- (a woodland habitat for badgers, deer, oak trees and ants)
Ecosystem
- Ecosystem all the biotic (living) and abiotic (non-living) factors interacting in an area;
- it can be as small as a garden pond or as large as Antarctica.
Ecology
- Ecology the study of species distribution, abundance, interactions between species and with their abiotic environment.
Part 2 of 21Quadrats and population size
Quadrat
- Quadrat a square wooden or wire frame (for example 0.25 m2 or 1 m2) placed on the ground to record organisms.
Measures of abundance
- Measures of abundance number of individuals of one species, species richness and percentage cover for plants such as grass or moss.
- (number of different species)
Spelling
- Spelling it is a quadrat, not a quadrant.
Part 3 of 21Practical: comparing a plant species in two areas with quadrats
- Use two tape measures, quadrats, a random number generator and a species key.
1
Lay out the first survey area with two tape measures (for example 10 m x 10 m).
2
Generate random coordinates and place the quadrat there (4,5 means 4 m along x and 5 m along y).
3
Count the individuals, record the species or estimate percentage cover.
4
Repeat for at least 10 quadrats and calculate the mean.
5
Repeat in the second area and compare the means.
Part 4 of 21Quadrat results, limitations and CORMS
Biotic influences
- Biotic influences competition, predator-prey relationships and food web interactions affect abundance.
Abiotic influences
- Abiotic influences light, mineral and water availability, pH, temperature and salinity.
Limitations
- Limitations small plants may be hidden under others and species may be hard to identify (use a species key).
- (move leaves aside with a stick)
Valid data
- Valid data random quadrat placement and at least 10 readings per area make data representative.
CORMS for biodiversity
- Change the study area;
- Organisms are the same type (plants);
- Repeat;
- Measure number of different species across all quadrats;
- Standardise quadrat size, random placement and day of data collection.
Part 5 of 21Biodiversity
Definition
- Definition the range and variety of species on Earth or within an ecosystem, including variation within species, distribution and population size.
Threats
- Threats waste production, deforestation and global warming reduce biodiversity.
Why it matters
- Why it matters species depend on each other for food, shelter and maintenance of the physical environment (tree roots stabilising soil).
- (birds nesting in trees)
Stability
- Stability high biodiversity reduces dependence of one species on another and makes populations more resilient to disease and sudden change.
Food web example
- Food web example if mice disappear, foxes can still eat rabbits and frogs and hawks can still eat frogs and sparrows, so they survive.
Measuring
- Measuring compare the number of different species in 10 random quadrats in each area;
- a higher number means higher biodiversity, though it does not show distribution or population size.
Part 6 of 21Abiotic factors
| Abiotic factor | Effect | Example |
|---|---|---|
| Light intensity | Needed for photosynthesis; low light slows plant growth and food production | Shade-tolerant plants on dark forest floors, sun-loving plants in the canopy |
| Temperature | Affects enzyme-controlled reactions, survival and reproduction | Polar bears limited to cold regions |
| Water availability | Essential for life and determines which species can live there | Cacti in deserts; amphibians need moist places |
| Soil quality (minerals and pH) | Provides water, minerals and anchorage | Heather on acidic moorland soil |
| Oxygen (aquatic) | Some aquatic animals need high oxygen levels | Fish die in warm stagnant ponds |
| Pollution | Damages habitats and kills sensitive species | Few lichens where sulfur dioxide pollution is high |
Part 7 of 21Abiotic factor investigation: wheat and carbon dioxide
Abiotic factor investigation: wheat and carbon dioxide
Method
- Method five glasshouses with 100 wheat plants at 0.03%, 0.06%, 0.10%, 0.15% and 0.20% CO2, with other factors kept constant;
- mean dry biomass measured after two months.
Supporting the conclusion
- Supporting the conclusion mean biomass rises as CO2 rises, with the greatest increase between 0.03% and 0.10%,
- because CO2 is a reactant in photosynthesis.
Why not fully conclusive
- Why not fully conclusive biomass levels off at high concentrations, only one species was tested, glasshouse conditions are not natural,
- and only five concentrations were used.
- (another factor such as light, temperature or nutrients becomes limiting)
Part 8 of 21Biotic factors
| Biotic factor | Effect on populations | Example |
|---|---|---|
| Food availability | More food allows populations to rise; scarcity favours the best-adapted | Rainforests support many species; deserts few |
| New predators | Can disrupt balance and reduce prey | Red foxes in Australia reduced small native mammals and birds |
| New pathogens | Hosts may have no resistance, so numbers fall sharply | Ash dieback fungus in European ash trees |
| Competition | The better-adapted species outcompetes the other | Grey squirrels outcompeted red squirrels for food and nest sites and carry a virus red squirrels lack immunity to |
Part 9 of 21Interpreting the squirrel data
Description
- Description red squirrels increase then fall after grey squirrels are introduced in year 6;
- grey squirrels rise;
- red squirrels become very few by year 20.
Explanation
- Explanation grey squirrels outcompete red squirrels for food and habitat, use a wider range of foods such as unripe acorns, and spread disease.
Full marks
- Full marks refer to both species, give description and explanation and quote specific figures from the graph.
Part 10 of 21Trophic levels and food chains
Trophic level
- Trophic level the position of an organism in a food chain;
- an organism in a food web can be on different levels in different chains.
First level
- First level producers convert light energy to chemical energy in glucose by photosynthesis.
- (plants and algae)
Second to fourth
- Second to fourth primary, secondary and tertiary consumers gain energy by eating the level below.
Decomposers
- Decomposers bacteria and fungi break down waste and dead matter and recycle nutrients.
Food chains
- Food chains show energy flow with arrows pointing to the consumer; all begin with a producer.
Part 11 of 21Food webs
Definition
- Definition networks of interconnected food chains showing complex feeding relationships.
Population changes
- Population changes a fall in rabbits could increase grass growth, decrease foxes, increase caterpillars and earthworms (more grass) and decrease frogs and mice as foxes switch to them.
Wording
- Wording say populations increase or decrease, not die out.
Part 12 of 21Food pyramids
Pyramid of numbers
- Pyramid of numbers the number of organisms at each level; not always pyramid-shaped.
- (oak tree to caterpillars to robin to woodpecker)
Pyramid of biomass
- Pyramid of biomass the mass of living matter at each level;
- always pyramid-shaped because biomass decreases up the chain.
Pyramid of energy
- Pyramid of energy stored energy at each level; always pyramid-shaped because energy is lost at every level.
Drawing
- Drawing keep trophic order with producers at the bottom, label every bar, make bars the same height with the width showing numbers, biomass or energy,
- and draw to scale on graph paper.
Part 13 of 21Energy transfer and loss
Transfer
- Transfer light energy becomes chemical energy in producers;
- consumers break down biomass and use the energy and substances to build their own tissues.
10% rule
- 10% rule only about 10% of the energy at one trophic level passes to the next, so food chains are short.
Reasons for loss
- Reasons for loss parts such as bones, fur and teeth are not eaten;
- some food is egested as faeces;
- energy is lost as heat in respiration and movement;
- energy is lost in excretion (urea) and death and decomposition.
Part 14 of 21Efficiency of biomass transfer
Equation
- Equation percentage efficiency = x 100.
- (biomass in higher trophic level / biomass in lower trophic level)
Example
- Example clover 1450 kg and snails 138 kg gives 138 / 1450 x 100 = 9.52% (3 s.f.).
Energy
- Energy the same calculation applies to energy because energy is stored in biomass.
Part 15 of 21The carbon cycle

1Uptake
- Uptake plants remove CO2 from the atmosphere by photosynthesis and make glucose, carbohydrates, fats and proteins.
2Transfer
- Transfer carbon passes to herbivores when they feed and to carnivores when they feed.
3Release
- Release respiration by plants and animals releases CO2; decomposers release CO2 from dead and waste material.
4Fossil fuels
- Fossil fuels if dead organisms are not decomposed, carbon becomes fossil fuel; combustion releases CO2.
Part 16 of 21The nitrogen cycle
1Nitrogen fixation
- Nitrogen fixation nitrogen-fixing bacteria convert N2 to ammonium compounds and then nitrates; lightning and fertiliser production also fix nitrogen.
- (free-living in soil or in root nodules of legumes such as peas, beans and clover)
2Uptake and transfer
- Uptake and transfer plants absorb nitrates to build proteins, and animals obtain nitrogen by eating plants and other animals.
3Decomposition
- Decomposition decomposers return nitrogen from dead organisms and waste to the soil as ammonia, forming ammonium ions.
4Nitrification
- Nitrification nitrifying bacteria convert ammonia to nitrites and then nitrates.
5Denitrification
- Denitrification denitrifying bacteria in waterlogged or compacted anaerobic soil convert nitrates back to N2;
- ploughing increases aeration to reduce it.
Part 17 of 21Air pollution
Carbon monoxide
- Carbon monoxide binds to haemoglobin, reducing oxygen transport and causing suffocation at high concentrations.
Sulfur dioxide
- Sulfur dioxide forms acid rain with water vapour, damaging plants, aquatic life and soil, and causes respiratory problems.
Part 18 of 21Greenhouse effect and global warming
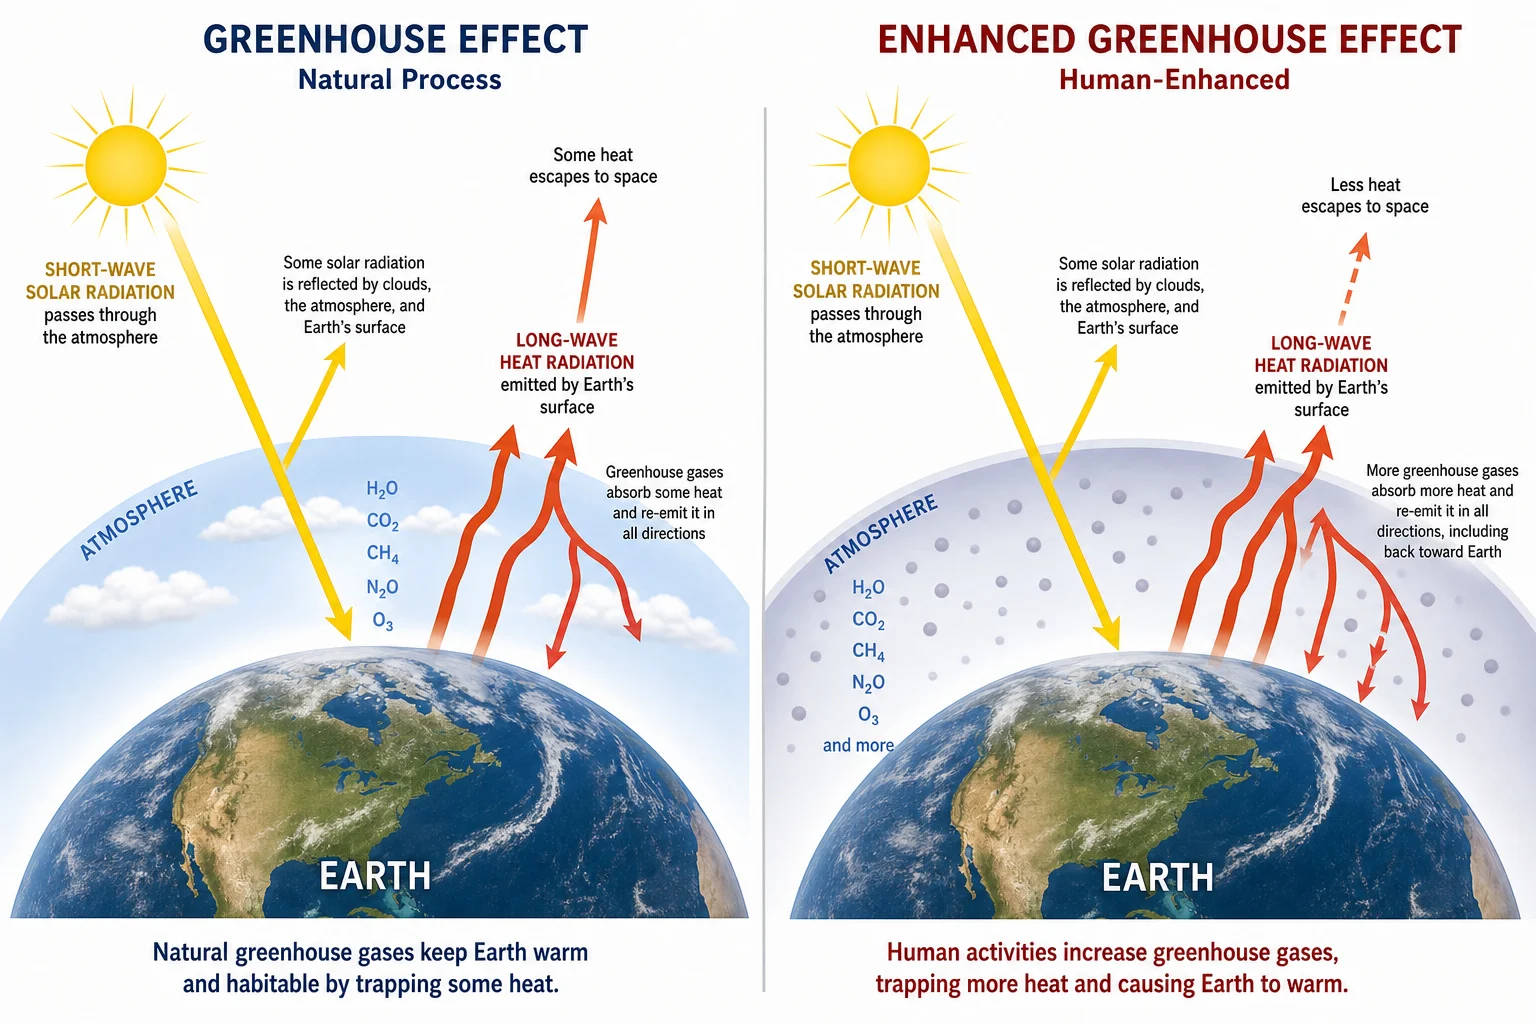
1Greenhouse gases
- Greenhouse gases absorb infrared radiation and keep Earth warm enough for life: water vapour, carbon dioxide, methane, nitrous oxides and CFCs.
2Process
- Process the Sun's radiation heats the surface, which re-emits infrared;
- some escapes to space and some is absorbed by greenhouse gases and trapped.
3Human activity
- Human activity burning fossil fuels raises carbon dioxide; cattle and rice paddies release methane.
4Enhanced greenhouse effect
- Enhanced greenhouse effect increasing greenhouse gases trap more heat, causing global warming and climate change.
5Consequences
- Consequences melting ice caps, rising sea levels and coral bleaching; extreme weather; loss of habitats; reduced biodiversity;
- and species migration spreading pests and disease.
Part 19 of 21Water pollution: eutrophication and sewage
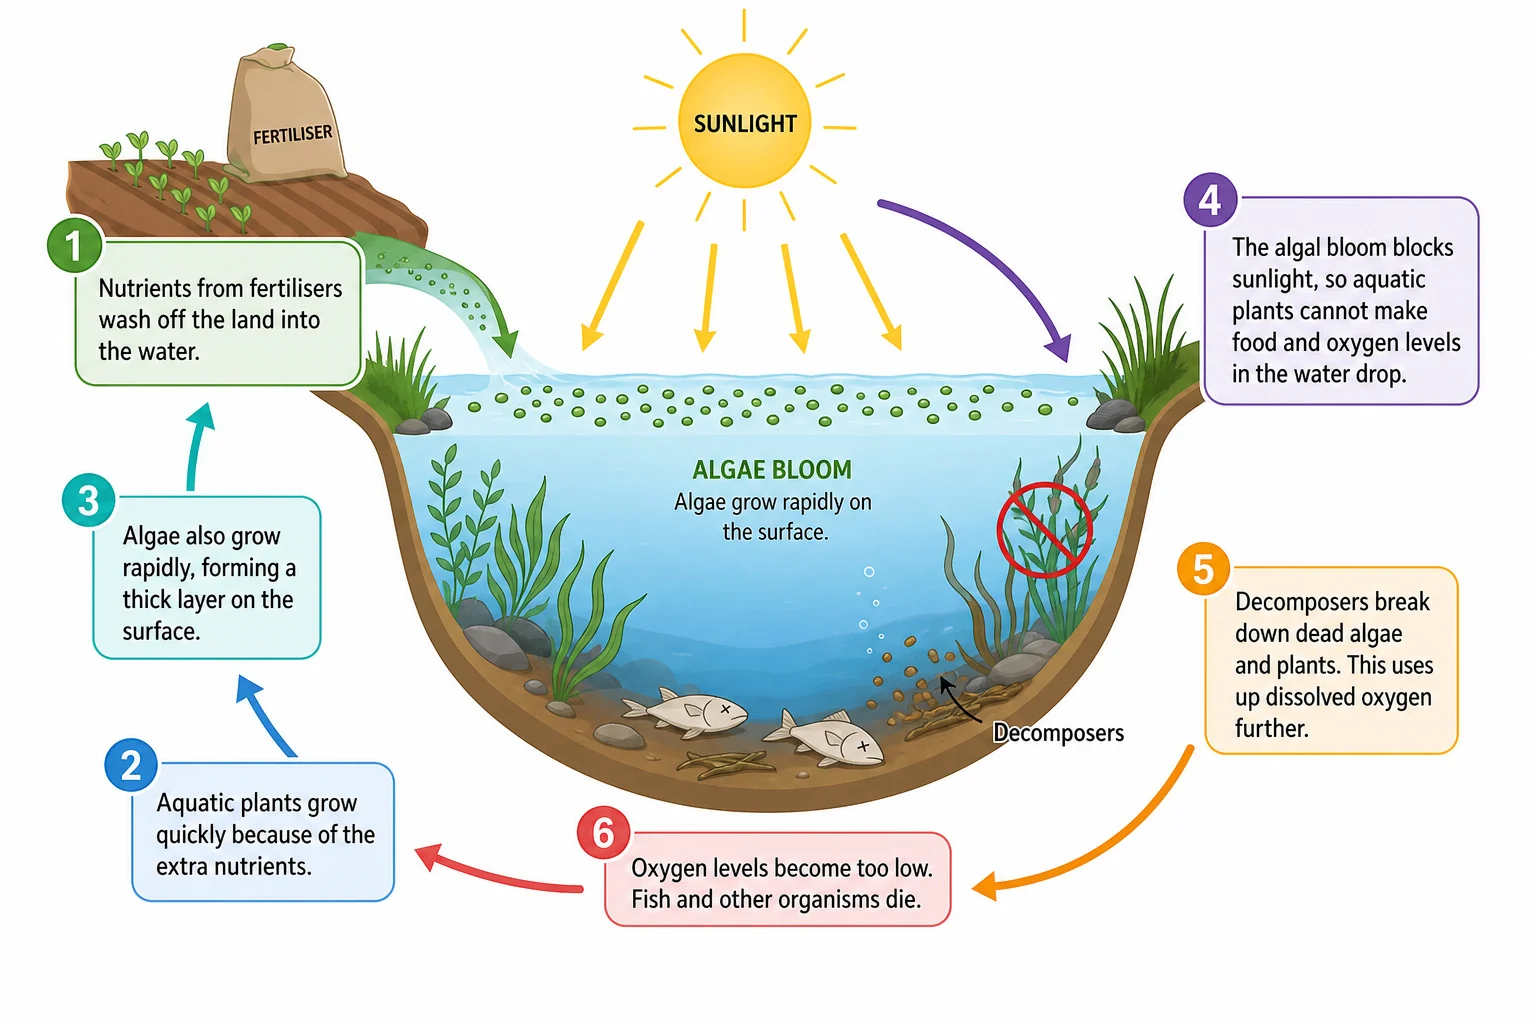
Eutrophication
- Eutrophication fertiliser nitrates leach into water, algae and plants overgrow at the surface, plants below die from lack of light, decomposers multiply and use up oxygen,
- so aquatic organisms die.
Sewage
- Sewage aerobic bacteria feeding on waste use up dissolved oxygen, oxygen-sensitive species die, biodiversity falls and pathogenic bacteria can increase.
Part 20 of 21Effects of deforestation
| Effect | Explanation |
|---|---|
| Leaching | Soil minerals are not taken up by trees and are washed into water |
| Soil erosion | Without roots and organic matter, soil is washed or blown away |
| Water cycle disturbance | Less transpiration, so less cloud formation and rainfall |
| Carbon cycle disturbance | Less photosynthesis removes less CO2, and burning felled trees releases carbon, adding to global warming |
Reasons
- Reasons trees are cleared for agriculture or development.
Loss of habitat
- Loss of habitat also reduces biodiversity and can cause extinctions.
Part 21 of 21Worked examples
Describe how to estimate the population size of a plant species in a field using quadrats. [4]4 marks
1Use a random number generator for coordinates and place quadrats at those points.2Count the individuals (or percentage cover) in each quadrat, using at least 10 quadrats.3Calculate the mean per quadrat.4Multiply by the area of the field divided by the quadrat area.Calculate the percentage efficiency of biomass transfer from 1450 kg of clover to 138 kg of snails. [2]2 marks
- (138 / 1450) x 100.
- = 9.52%.
Explain how fertiliser run-off can kill fish in a lake. [4]4 marks
1Nitrates cause algae to grow rapidly on the surface.2Plants below die from lack of light and decomposers multiply.3Decomposer respiration uses up the dissolved oxygen.4Fish die from lack of oxygen.Explain why food chains rarely have more than five trophic levels. [3]3 marks
Worked examplesOnly about 10% of energy passes to each next level.Energy is lost as heat, in waste and uneaten parts.Too little energy remains to support more levels.Describe the role of bacteria in the nitrogen cycle. [4]4 marks
1Nitrogen-fixing bacteria convert N2 to ammonium compounds and nitrates.2Decomposers convert dead matter into ammonia.3Nitrifying bacteria turn ammonia into nitrites then nitrates.4Denitrifying bacteria return N2 to the air.
Key terms
| Term | Meaning |
|---|---|
| Ecosystem | All the biotic and abiotic factors interacting in an area. |
| Biodiversity | The range and variety of species in an ecosystem. |
| Trophic level | The position of an organism in a food chain. |
| Eutrophication | Nutrient enrichment of water leading to oxygen depletion. |
| Nitrification | Conversion of ammonia to nitrites and then nitrates. |
| Greenhouse gas | A gas that absorbs infrared radiation and traps heat in the atmosphere. |
| Biomass | The mass of living matter. |
| Deforestation | Clearing of trees on a large scale. |
Avoid these mistakes
1
Writing quadrant instead of quadrat.
2
Saying an animal population dies out — say that it decreases.
3
Thinking energy is destroyed in a food chain — it is transferred to the surroundings as heat and waste.
4
Mixing up the greenhouse effect (carbon dioxide and methane) with acid rain (sulfur dioxide).
5
Forgetting that denitrification is carried out by bacteria in anaerobic soil.
Topic quiz · 40 questionsQuiz for this lesson
Last updated:
\n