1.4.2Cell Level Systems
The Effect of 3 Factors on Photosynthesis
5 min read 9 parts Lesson 12 of 13 1 quiz
Section 1 of 9Three factors

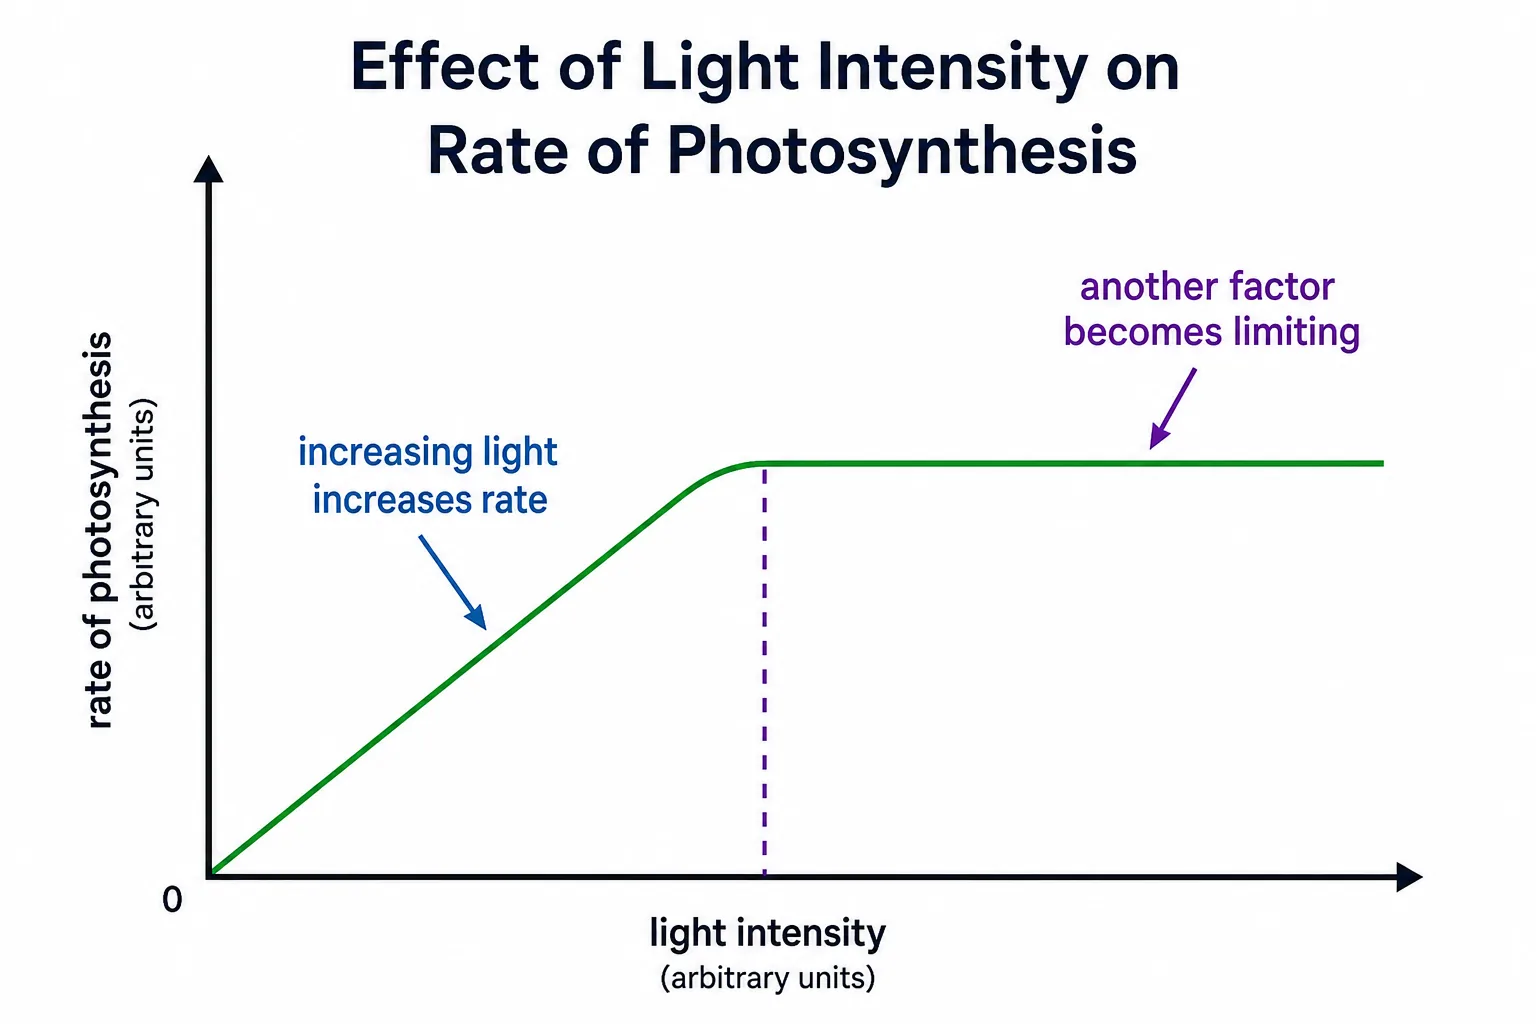

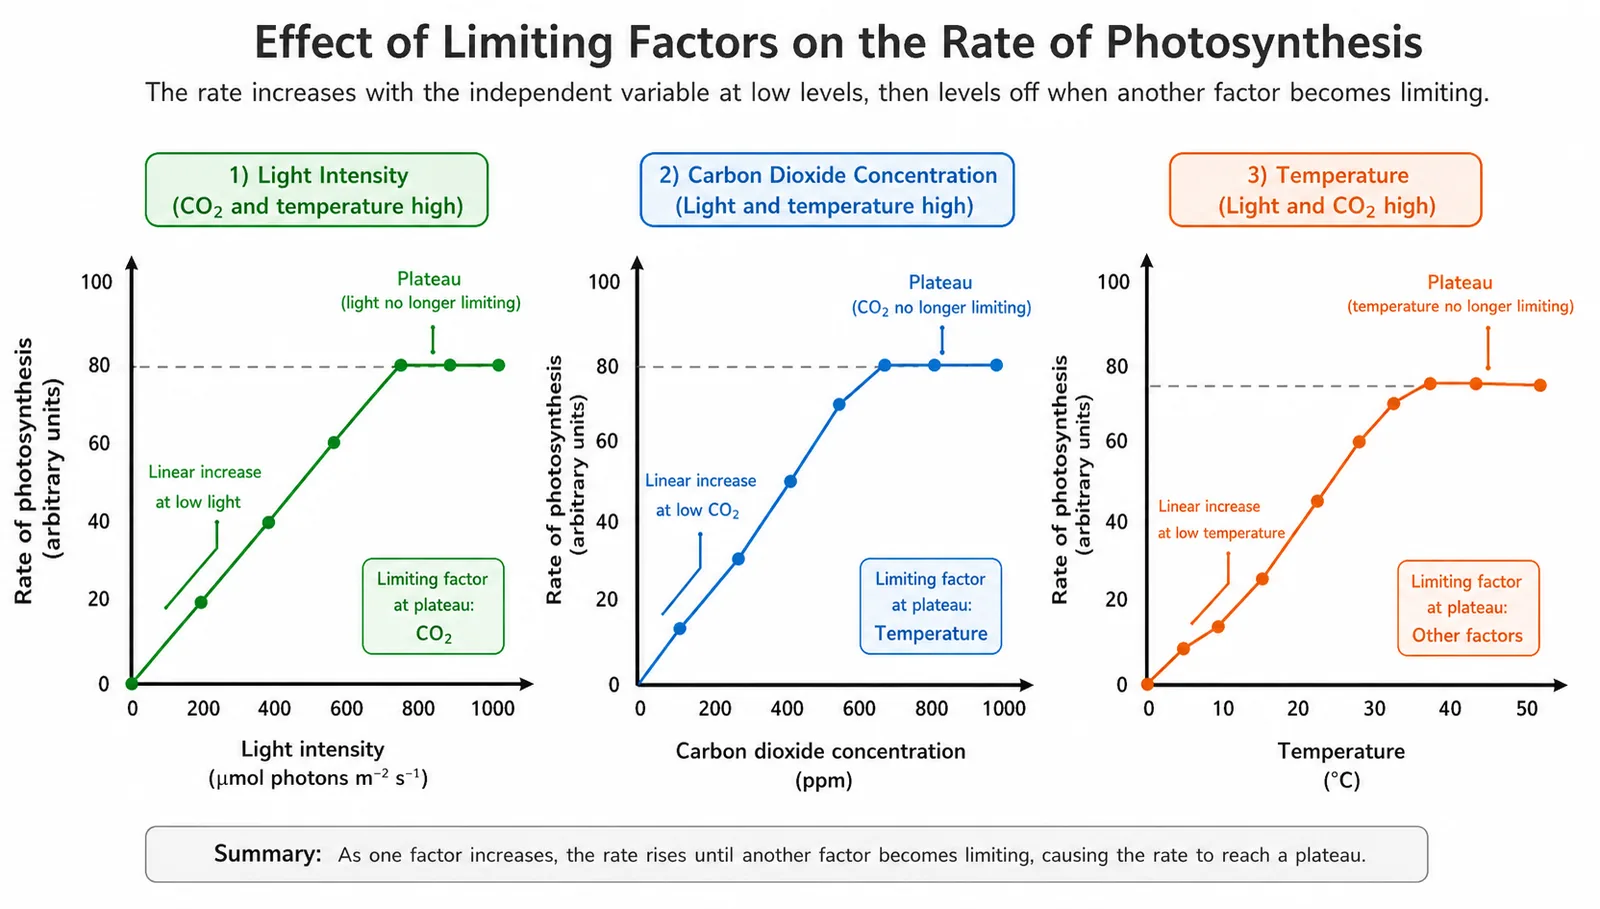
The rate of photosynthesis depends on the environment.
- then levels off or falls.
Section 2 of 9Light intensity


Light supplies the energy for the process.
- so if the distance is doubled the intensity falls to a quarter.
Section 3 of 9Carbon dioxide concentration and temperature


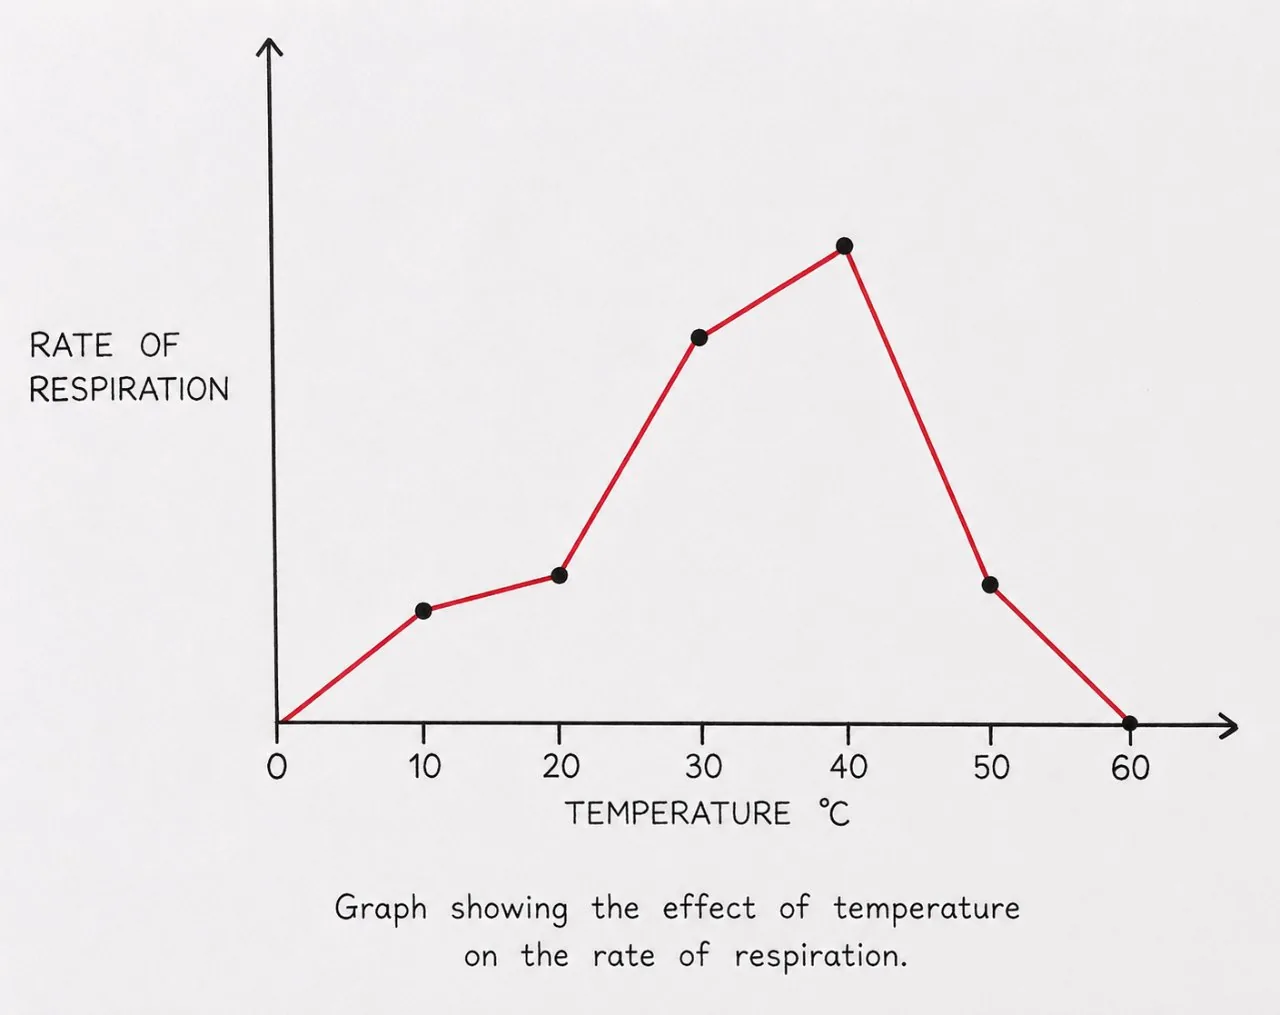

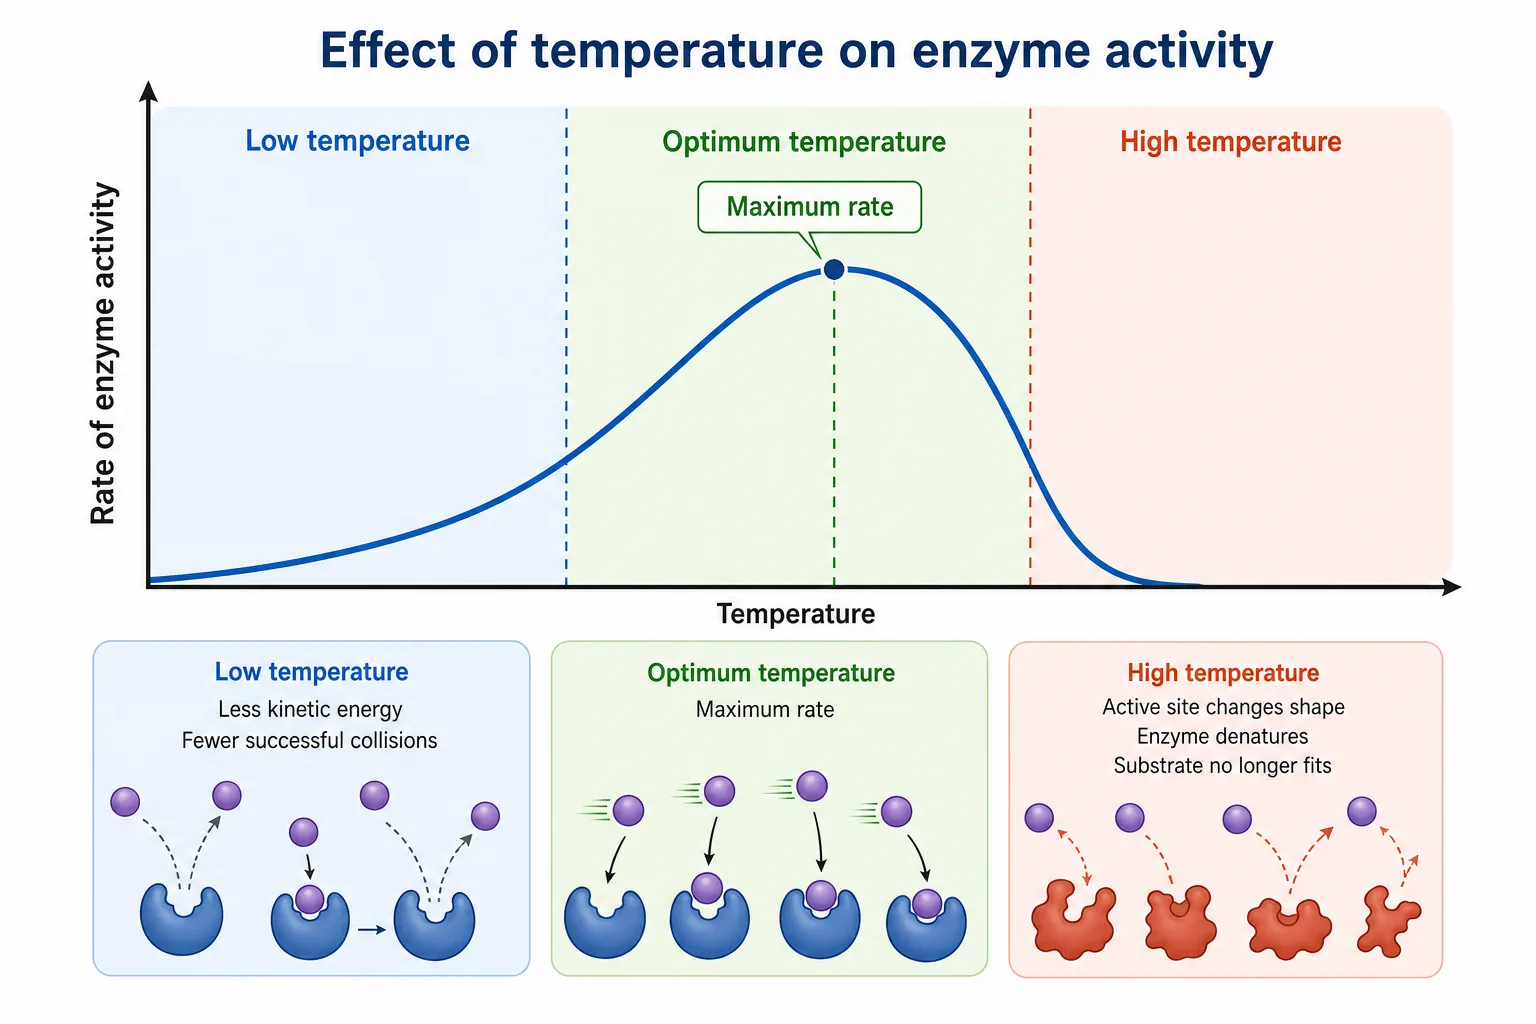

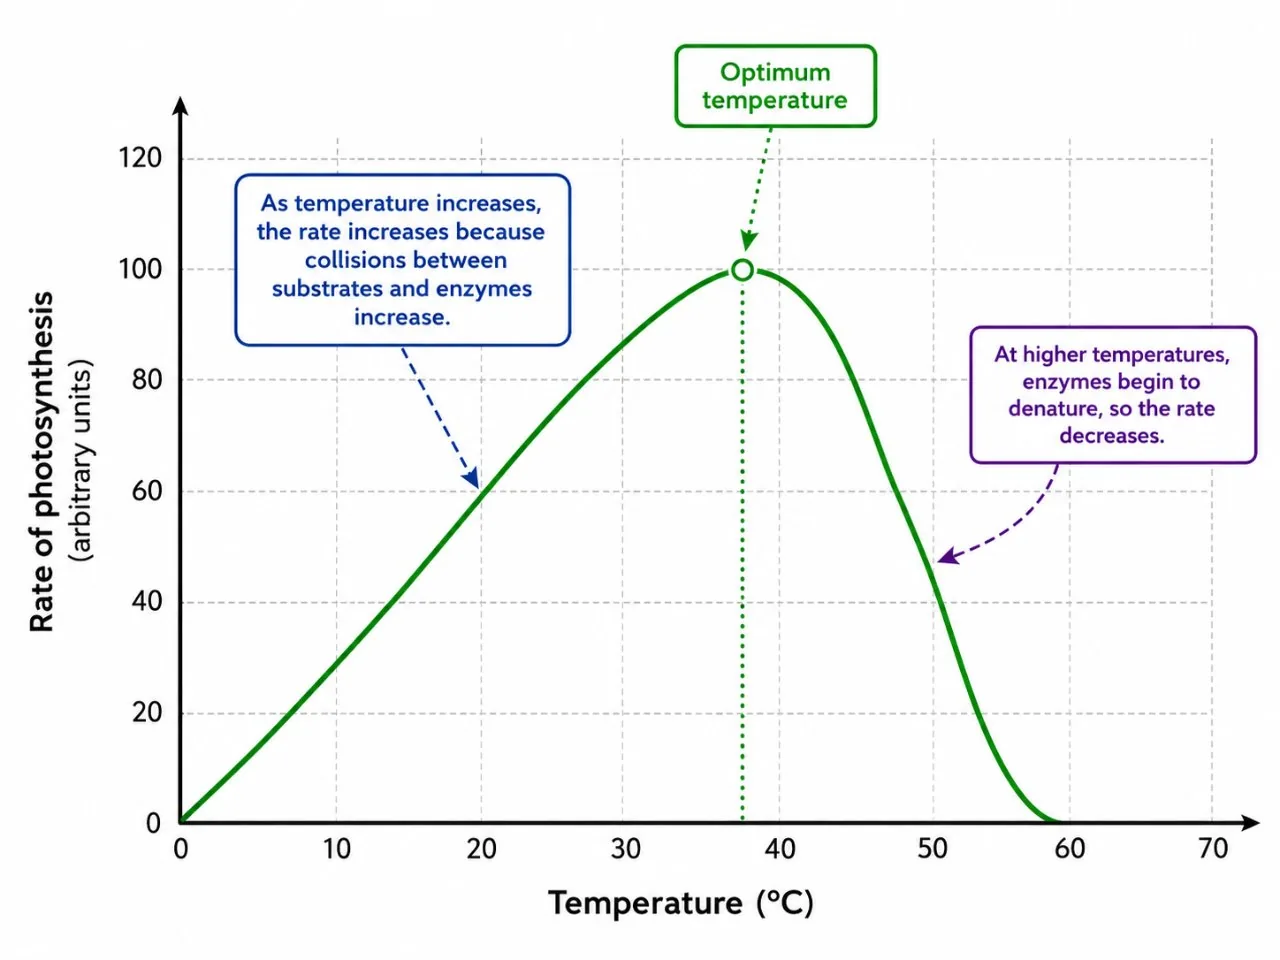
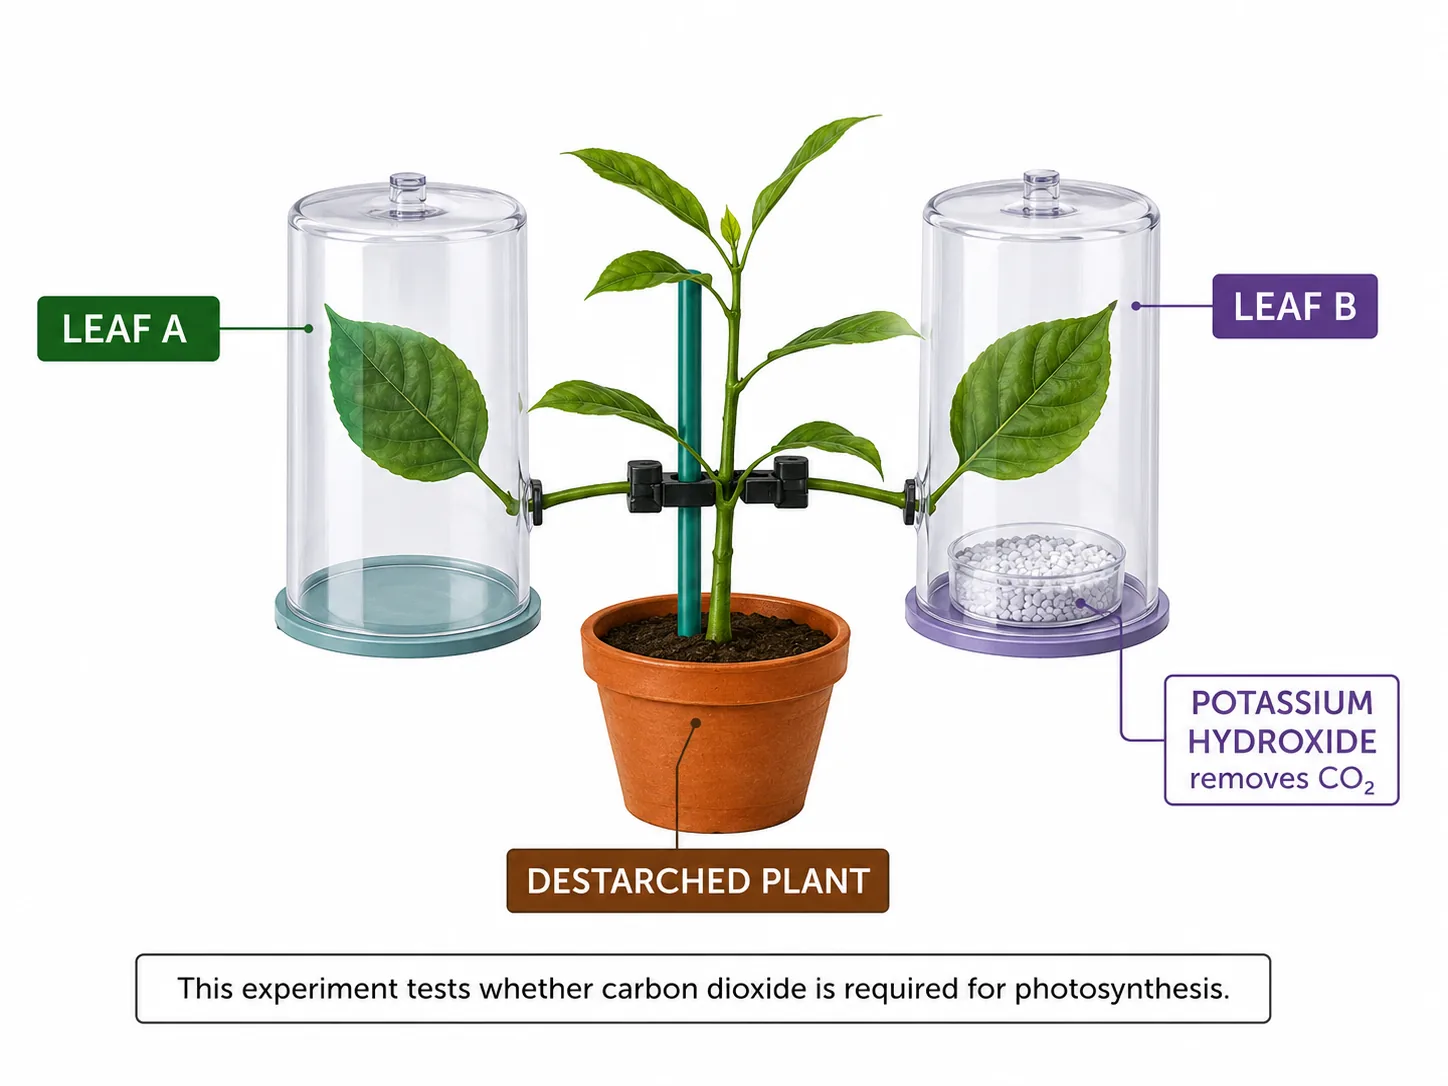



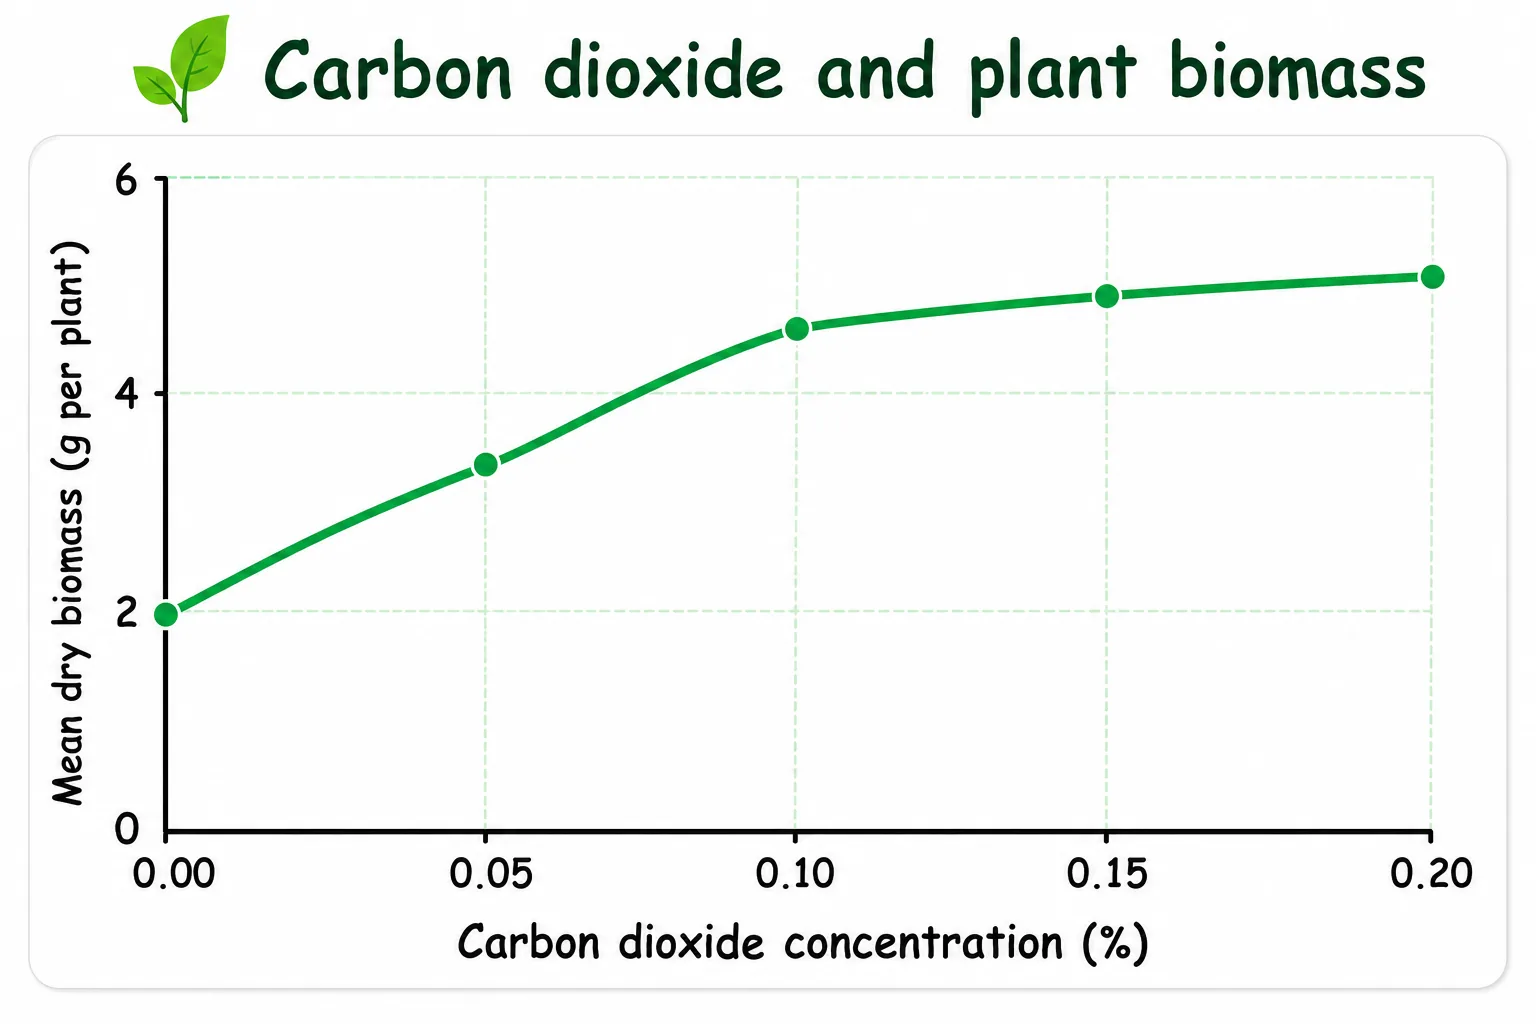

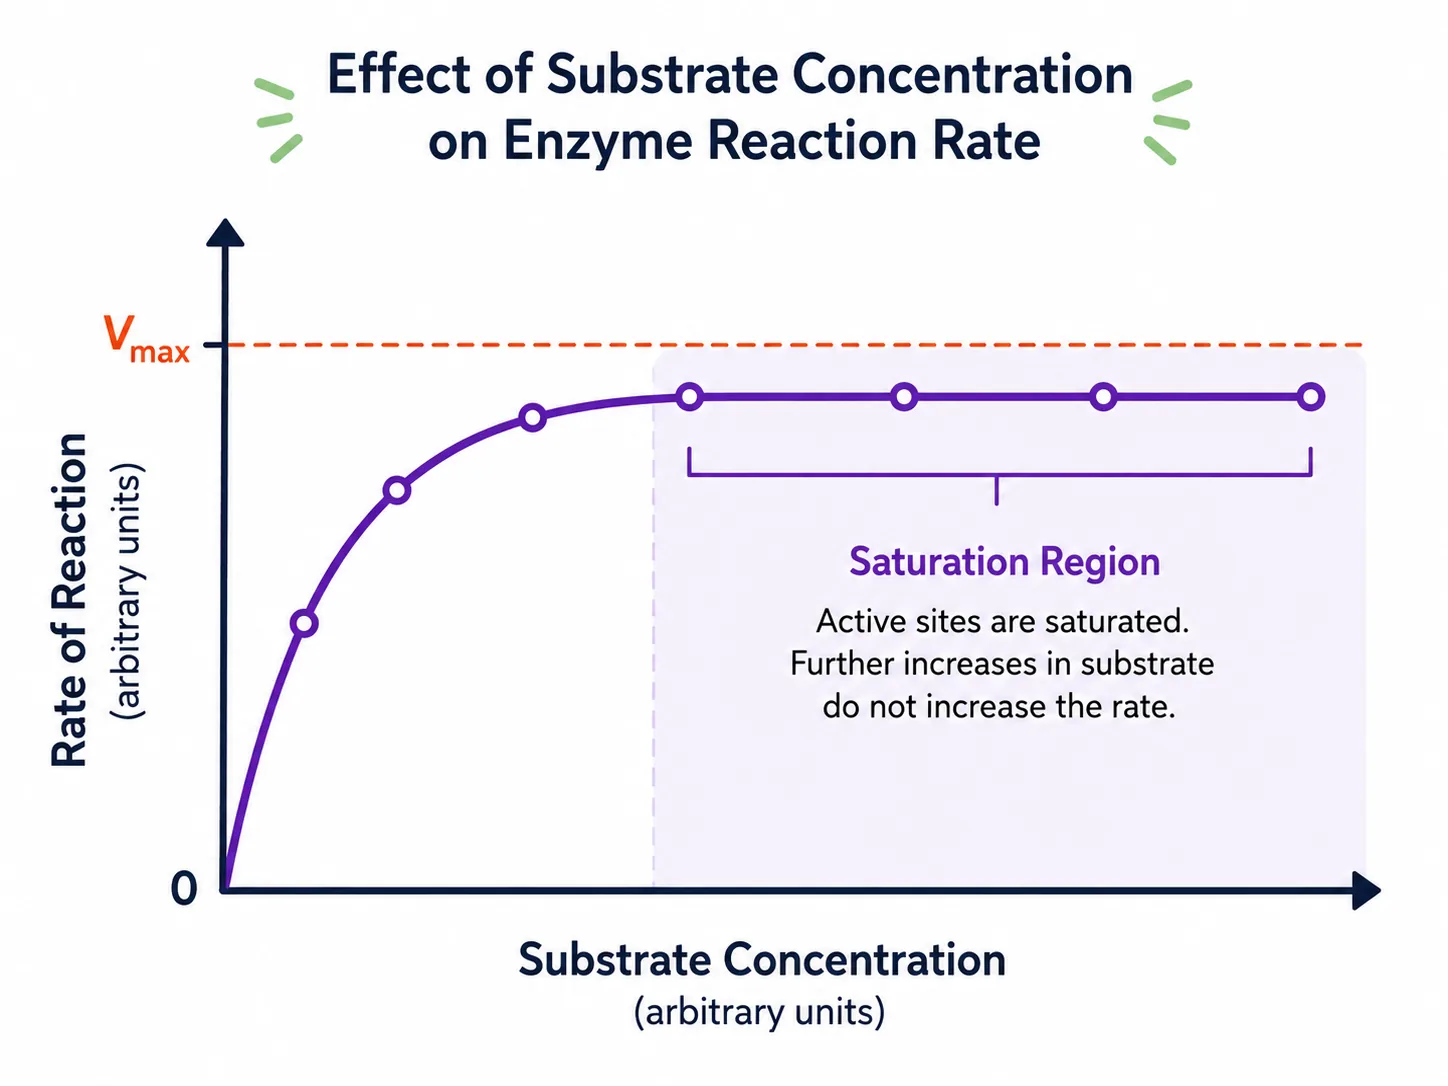
Carbon dioxide is a raw material. As its concentration goes up, the rate increases until all the chloroplast enzymes are working at the maximum, and then levels off. The air contains only about 0.04 per cent carbon dioxide, so it is often limiting. Greenhouse growers sometimes burn paraffin or use gas burners, which raises both carbon dioxide and temperature.
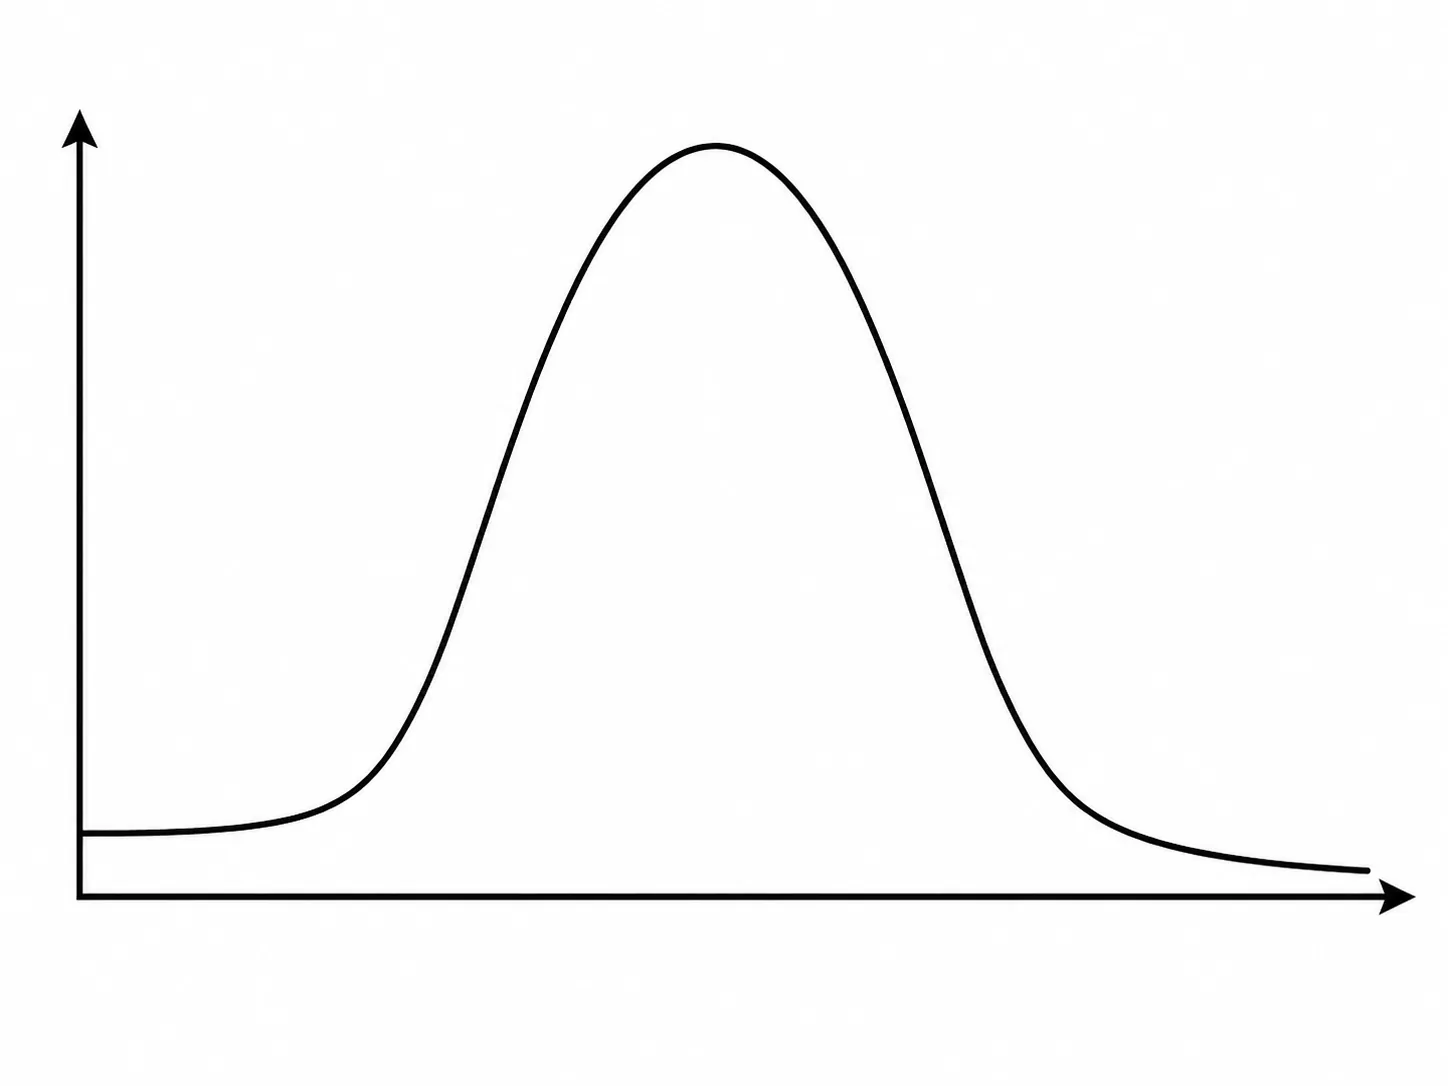
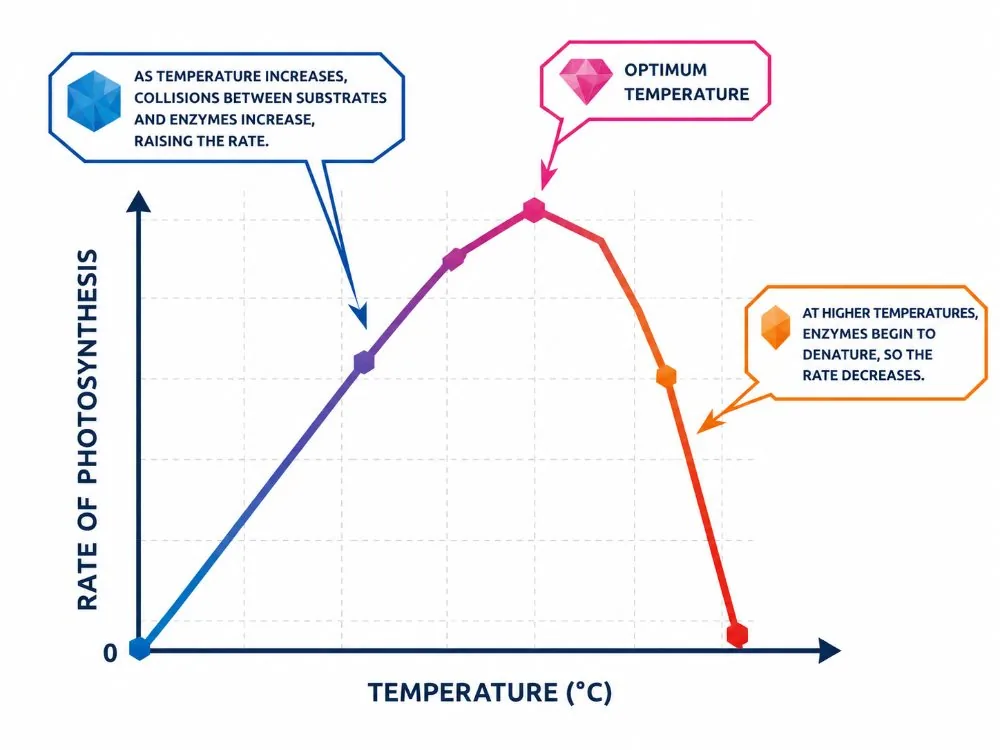
Temperature affects the enzymes that control photosynthesis. As temperature rises, enzyme activity rises and the rate of photosynthesis increases. Above about 40 degrees Celsius, the enzymes begin to denature, so the rate drops steeply. The curve is a bell shape, with an optimum at about 25 to 35 degrees for many temperate plants.
Section 4 of 9Required practical: pondweed and light
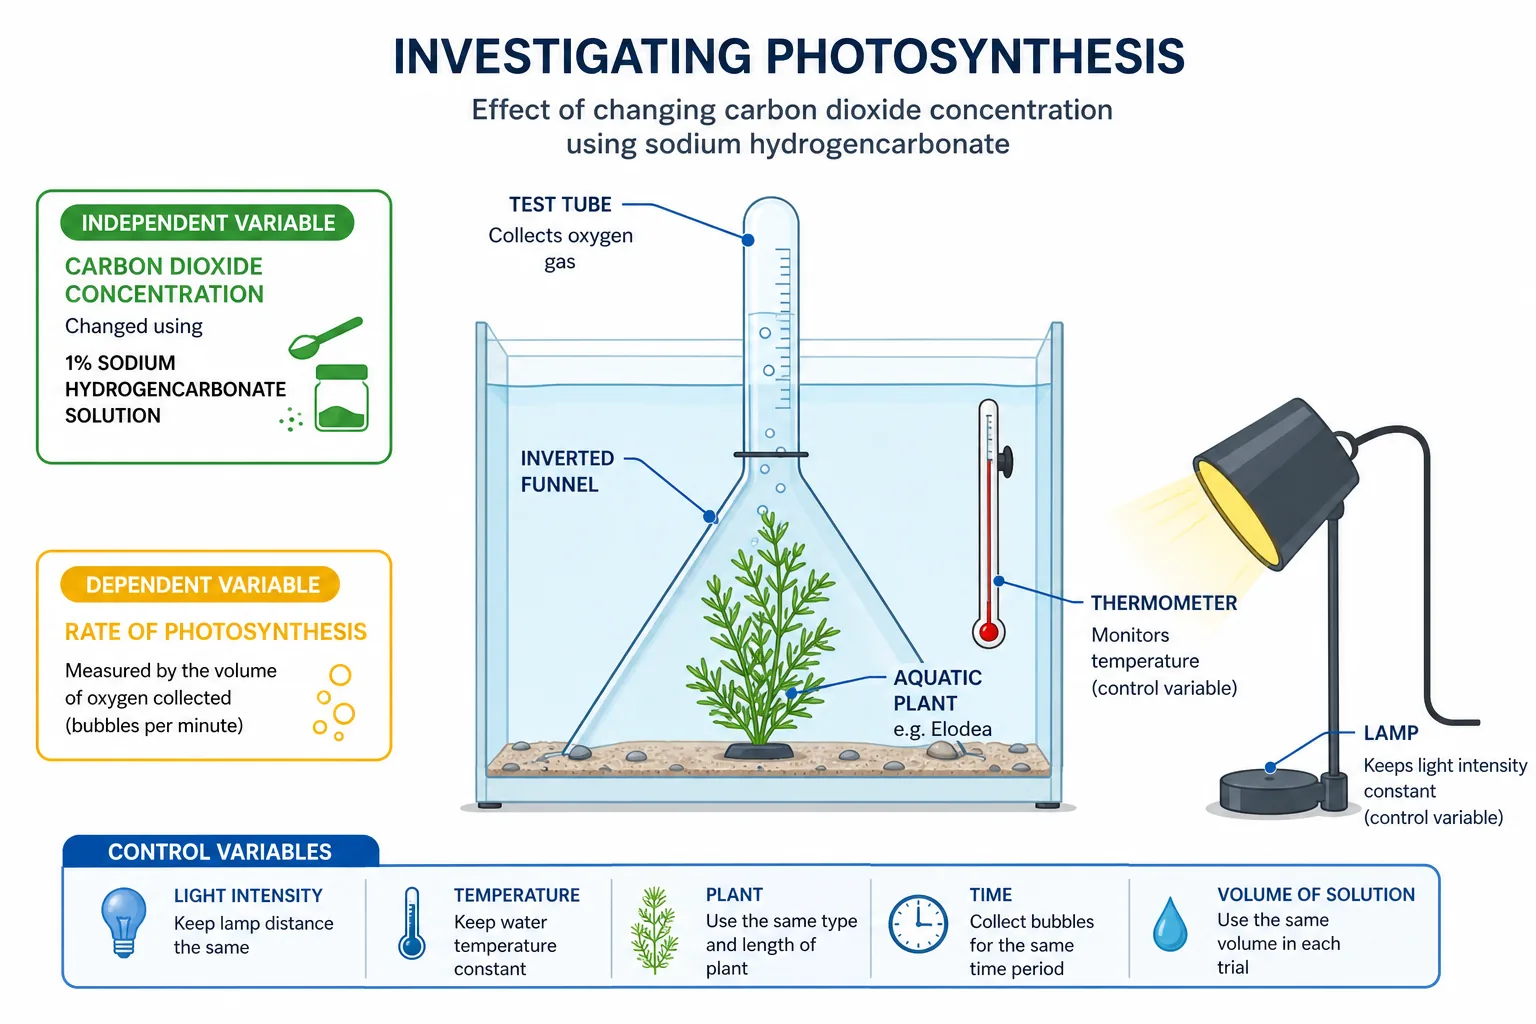
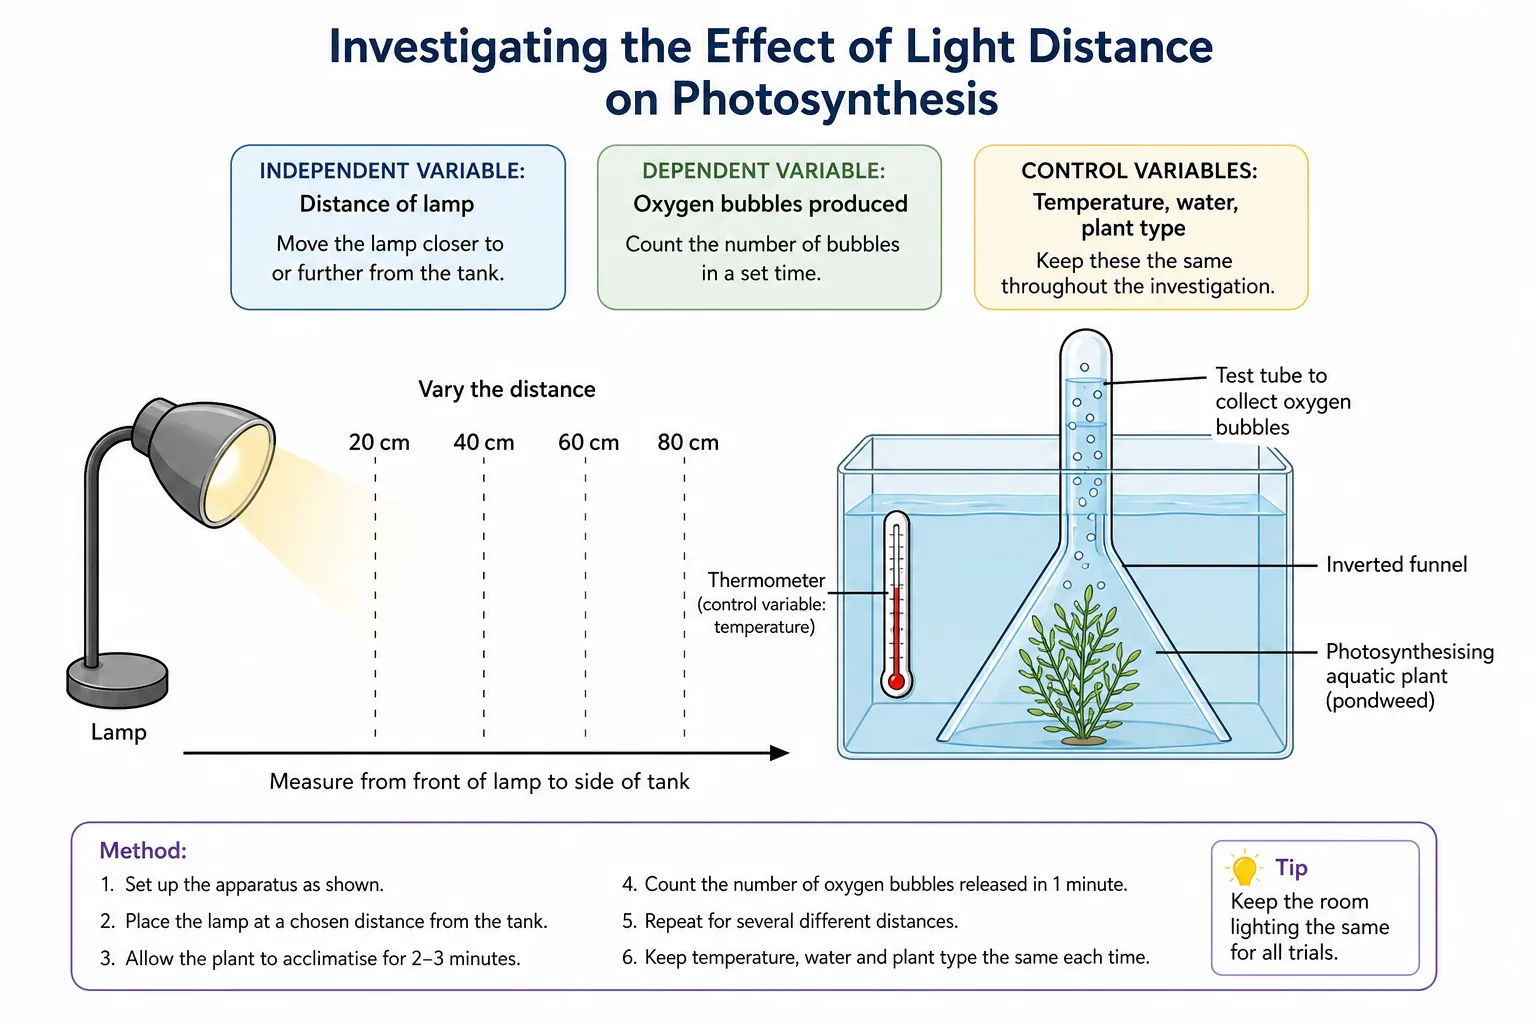
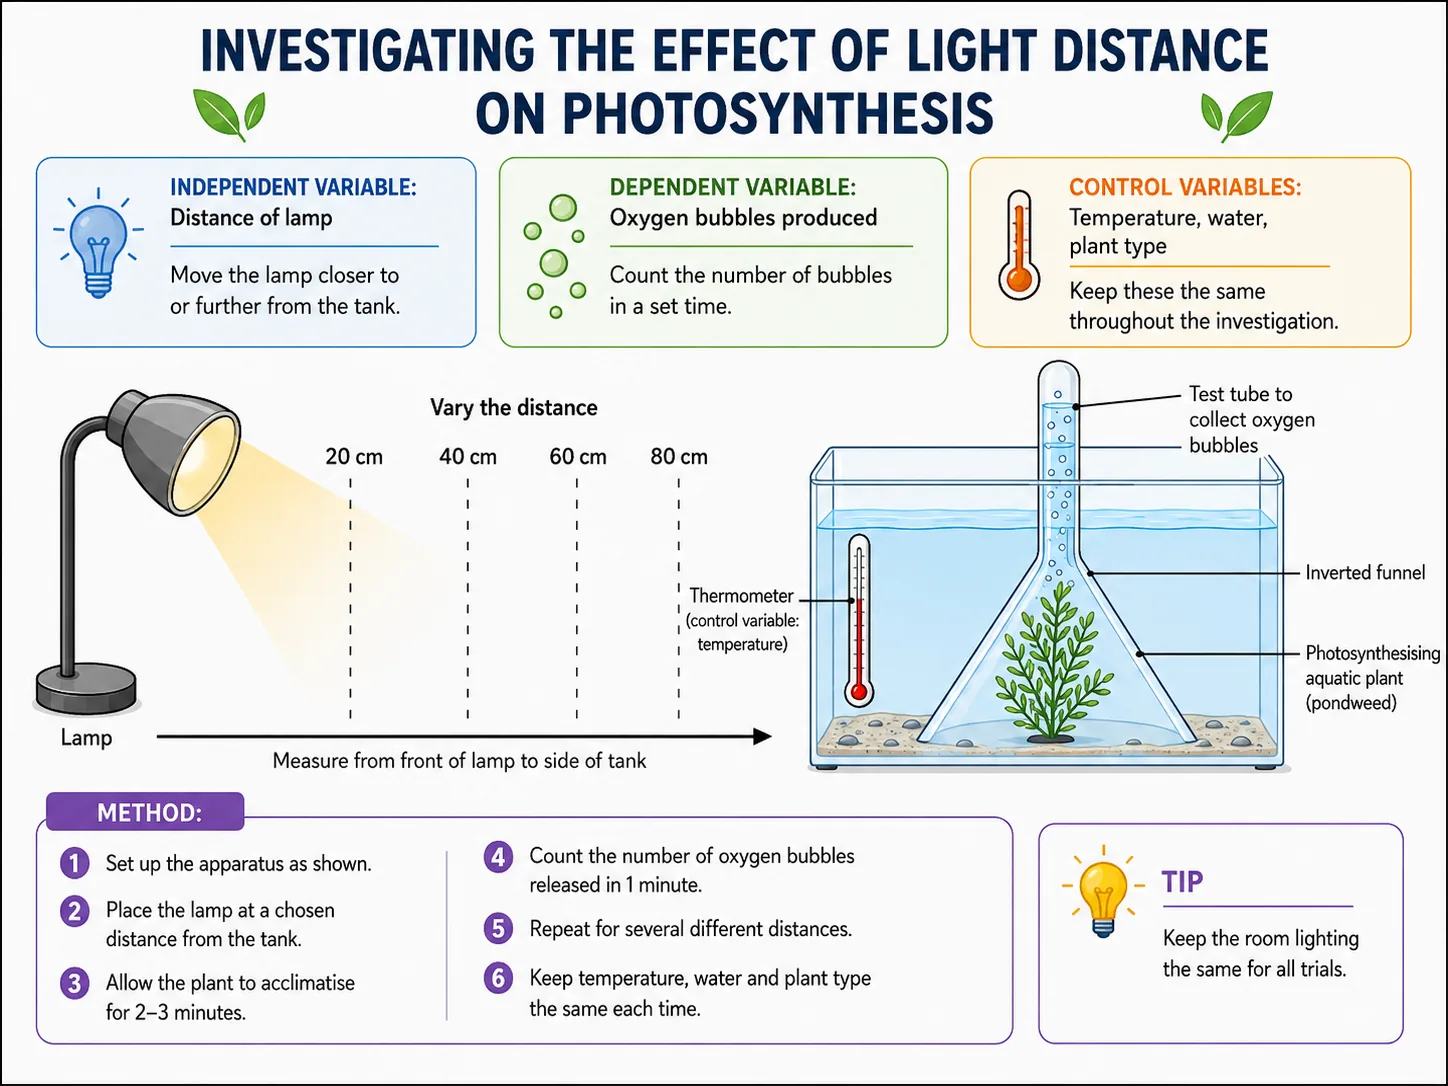

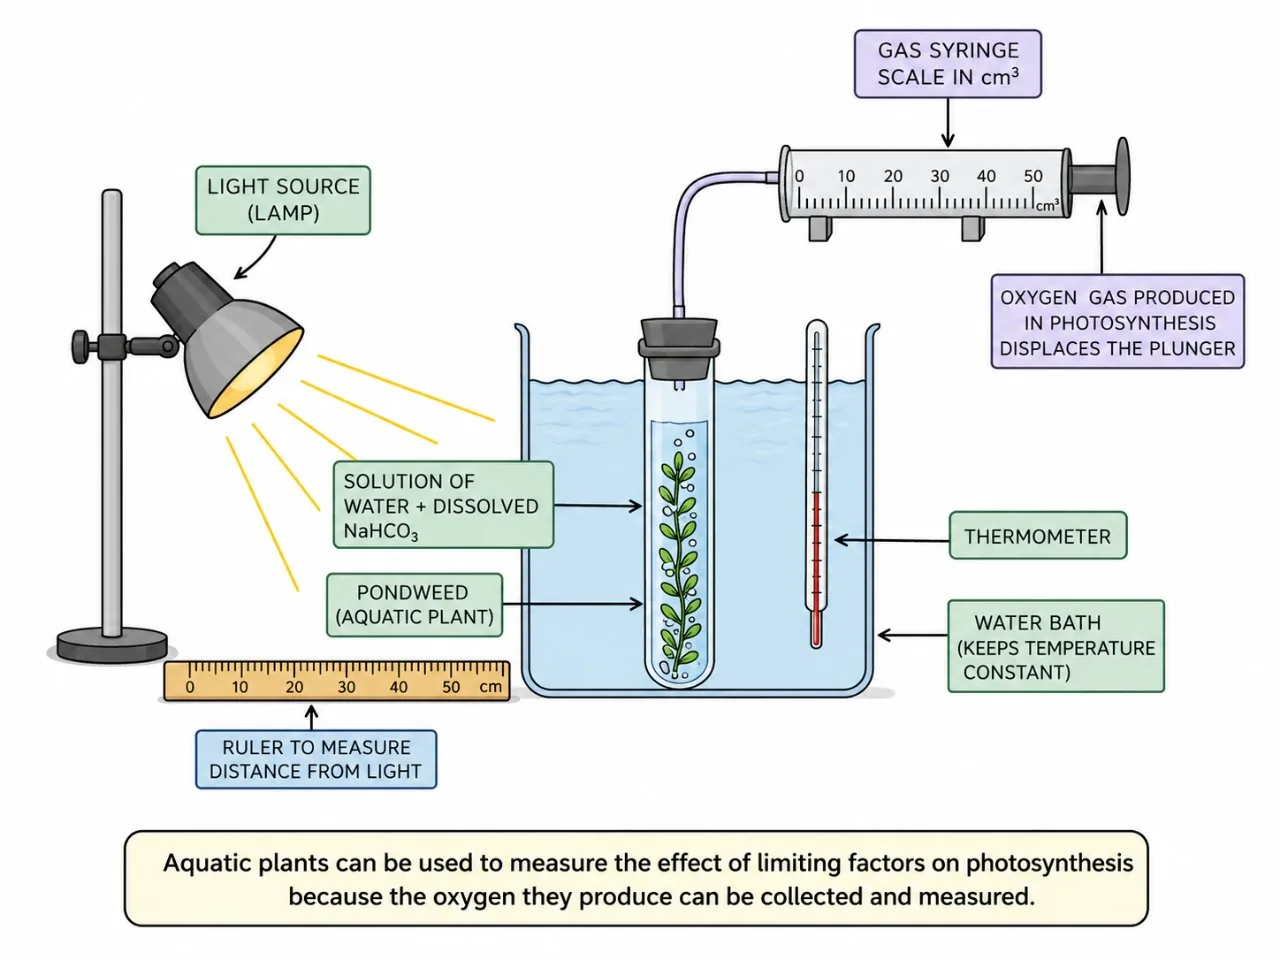
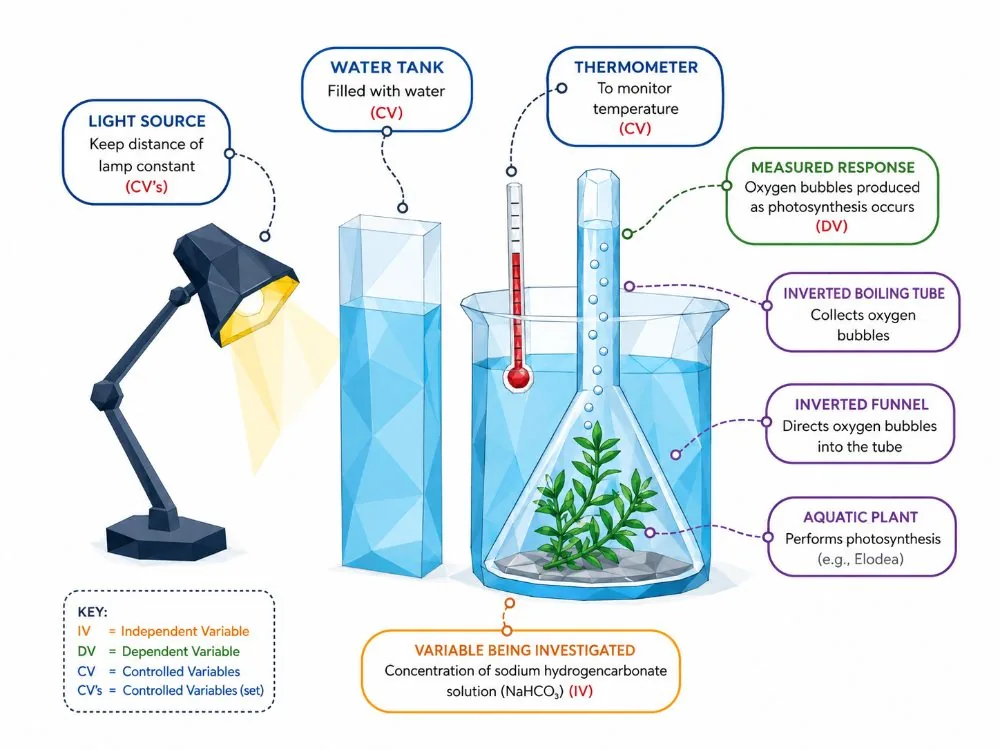
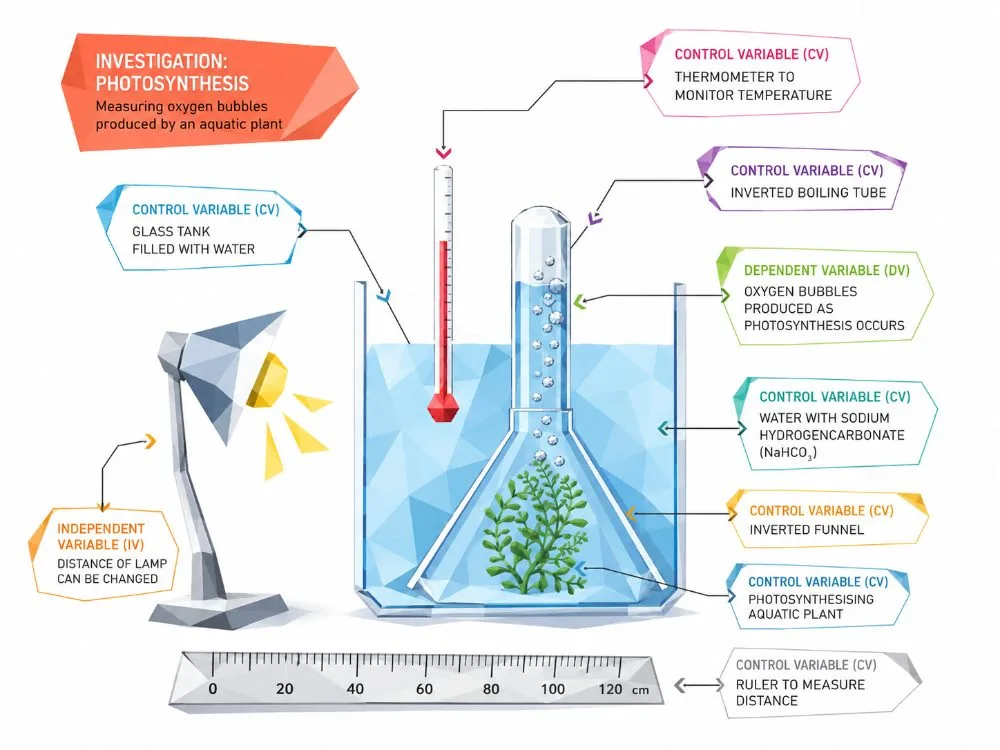
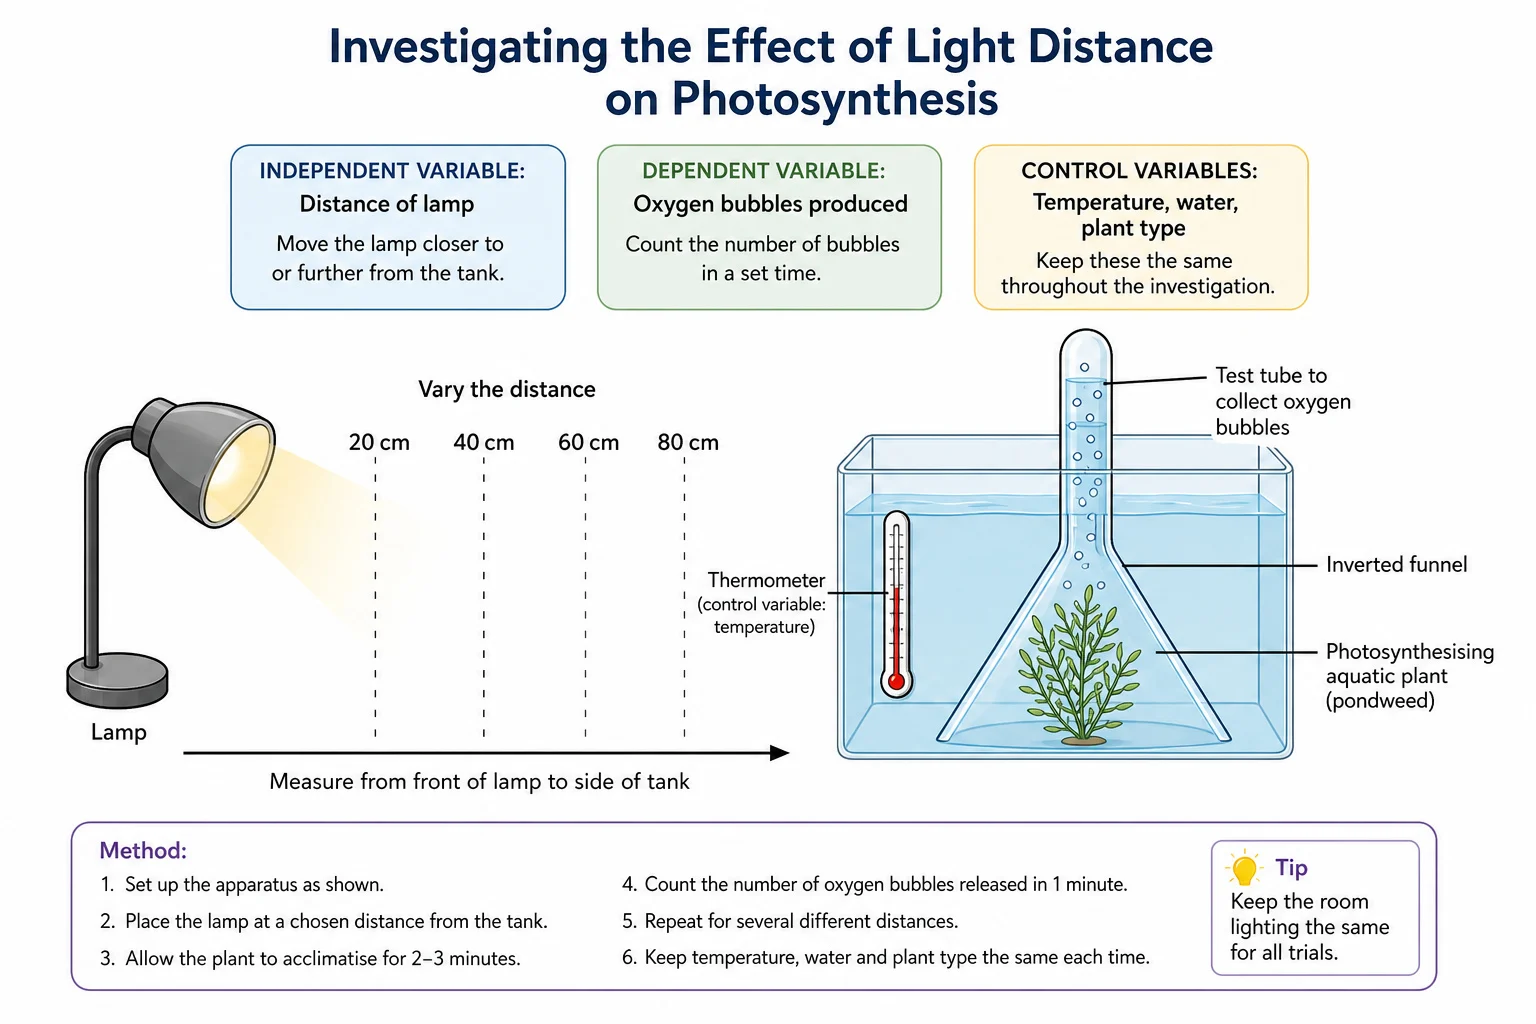
The effect of light intensity is investigated using a water plant such as Canadian pondweed (Elodea).
- and a lamp is placed at a measured distance.
- or the volume of gas collected in a capillary tube or syringe is measured.
Calculations
- the light intensity is proportional to 1 / d2, so plotting rate against 1 / d2 gives a straight line.
- The mean of repeated counts improves reliability.
- A limitation is that counting bubbles is subjective, since bubbles vary in size;
- collecting the gas in a syringe gives a better measure.
Section 5 of 9Applying the ideas: the greenhouse
| Factor | How a grower controls it | Result |
|---|---|---|
| Light | Artificial lighting, extra hours of light, and glass to let light in | Faster photosynthesis |
| Carbon dioxide | Burners or added gas | Faster growth, up to a limit |
| Temperature | Heaters, vents, shading | Kept near the optimum without denaturing enzymes |
The cost of the extras must be weighed against the extra income from the increased yield. There is no point providing more of a factor if another one is limiting.
Section 6 of 9Worked example: a rate calculation


A student collects oxygen in a syringe from pondweed at four distances from a lamp: at 10 cm it makes 6.0 cm3 in 5 minutes, at 20 cm 1.5 cm3, at 30 cm 0.67 cm3 and at 40 cm 0.38 cm3.
- which supports the conclusion that light intensity is the limiting factor over this range.
- which should give a straight line through the origin.
Section 7 of 9Exam-style questions



Pondweed is placed 20 cm from a lamp and produces 24 bubbles per minute. The lamp is moved to 40 cm. Predict the number of bubbles per minute, assuming light is limiting, and explain your answer. [3]3 marks
Exam-style questions1. At double the distance the light intensity is one quarter (inverse square law) [1].2. If the rate is proportional to light intensity, the rate is 24 / 4 = 6 bubbles per minute [1].3. Less light energy is absorbed by chlorophyll, so photosynthesis, and the oxygen release, is slower [1].Explain why the rate of photosynthesis falls sharply above 45 degrees Celsius. [3]3 marks
Exam-style questions1. The enzymes that control photosynthesis are denatured by high temperature [1].2. The active sites change shape so substrates no longer fit [1].3. So fewer reactions occur, and the rate falls [1].
Section 8 of 9Key terms
| Term | Meaning |
|---|---|
| Light intensity | The amount of light energy falling on a surface. |
| Rate of photosynthesis | How fast a plant makes glucose or oxygen. |
| Inverse square law | Light intensity is proportional to 1 divided by distance squared. |
| Optimum temperature | The temperature at which the rate is highest. |
| Hydrogencarbonate | A compound added to water to supply carbon dioxide. |
| Heat shield | A beaker of water that absorbs heat from a lamp. |
| Denature | To change the shape of an enzyme so it no longer functions. |
Section 9 of 9Exam technique

Marked practiceQuizzes for this lesson
Photosynthesis: Limiting Factors & Graph Plateau
6CO2 + 6H2O → C6H12O6 + 6O2 (Light & Chlorophyll required)
- Limiting Factor Definition: Something present in the environment in such short supply that it restricts life processes.
- Graph Plateau: When rate levels off as light intensity increases, light is no longer the limiting factor; CO2 concentration or temperature has become limiting.
- High Temperature Drop: Beyond optimum temp (~40°C), enzymes (e.g. RuBisCO) denature, permanently decreasing rate.