1.10Physical Chemistry
Acids and Bases
15 min read 29 parts Lesson 50 of 63
Lesson summary
Complete PDF with figures and original page layoutPage 1 Oxford AQA International Your notes A Level (IAL) Chemistry Acids & Bases Contents Brønsted–Lowry Acid–Base Equilibria in Aqueous Solution Definition & Determination of pH The Ionic Product of Water,…
Section 1 of 29Brønsted–Lowry acids and bases

Theory
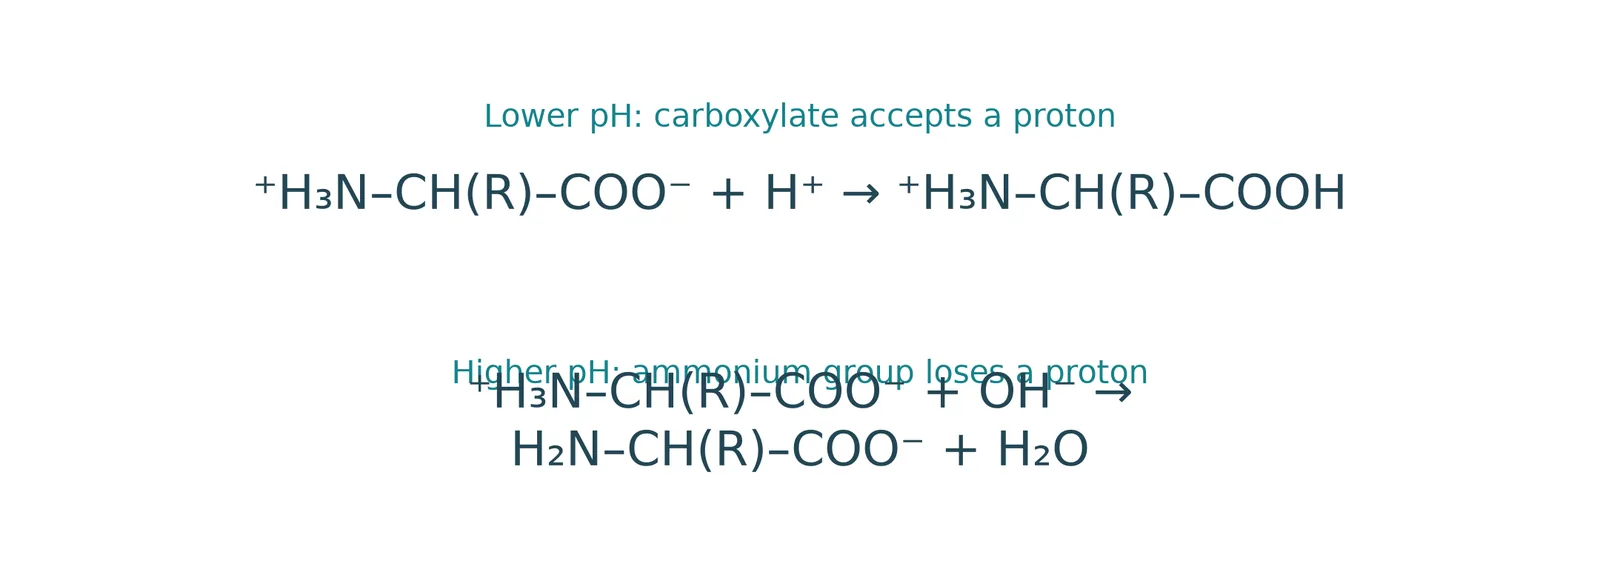
- Theory acids and bases are defined by proton transfer between species
Brønsted acid = a species that can donate a proton, such as HCl(aq) → H+(aq) + Cl-(aq)
Brønsted base = a species that can accept a proton, such as OH-(aq) + H+(aq) → H2O(l)
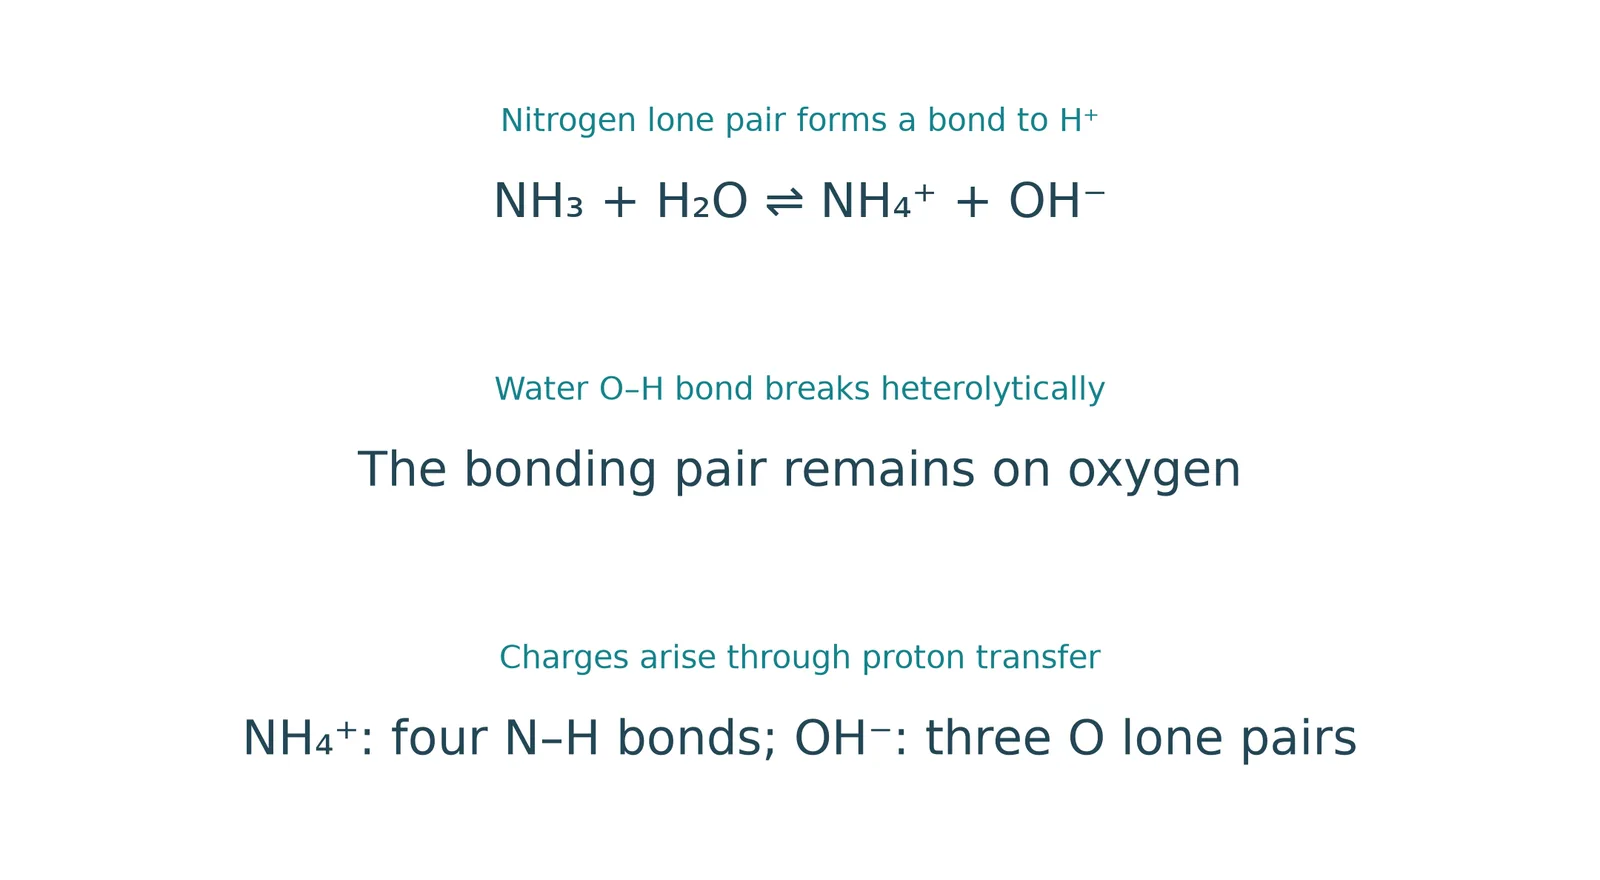
Water and ammonia
- Water and ammonia water acts as an acid and ammonia as a base
Scope
- Scope the theory applies to the gas phase too, such as HCl donating a proton to ammonia
Proton
- Proton an H+ ion has lost its electron from a hydrogen atom, so it is a proton
- (1 proton, 1 electron, 0 neutrons)
Section 2 of 29The pH scale and pH calculations

Scale
- 0 to 14 , acids below 7, alkalis above 7
- (below 1 for extremely acidic substances)
Meaning
- Meaning pH measures hydrogen ion concentration, so a lower pH means a higher [H+] and a more acidic solution
Definition
- Definition pH = −log[H+], with [H+] in mol dm-3What the symbols mean: pH has no unit · [H+] = concentration of hydrogen ions (mol dm−3); each 1 pH unit is a ten-fold change in [H+]
Reverse
- [H+] = 10-pH
Logarithmic scale
- Logarithmic scale each pH unit is a factor of 10, so pH 5 is ten times more acidic than pH 6
Precision
- Precision give pH to 2 decimal places
| [H+] / mol dm-3 | pH |
|---|---|
| 1.0 | 0 |
| 0.1 | 1 |
| 0.01 | 2 |
| 0.001 | 3 |
| 0.0001 | 4 |
- Examples
- [H+] = 1.60 × 10⁻⁴ gives pH 3.80, and pH 3.10 gives [H+] = 7.94 × 10⁻⁴ mol dm-3
Section 3 of 29pH of strong acids
Ionisation
- Ionisation strong acids ionise completely, HA(aq) → H+(aq) + A-(aq)
Concentration
- [H+] equals the acid concentration, because H+ from water is negligible
Example
- 0.01 mol dm-3 HCl has [H+] = 0.01, so pH = 2.00
Section 4 of 29The ionic product of water, K<sub>w</sub>
Equilibrium
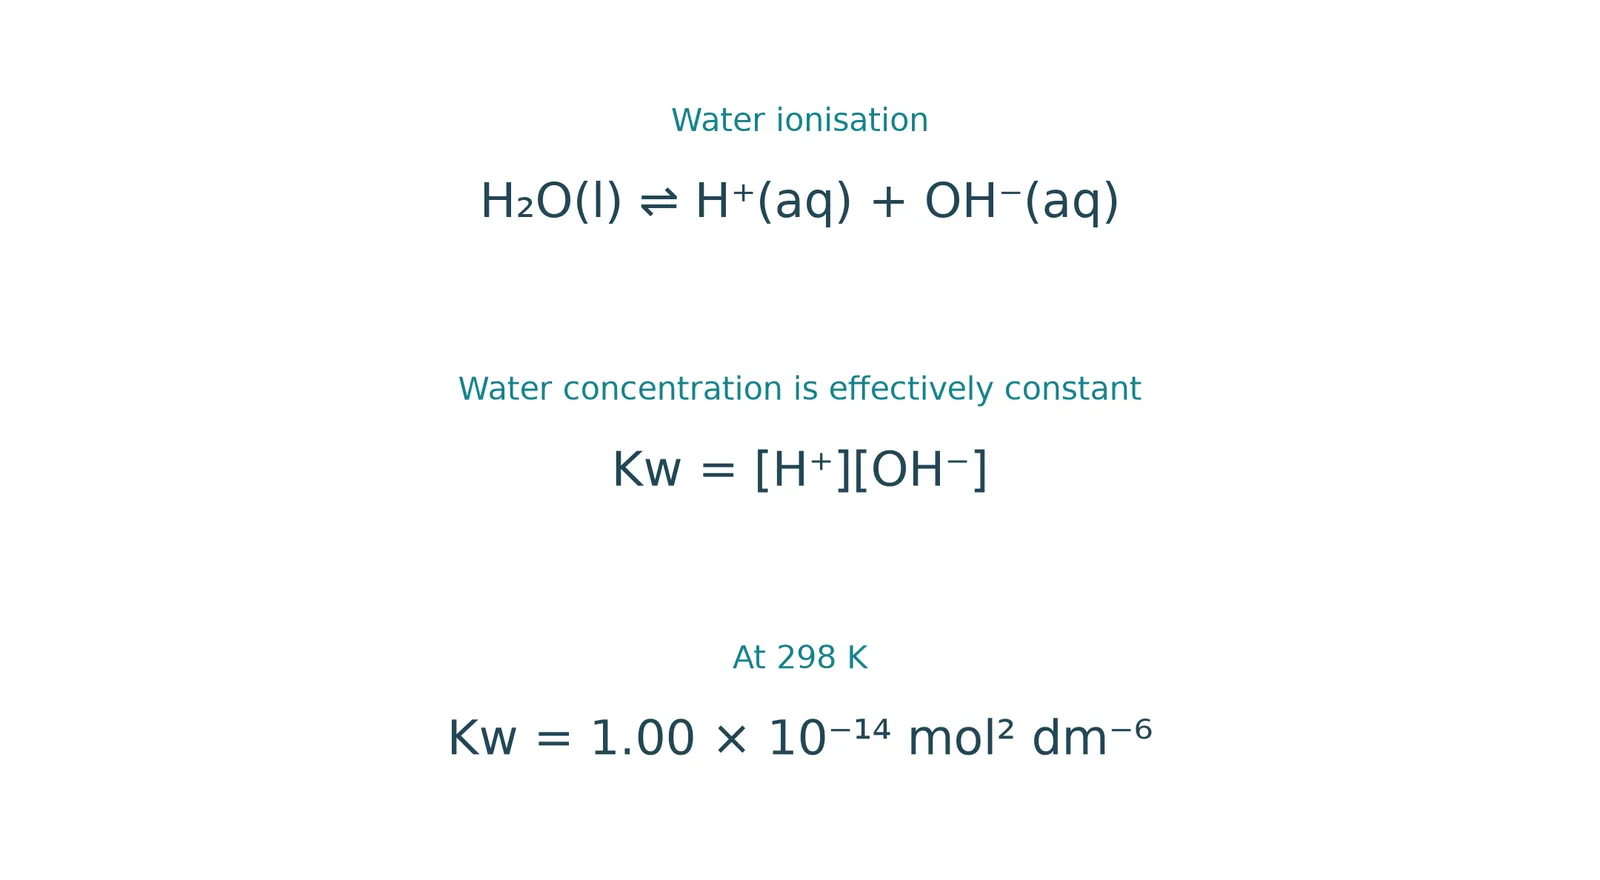
- H2O(l) ⇌ H+(aq) + OH-(aq)
Kw = the equilibrium constant for the dissociation of water, 1.00 × 10⁻¹⁴ mol2 dm-6 at 298 K
Expression
- Expression ionisation is very small, so [H2O] is constant and Kw = [H+][OH-]
Pure water
- [H+] = [OH-], so Kw = [H+]2, giving [H+] = 1.00 × 10⁻⁷ mol dm-3 and pH 7
Section 5 of 29Effect of temperature on K<sub>w</sub>

Enthalpy
- Enthalpy dissociation of water is endothermic
Shift
- Shift a higher temperature shifts the equilibrium to the right, forming more H+ and OH-, so Kw increases
pH
- pH as Kw increases the pH of pure water decreases
| T / °C | Kw / mol2 dm-6 | pH |
|---|---|---|
| 0 | 0.114 × 10⁻¹⁴ | 7.47 |
| 10 | 0.293 × 10⁻¹⁴ | 7.27 |
| 20 | 0.681 × 10⁻¹⁴ | 7.08 |
| 25 | 1.008 × 10⁻¹⁴ | 7.00 |
- Neutrality
- pure water stays neutral because [H+] = [OH-], even if its pH is not 7
Section 6 of 29pH of strong bases
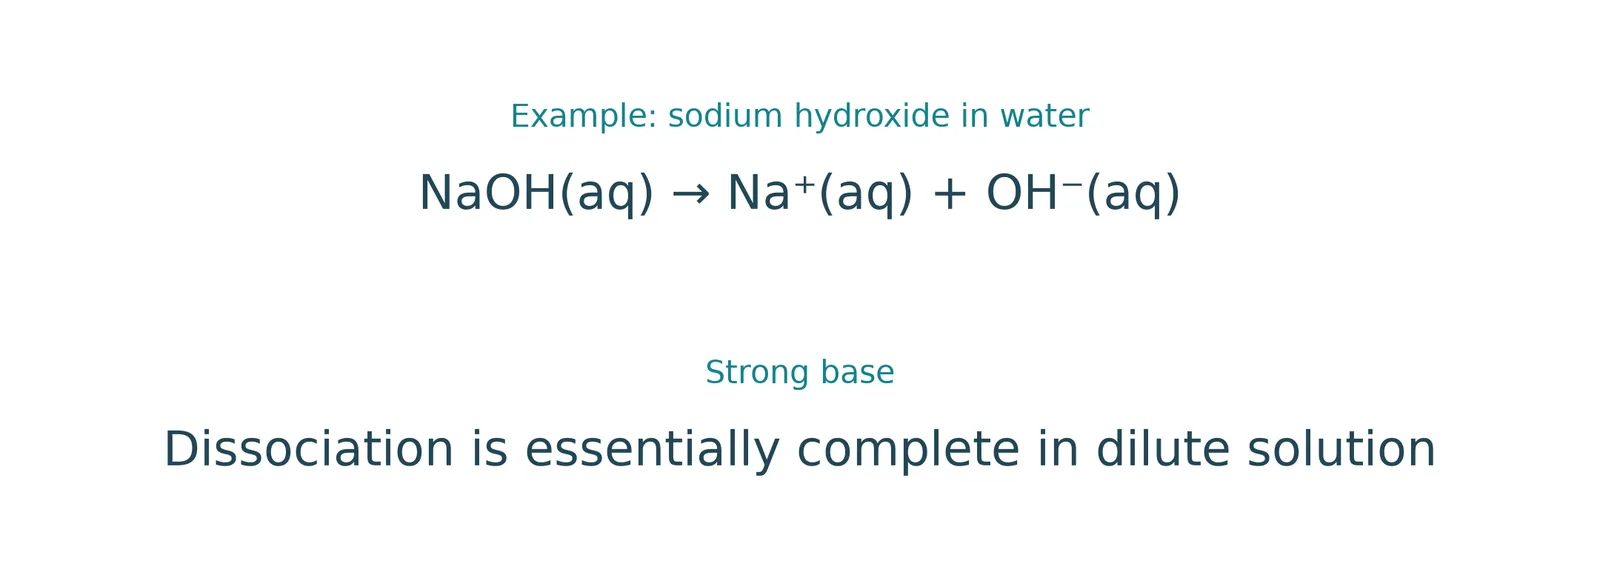
- Ionisation
- strong bases ionise completely, BOH(aq) → B+(aq) + OH-(aq), so [OH-] equals the base concentration
pH of strong bases
Find [OH-] from the concentration of the base.
Calculate [H+] = Kw ÷ [OH-].
Calculate pH = −log[H+].
- Example
- 0.15 mol dm-3 NaOH gives [H+] = 1 × 10-14 ÷ 0.15 = 6.66 × 10⁻¹⁴, so pH 13.17
Section 7 of 29Weak acids and K<sub>a</sub>









1
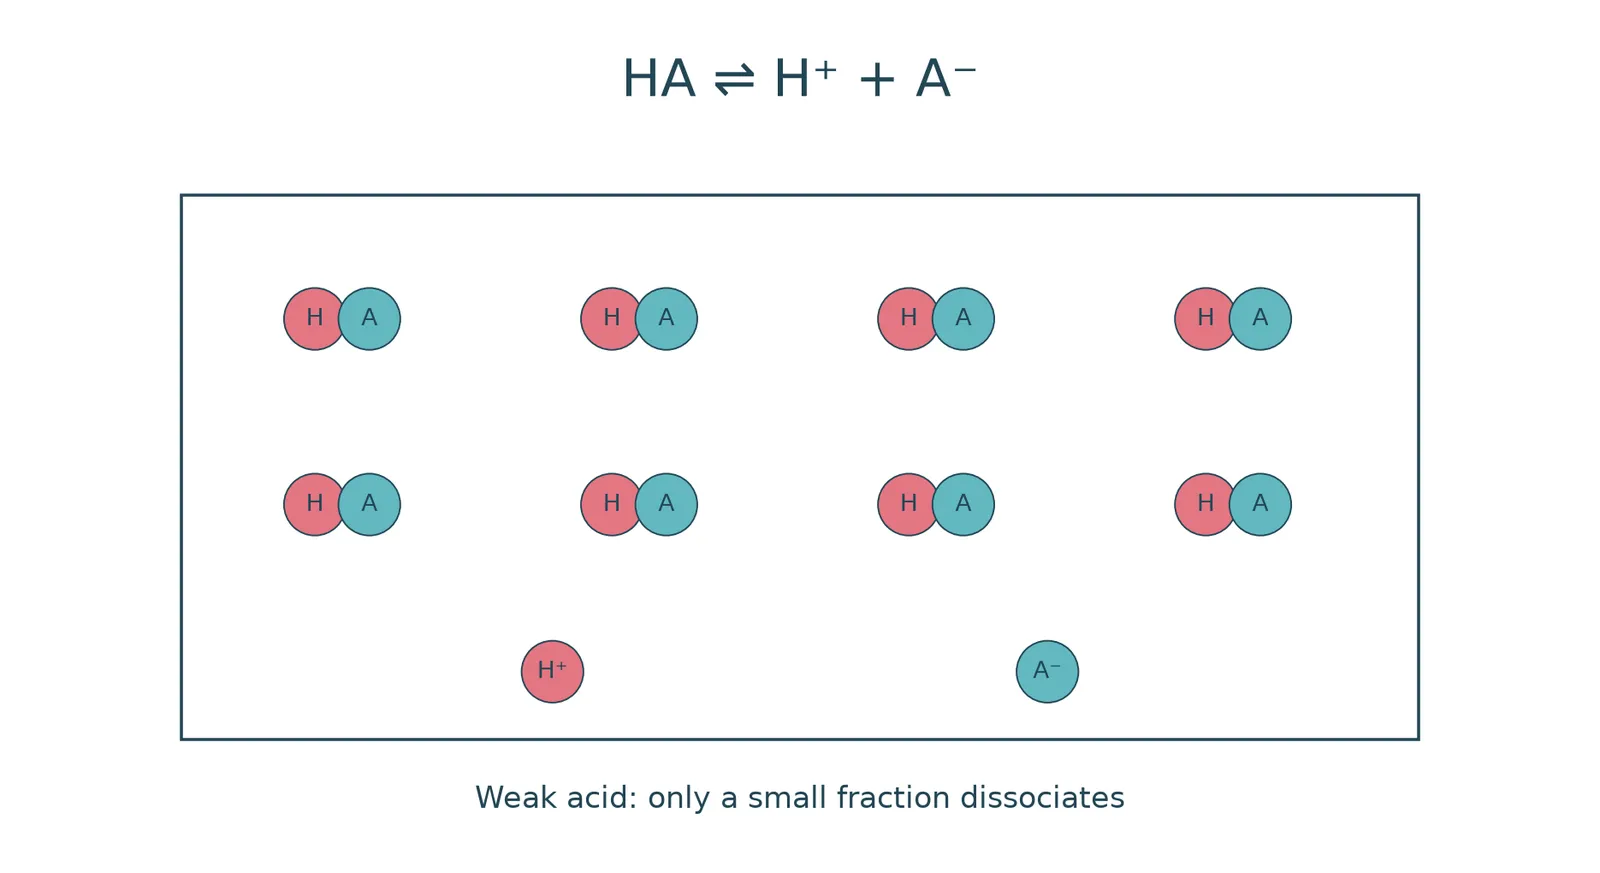
Weak acid = an acid that partially dissociates in aqueous solution, such as ethanoic acid, HCN, H2S and H2CO3
2Equilibrium
- Equilibrium the position lies far to the left, so an equilibrium is established
3Acid dissociation constant, Ka
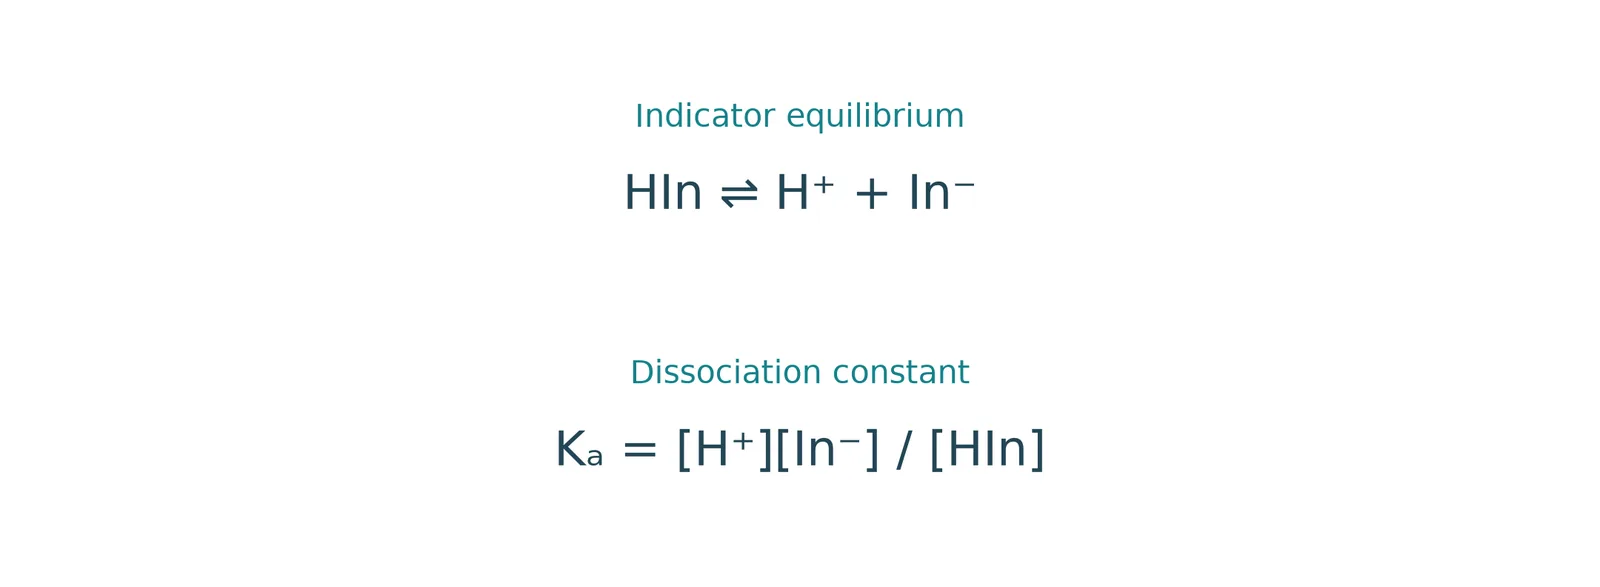
- Ka = [H+][A-] ÷ [HA], with units mol dm-3What the symbols mean: Ka = acid dissociation constant (mol dm−3) · [H+], [A−], [HA] = equilibrium concentrations (mol dm−3); larger Ka = stronger acid
4Size
- Size values are very small, such as 1.74 × 10⁻⁵ mol dm-3 for ethanoic acid
5Assumption
- H+ from the ionisation of water is negligible
6Strength
- Strength the higher the Ka, the more dissociated and stronger the acid
Section 8 of 29Calculating pH from K<sub>a</sub>
Simplification
- [H+] equals [A-], so Ka = [H+]2 ÷ [HA]
Rearranged
- [H+] = √(Ka × [HA]), then pH = −log[H+]
Example
- 0.100 mol dm-3 ethanoic acid with Ka = 1.74 × 10⁻⁵ gives [H+] = 1.32 × 10⁻³ mol dm-3 and pH 2.88
Section 9 of 29pK<sub>a</sub>
Reason
- Ka values are very small and cover a wide range, so pKa is easier to use
Definition
- Definition pKa = −log Ka
| Acid | Ka / mol dm-3 | pKa |
|---|---|---|
| Methanoic acid | 1.77 × 10⁻⁴ | 3.75 |
| Ethanoic acid | 1.74 × 10⁻⁵ | 4.75 |
| Benzoic acid | 6.46 × 10⁻⁵ | 4.18 |
| Carbonic acid | 4.30 × 10⁻⁷ | 6.36 |
Range
- Range most weak acids have pKa between 3 and 7
Strength
- Strength a lower pKa means a stronger acid
Section 10 of 29Calculating K<sub>a</sub> from pH
1
Write the dissociation equation.
2
Write Ka = [H+][A-] ÷ [HA].
3
Set [A-] equal to [H+] and substitute the values.
4
Work out the units, mol dm-3.
5
Calculate pKa = −log Ka.
- Example
- 0.100 mol dm-3 ethanoic acid with [H+] = 1.32 × 10⁻³ mol dm-3 gives Ka = 1.74 × 10⁻⁵ mol dm-3 and pKa about 4.76
Section 11 of 29Titration method
1
Measure a known volume (usually 20 or 25 cm3) of one solution with a pipette into a conical flask.
2
Put the other solution in the burette.
3
Add a few drops of indicator.
4
Add from the burette, portion by portion, until the indicator just changes colour, the end point.
5
Repeat until concordant results are obtained.
- Use
- titrations find the concentration of an unknown solution and the pH at points during the titration
Section 12 of 29Titration calculations
1Unknown concentration
- 25.00 cm3 of 0.05 mol dm-3 HCl neutralised by 8.50 cm3 NaOH gives 1.25 × 10⁻³ mol, a 1 : 1 ratio, and a concentration of 0.15 mol dm-3
2pH before the equivalence point
- pH before the equivalence point use the moles of excess acid and total volume to find [H+]
3
pH after the equivalence point (excess alkali)
- Find the moles of acid and moles of alkali added.
- Subtract to find the moles of excess alkali.
- Divide by the total volume to find [OH-].
- Use Kw to find [H+] and then the pH.
4Example
- 45 cm3 of 0.10 mol dm-3 NaOH added to 25.0 cm3 of 0.15 mol dm-3 HCl leaves 7.5 × 10⁻⁴ mol OH- in 70 cm3,
- so [OH-] = 0.0107, [H+] = 9.35 × 10⁻¹³ and pH = 12.03
Section 13 of 29Reading pH curves
Shape
- Shape all pH curves are S-shaped
Equivalence point
- Equivalence point the midpoint of the vertical region, where moles of alkali equal moles of acid
Information from a curve
- The starting pH shows the pH of the solution in the flask.
- The pH at the equivalence point.
- The volume at the equivalence point.
- The pH range of the vertical section.
Section 14 of 29Sketching a pH curve
1
Draw volume added (cm3) on the x-axis and pH on the y-axis.
2
Draw a horizontal line at pH 7 to separate the acidic and alkaline regions.
3
Identify the substance in the flask to find the starting pH.
4
Identify whether the acid and alkali are strong or weak.
5
Draw the curve.
| In the flask | Starting pH |
|---|---|
| Strong acid | About 0–2 |
| Weak acid | About 2–4 |
| Strong alkali | About 13–14 |
| Weak alkali | About 11 |
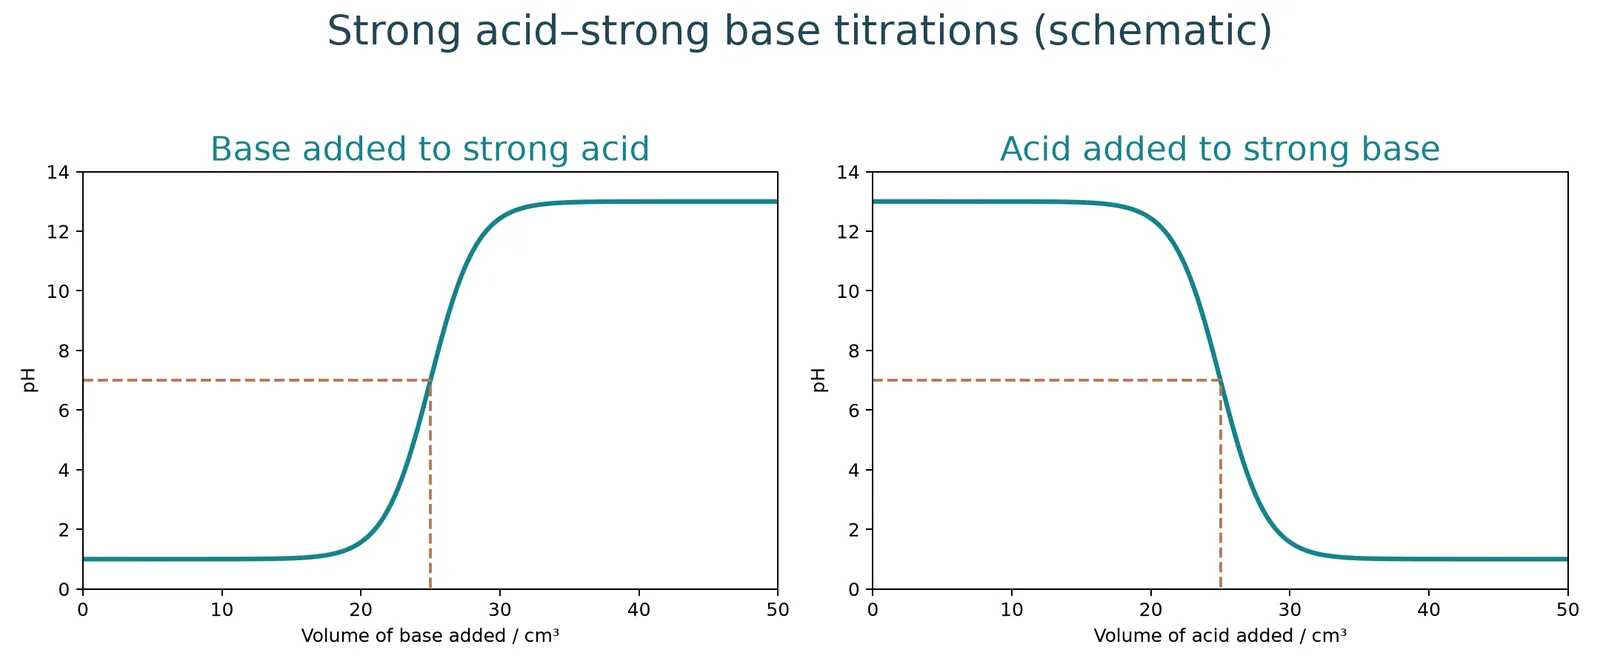
Section 15 of 29Strong acid with strong alkali
Start
- Start only H+ from the strong acid is present, with pH about 1–2
Gradual rise
- Gradual rise the pH rises slowly as H+ reacts with OH- to form water
Equivalence
- Equivalence near the equivalence point the pH surges steeply, and at the equivalence point the pH is 7
End
- End excess OH- raises the pH to about 13–14
Reverse titration
- Reverse titration adding acid to alkali gives the same shape with initial and final pH swapped, and the equivalence point still 7
Section 16 of 29Strong acid with weak alkali
Start
- Start pH about 1–2 from the strong acid
Equivalence point
- Equivalence point about pH 5.5, not neutral, because all the H+ has formed NH4+, a relatively strong acid
End
- End the pH rises above 7 but stays below that of a strong alkali because NH3 is weak
Reverse titration
- Reverse titration the shape is the same with initial and final pH swapped, and the equivalence point still about 5.5
Section 17 of 29Weak acid with strong alkali
Start
- Start pH about 2–3 for a weak acid such as ethanoic acid
Equivalence point
- Equivalence point about pH 9, slightly basic, because CH3COO- is a relatively strong base
End
- End the pH rises to about 13–14
Sketch of a worked case
- 10.0 cm3 of 0.150 mol dm-3 weak acid starting at pH 5.3 with 0.100 mol dm-3 NaOH has its vertical section at 15.0 cm3, with the equivalence point above pH 7 and the curve ending at pH 12.5 at 20 cm3
Reverse titration
- Reverse titration the same shape with initial and final pH swapped, and equivalence still about 9
Section 18 of 29Weak acid with weak alkali and indicators
1Weak acid with weak alkali
- Weak acid with weak alkali there is no vertical region, only a point of inflexion at the equivalence point,
- and the curve gives little other information
2Indicators
- Indicators substances that change colour in acidic or alkaline solution, chosen using the pH of the equivalence point
| Indicator | pH range | Colour change |
|---|---|---|
| Methyl orange | 3.1–4.4 | Red to yellow |
| Phenolphthalein | 8.3–10.0 | Colourless to pink |
Section 19 of 29Choosing an indicator
- Rule
- the indicator must change colour within the vertical region of the pH curve, close to the equivalence point
| Titration | Suitable indicator |
|---|---|
| Strong acid and strong alkali | Either methyl orange or phenolphthalein, since both ranges lie in the vertical region |
| Strong acid and weak alkali | Methyl orange only, since only it changes near the equivalence point |
| Weak acid and strong alkali | Phenolphthalein only, since the methyl orange range falls below the curve |
| Weak acid and weak alkali | Neither, so a different method is needed |
Section 20 of 29Required Practical 6: aim and calibration
Aim
- Aim to investigate how the pH of ethanoic acid changes as sodium hydroxide is added
Apparatus
- Apparatus two 50 cm3 burettes, two funnels, 100 cm3 beaker, wash bottle of deionised water, stand and clamp, pH meter or probe, 0.100 mol dm-3 NaOH, 0.100 mol dm-3 ethanoic acid, standard buffers at pH 4.00, 7.00 and 9.20, stirring rod and graph paper
1
Rinse the pH probe with deionised water and shake off excess.
2
Place it in the pH 7.00 buffer with the bulb fully immersed and record the reading.
3
Repeat with the pH 4.00 and 9.20 buffers, rinsing the probe before each reading.
4
Plot the recorded pH (x-axis) against the buffer pH (y-axis) as a calibration graph.
Section 21 of 29Required Practical 6: measuring pH during the titration
1
Use one burette to put exactly 20.0 cm3 of ethanoic acid into a clean 100 cm3 beaker.
2
Rinse and fill the second burette with NaOH solution.
3
Clamp the pH probe with the bulb fully immersed in the acid.
4
Stir gently and record the starting pH.
5
Add 2.0 cm3 of NaOH, stir and record the pH.
6
Continue in 2.0 cm3 portions up to 18 cm3.
7
Near the end point add 0.20 cm3 portions until 22.0 cm3.
8
Then add 2.0 cm3 portions up to 40 cm3.
- Practical tips
- Wait a few seconds for the pH to stabilise before reading.
- Do not stir too fast, because bubbles make the reading unsteady.
Section 22 of 29Required Practical 6: results and evaluation
- Results table
- volume of NaOH, measured pH and corrected pH
1
Use the calibration graph to correct each pH reading.
2
Enter the corrected values in a new column.
3
Plot corrected pH (y-axis) against volume of NaOH (x-axis).
4
Join the points sensibly and comment on the shape of the curve.
Interpretation
- Interpretation the equivalence point is where neutralisation occurs, such as 25 cm3 of base in the example curve
Indicator
- Indicator phenolphthalein suits this weak acid and strong base titration because it changes colour near the equivalence point
Section 23 of 29Buffer solutions
Buffer = a solution that resists changes in pH when small amounts of acid or alkali are added
Mechanism
- Mechanism it keeps the concentrations of H+ and OH- almost constant
Limit
- Limit buffers cannot cope with large additions of acid or alkali, because the pH then changes significantly
Section 24 of 29Acidic buffers
Composition
- Composition a weak acid and a soluble salt of that acid, such as ethanoic acid with sodium ethanoate
Species present
- Ethanoic acid partially ionises, CH3COOH ⇌ H+ + CH3COO-, so it is mostly molecules.
- Sodium ethanoate fully ionises, giving a high concentration of CH3COO-.
- The mixture therefore holds high concentrations of both CH3COOH and CH3COO-.
Adding acid (H+)
- The equilibrium shifts left, as H+ reacts with CH3COO- to form CH3COOH.
- Large reserves of both species mean their concentrations barely change.
- The pH stays almost constant.
Adding alkali (OH-)
- OH- reacts with H+ to form water, H+(aq) + OH-(aq) → H2O(l).
- The equilibrium shifts right, as more CH3COOH ionises to replace the H+.
- The pH stays almost constant.
Section 25 of 29Basic buffers
Role
- Role they keep the pH above 7
Composition
- Composition a weak base and its salt, such as aqueous ammonia with ammonium chloride
Equilibrium
- NH3(aq) + H2O(l) ⇌ NH4+(aq) + OH-(aq) lies to the left, and NH4Cl fully dissociates, giving high concentrations of NH3 and NH4+
Adding acid
- NH3(aq) + H+(aq) ⇌ NH4+(aq), which removes the added H+
Adding alkali
- NH4+(aq) + OH-(aq) ⇌ NH3(aq) + H2O(l), which removes the added OH-
Section 26 of 29Applications of buffers
Blood
- HCO3- ions buffer blood pH between 7.35 and 7.45
- Cells produce CO2 in aerobic respiration, and CO2(g) + H2O(l) ⇌ H+(aq) + HCO3-(aq).
- More H+ shifts the equilibrium left and less H+ shifts it right, keeping pH constant.
- Without control the blood pH would fall, causing acidosis, malfunction and eventually coma.
Everyday products
- Everyday products buffers are used in shampoos and detergents
Section 27 of 29Buffer pH calculations
1Method
- Method use Ka and the equilibrium concentrations of the weak acid and its conjugate base (salt)
2Rearranged
- [H+] = Ka × [acid] ÷ [salt]
3Henderson–Hasselbalch equation
- Henderson–Hasselbalch equation pH = pKa + log([A-] ÷ [HA])
4Example
- 0.305 mol dm-3 ethanoic acid and 0.520 mol dm-3 sodium ethanoate with Ka = 1.74 × 10⁻⁵ gives [H+] = 1.02 × 10⁻⁵ mol dm-3 and pH 4.99
Section 28 of 29Key terms
| Term | Meaning |
|---|---|
| Brønsted–Lowry acid | A proton donor. |
| Brønsted–Lowry base | A proton acceptor. |
| pH | The negative logarithm to base 10 of the hydrogen ion concentration. |
| Ionic product of water | Kw = [H+][OH-]. |
| Weak acid | An acid that dissociates only partially in water. |
| Acid dissociation constant | Ka, the equilibrium constant for dissociation of a weak acid. |
| Term | Meaning |
|---|---|
| pKa | The negative logarithm of Ka. |
| Equivalence point | The point at which the moles of acid equal the moles of alkali. |
| End point | The point at which the indicator changes colour. |
| Indicator | A substance that changes colour over a specific pH range. |
| Titration curve | A graph of pH against volume of titrant added. |
| Term | Meaning |
|---|---|
| Buffer solution | A solution that resists changes in pH when small amounts of acid or alkali are added. |
| Acidic buffer | A weak acid and a soluble salt of that acid. |
| Basic buffer | A weak base and its salt. |
| Calibration | Checking a pH probe against standard buffers and correcting its readings. |
| Henderson–Hasselbalch equation | pH = pKa + log([salt] ÷ [acid]). |
Section 29 of 29Exam technique
1
Saying pH is not logarithmic — each pH unit is a tenfold change.
2
Using [H+] = [acid] for a weak acid — only strong acids ionise completely.
3
Quoting pH to one decimal place — give two decimal places.
4
Saying pure water at a high temperature is acidic — it is still neutral, but its pH is lower than 7.
1
Saying the equivalence point is always pH 7 — it depends on the strength of the acid and alkali.
2
Using the original volume instead of the total volume for excess concentration — use the total volume.
3
Drawing a vertical section for weak acid with weak alkali — it has only an inflexion.
4
Starting a weak acid at pH 0 — a weak acid starts at about 2–4.
1
Using methyl orange for weak acid with strong alkali — its range is below the vertical region.
2
Saying buffers work with any amount of acid — they resist only small additions.
3
Forgetting to calibrate the pH probe — raw readings must be corrected.
4
Using the weak acid concentration alone in a buffer calculation — the salt concentration is also needed.