1.11Physical Chemistry
Rate Equations
15 min read 28 parts Lesson 58 of 63
Lesson summary
Complete PDF with figures and original page layoutPage 1 Oxford AQA International Your notes A Level (IAL) Chemistry Rate Equations Contents Rate Equations The Arrhenius Equation Determination of Rate Equation Measuring the Rate of a Reaction …
Section 1 of 28Rate of reaction
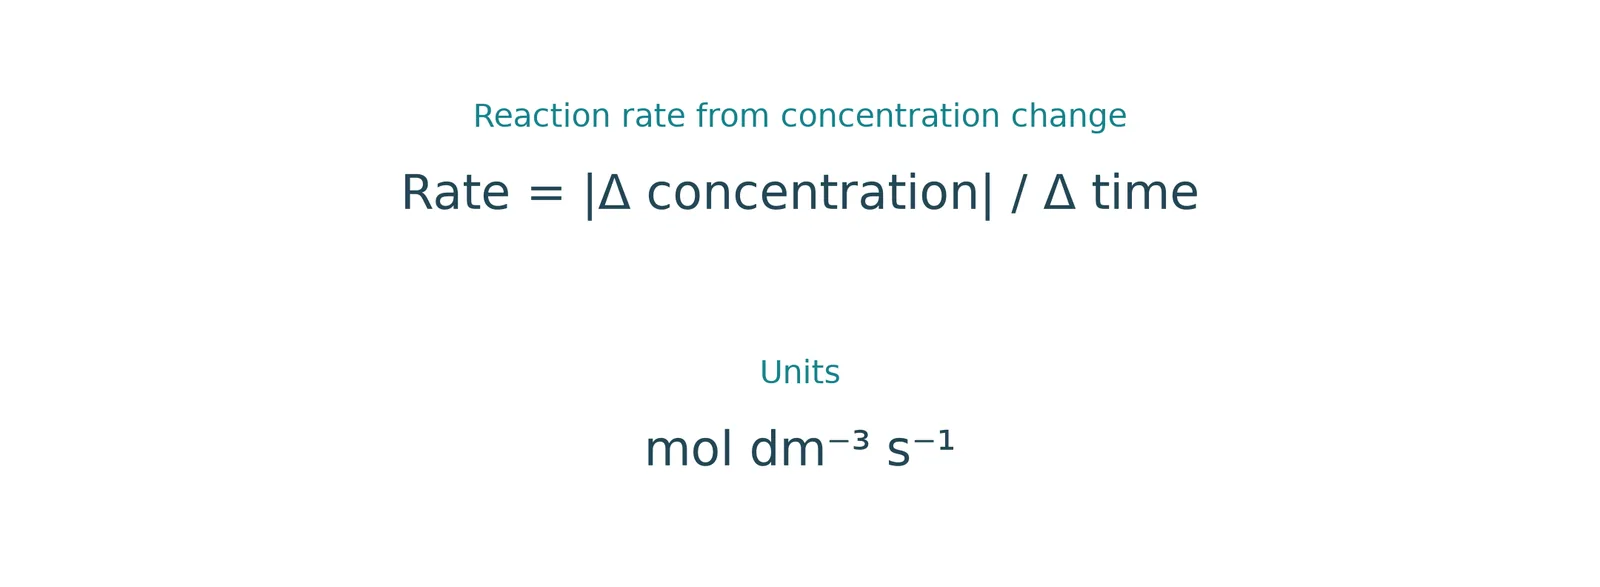
Definition
- Definition the change in amount or concentration of a reactant or product per unit time
Unit
- Unit mol dm-3 s-1
Measurement
- Measurement measure the decrease in reactant concentration or the increase in product concentration over time
Section 2 of 28The rate equation
1Origin
- Origin rate equations can only be found experimentally, not from the stoichiometric equation
2General form
- General form for P + Q → products, rate = k[P]m[Q]nWhat the symbols mean: rate (mol dm−3 s−1) · k = rate constant · [ ] = concentration (mol dm−3) · each power is the order with respect to that reactant
- (units depend on the overall order)
3
Terms
- k is the rate constant (proportionality constant).
- [P] and [Q] are reactant concentrations.
- m and n are the orders, which can only be 0, 1 or 2.
4Products
- Products their concentrations are not included, as they do not affect the rate
5First-order example
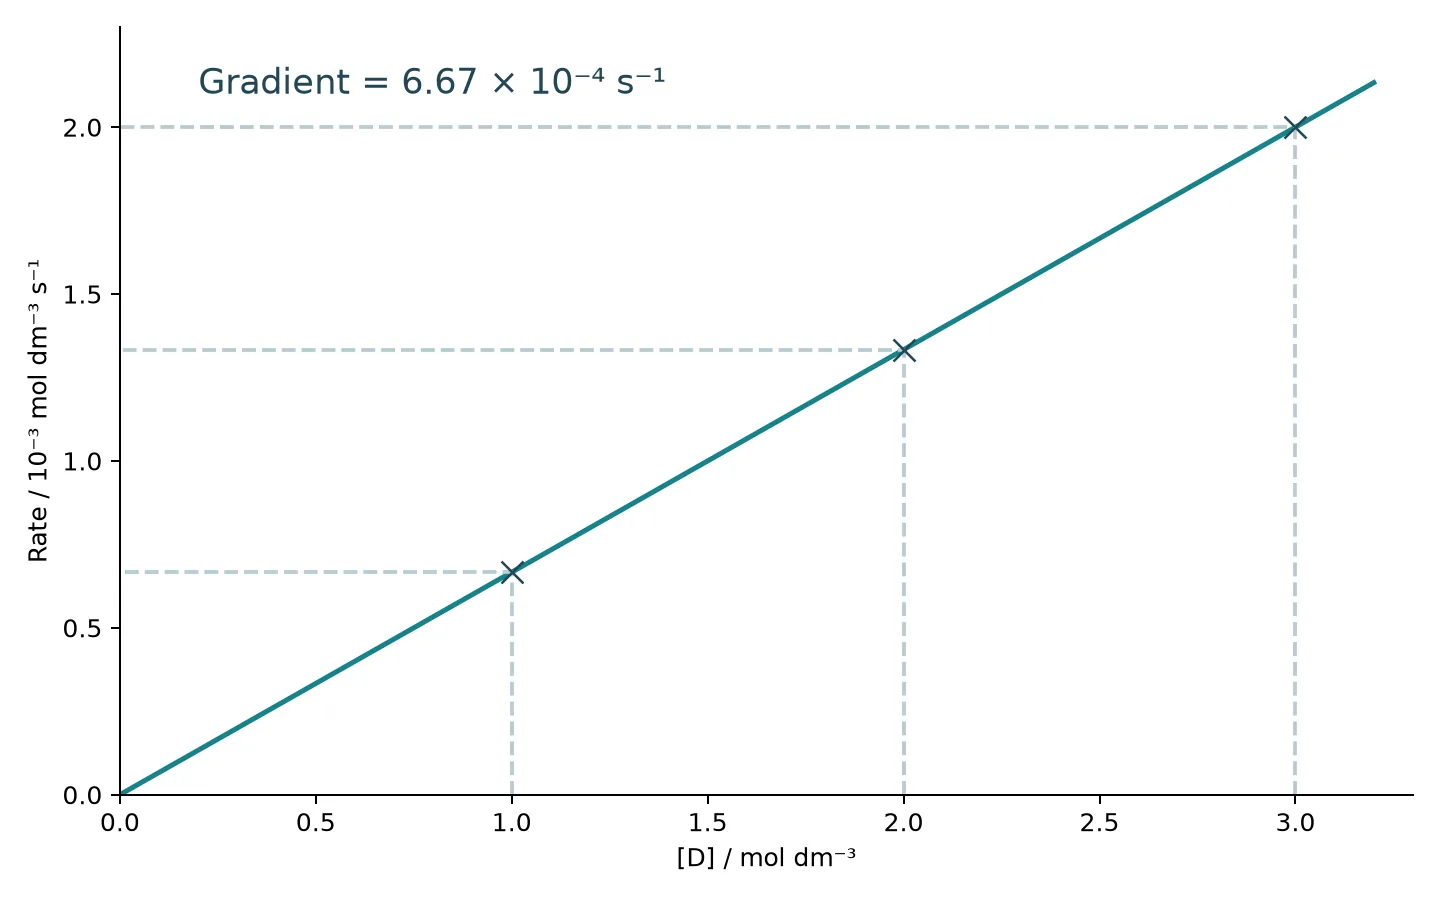
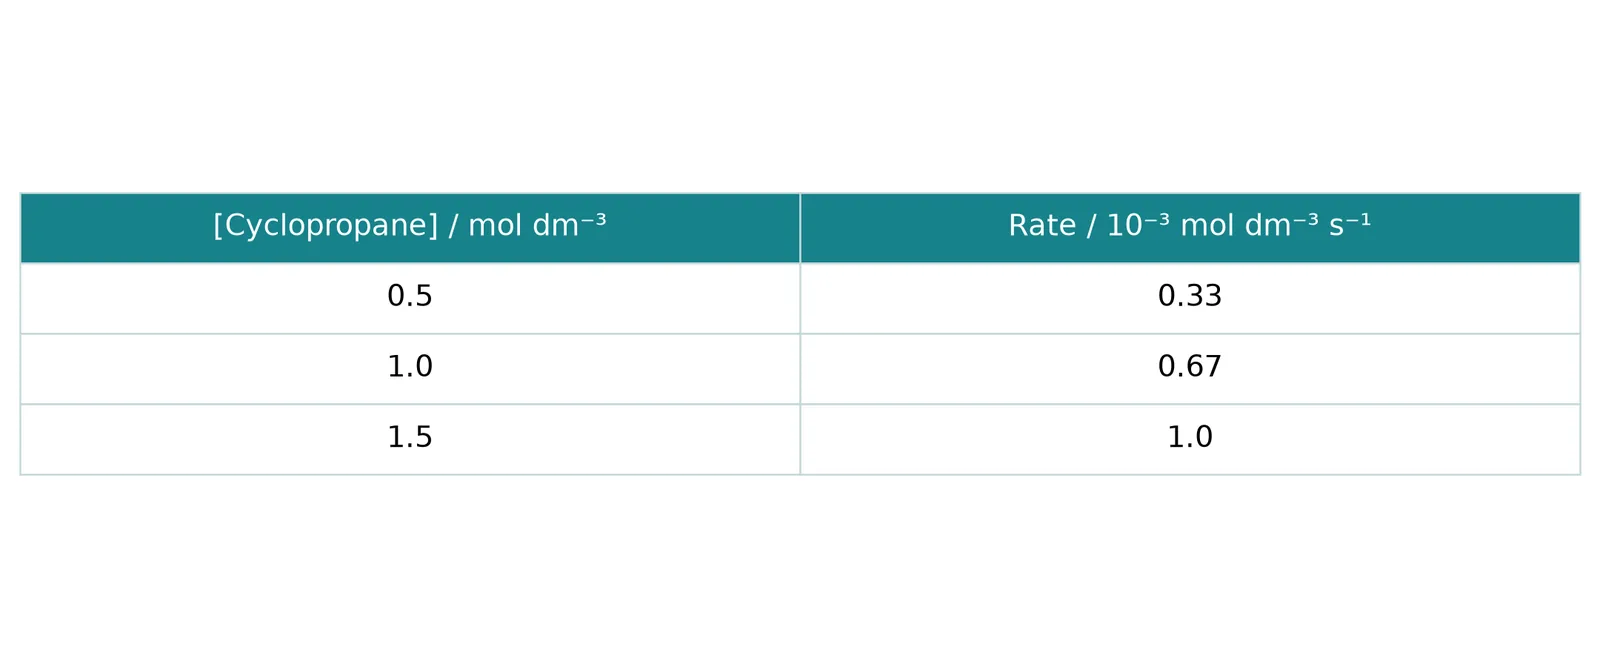
- First-order example rate = k[D], because rate ÷ [D] is constant at 6.67 × 10⁻⁴ s-1 for [D] of 3.00, 2.00 and 1.00 mol dm-3
Section 3 of 28Nitric oxide and hydrogen
Reaction
- 2NO(g) + 2H2(g) → N2(g) + 2H2O(g), with rate = k[NO]2[H2]
Method
- Method keep one concentration constant to see the effect of the other
With [H2] constant
- With [H2] constant the rate is proportional to [NO]2
With [NO] constant
- With [NO] constant the rate is proportional to [H2]
Key point
- H2 is not second order even though its coefficient is 2, because orders come from experiment, not from the equation
Section 4 of 28Order of reaction

Order = the power to which the concentration of a reactant is raised in the rate equation
Zero order
- Changing the concentration has no effect on the rate.
- The reactant does not appear in the rate equation.
First order
- The rate is directly proportional to the concentration.
- Doubling the concentration doubles the rate.
Second order
- The rate is proportional to the square of the concentration.
- Doubling the concentration increases the rate fourfold.
Overall order
- Overall order the sum of the individual orders, so rate = k[NO]2[H2] is second order in NO, first order in H2 and third order overall
Section 5 of 28Using the rate equation
N2O5 decomposition
- N2O5 decomposition rate = k[N2O5]
- The order is 1.
- Tripling the concentration triples the rate.
Bromate and bromide
- Bromate and bromide rate = k[BrO3-][Br-][H+]
- Each reactant is first order, so the overall order is 3.
- Doubling [BrO3-] doubles the rate and halving [Br-] halves it, so there is no overall change.
Section 6 of 28Deducing orders from a table


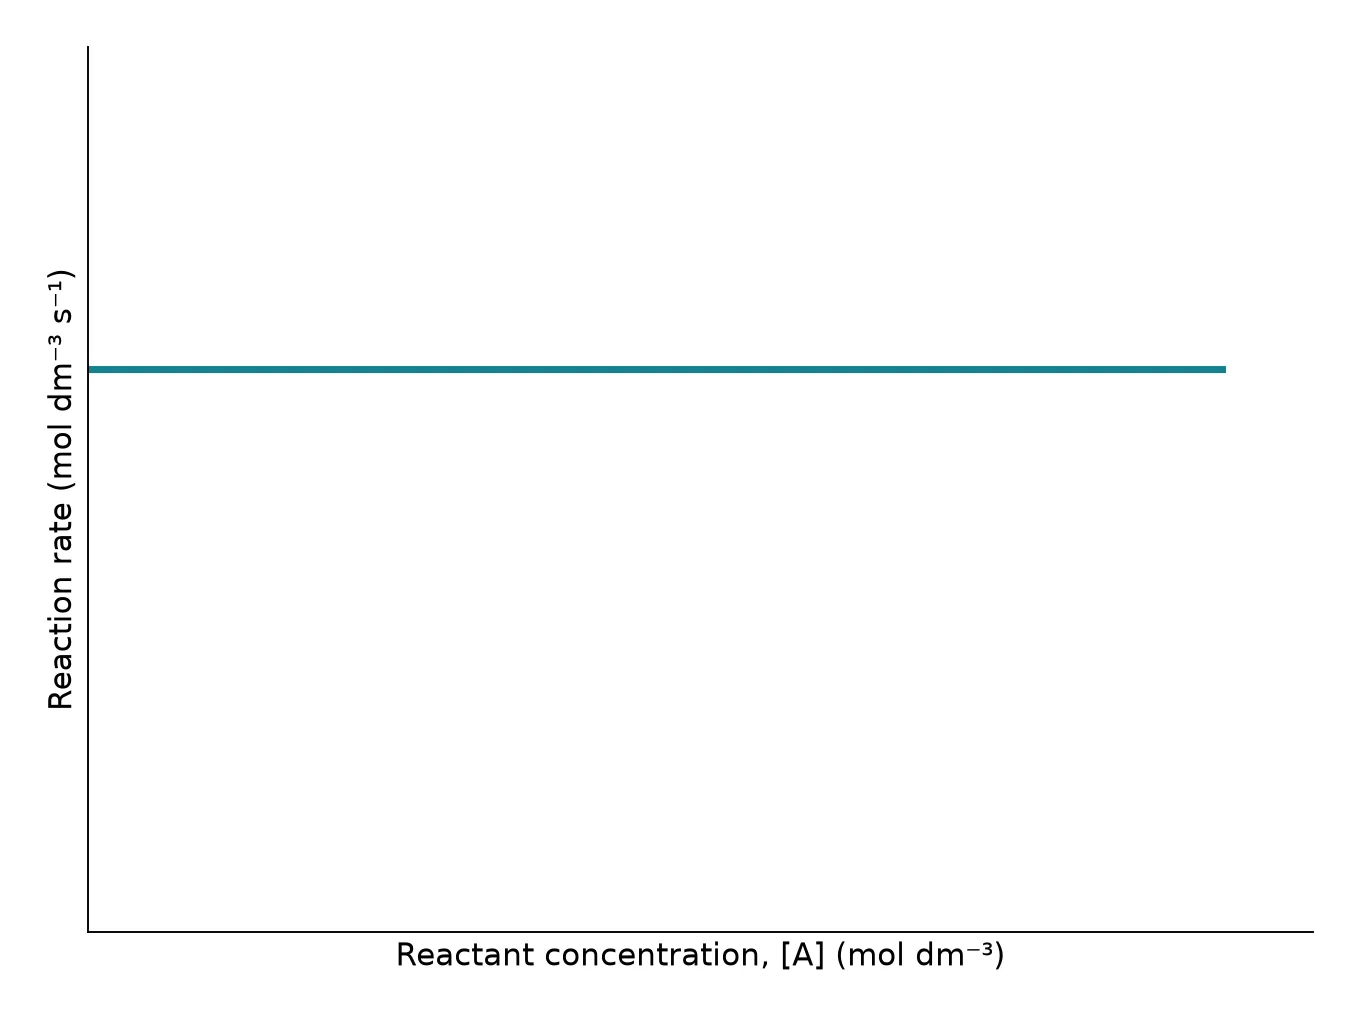
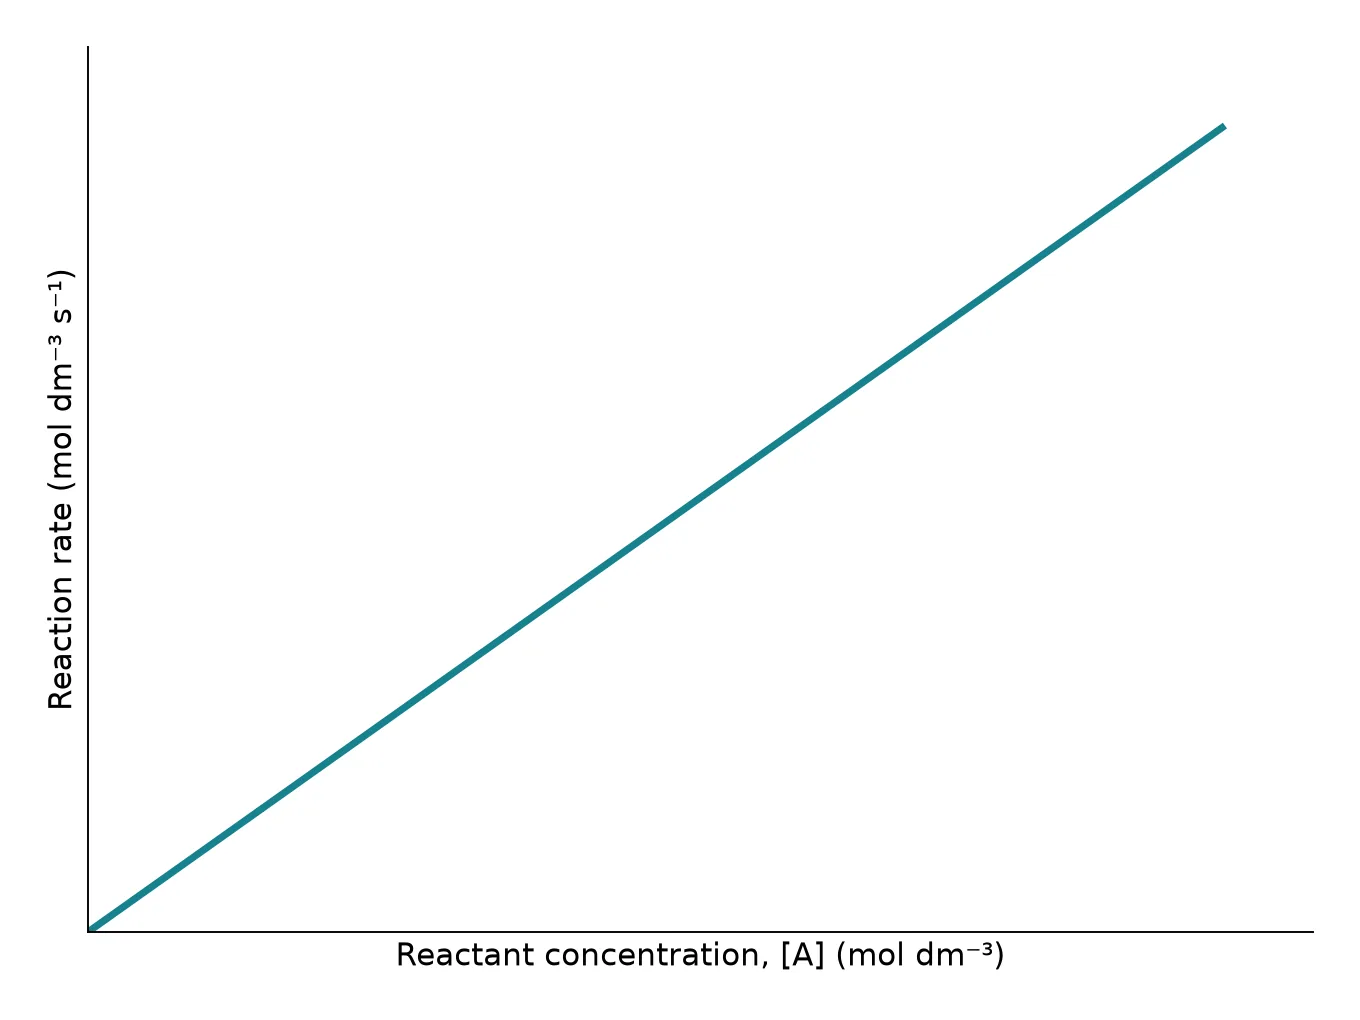

- Approach
- use a graph or a table of results with calculation
- (its shape shows the order)
- use a graph or a table of results with calculation
1
Find two experiments in which only one reactant concentration changes.
2
Calculate how that concentration changed.
3
Calculate how the rate changed.
4
Decide the order for that reactant.
5
Repeat for each reactant.
2-bromo-2-methylpropane and hydroxide
- Experiments 1 and 2: [(CH3)3CBr] doubles and the rate doubles, so first order.
- Experiments 1 and 3: [OH-] doubles and the rate increases fourfold, so second order.
- Rate = k[(CH3)3CBr][OH-]2.
Writing the equation
- Writing the equation omit zero-order reactants, and omit the power 1 for first-order reactants
Caution
- Caution read standard form values carefully
Section 7 of 28Calculating the rate constant

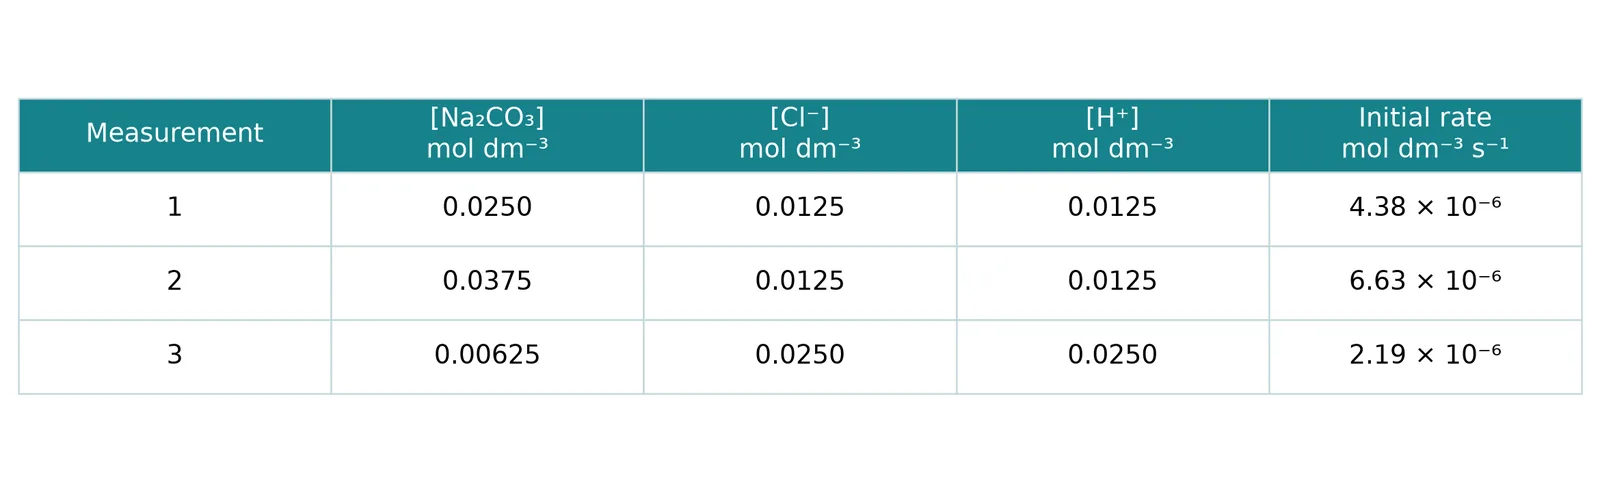


Method
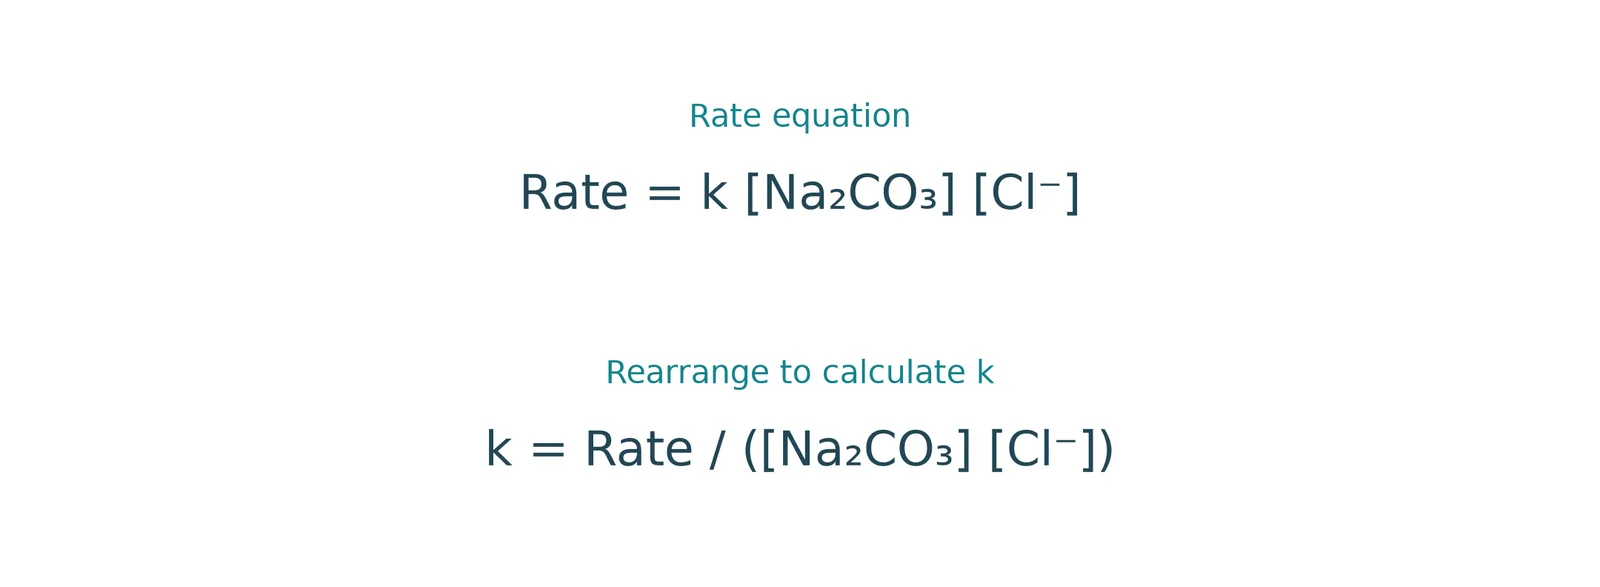
- Method rearrange the rate equation to k = rate ÷ , and use one set of initial values
- (concentration terms)
Example
- Example rate = k[Na2CO3][Cl-] with an initial rate of 4.38 × 10⁻⁶ mol dm-3 s-1, [Na2CO3] = 0.0250 and [Cl-] = 0.0125 mol dm-3
Result
- Result k = 1.40 × 10⁻² dm3 mol-1 s-1
Consistency
- Consistency the other experiments give the same value of k
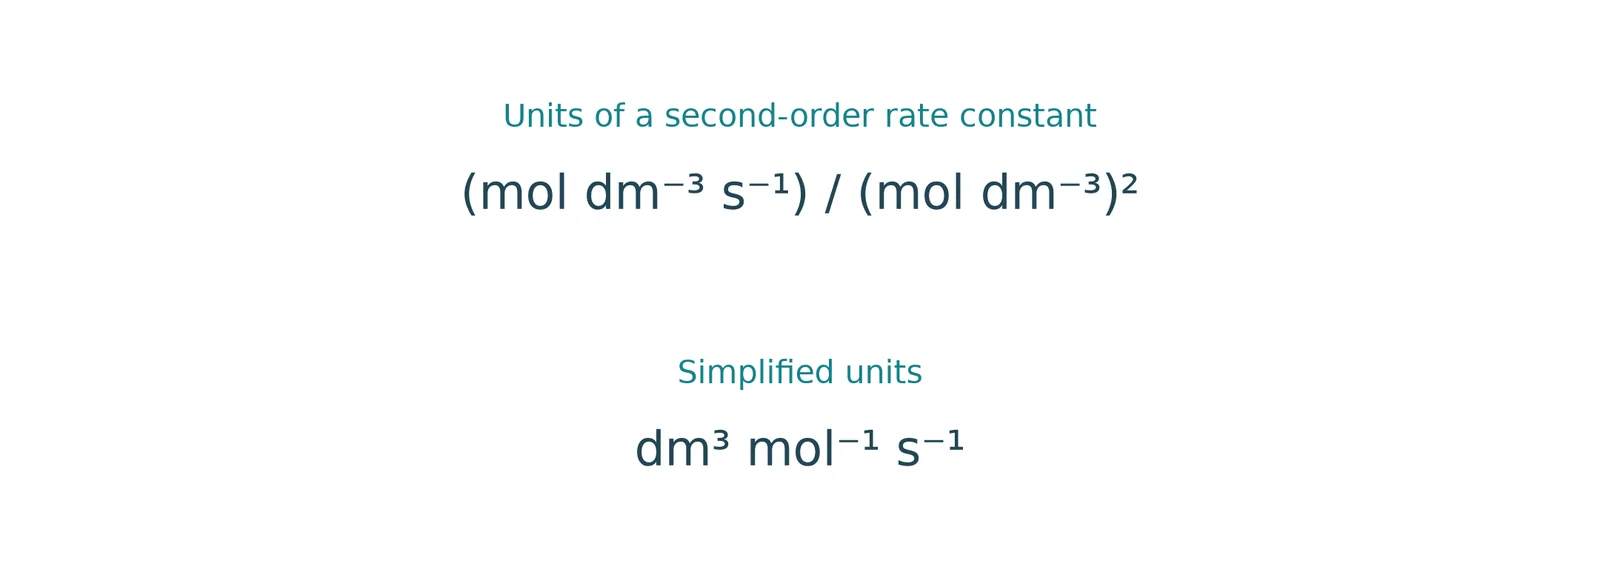
Units
- Units they depend on the overall order, as for first order (s-1) and second order (dm3 mol-1 s-1)
Section 8 of 28The Arrhenius equation
Rate constant
- Rate constant k is constant only if concentration is the only factor changed, and it changes with temperature or a catalyst
Temperature effect
- Temperature effect at higher temperature a greater proportion of molecules have energy of at least the activation energy, so both rate and k increase
Equation
- Equation k = Ae−Ea/RTWhat the symbols mean: k = rate constant · A = pre-exponential (frequency) factor · Ea = activation energy (J mol−1) · R = 8.31 J mol−1 K−1 · T = temperature (K)
Terms
- Ea and A are characteristic constants of a reaction, and A varies only slightly with temperature.
- R is the gas constant.
- k and T are the only variables.
Scope
- Scope it applies to reactions in gases, in solution and on catalyst surfaces
Section 9 of 28Using the Arrhenius equation
Logarithmic form
- Logarithmic form ln k = ln A − Ea/RT, which is easier to use
Higher temperature
- Higher temperature ln k increases, so k and the rate increase
Higher activation energy
- Higher activation energy a smaller proportion of molecules has enough energy, so k and the rate decrease
Typical task
- Typical task use measured k and T values to calculate the activation energy
Rearranged
- Ea = (ln A − ln k) × RT
Example
- Example at 400 K with k = 6.25 × 10⁻⁴ s-1, A = 4.6 × 10¹³ and R = 8.31 J K-1 mol-1, Ea = × 3324 = 129 kJ mol-1
- (31.4597 + 7.3778)
Syllabus note
- Syllabus note the equations need not be learned, but must be rearranged
Section 10 of 28Arrhenius plot
- Plot
- ln k (y) against 1/T (x) gives a straight line
| Part of y = mx + c | Quantity |
|---|---|
| y | ln k |
| x | 1/T |
| m (gradient) | −Ea/R |
| c (intercept) | ln A |
Activation energy
- Ea = −gradient × R
Example
- Example a gradient of −3666.6 gives Ea = 3666.6 × 8.31 = 30.5 kJ mol-1
Constant A
- Constant A substitute a point from the graph, such as (2.60 × 10⁻³, −7.0), into ln k = (−Ea/R)(1/T) + ln A, giving ln A = 2.53 and A = 12.55
Meaning
- Meaning a higher T gives a greater ln k and so a faster reaction
Section 11 of 28Concentration–time graphs
Use
- Use they show the overall rate and the order for a reactant
Zero order
- The reactant concentration falls in a straight line.
- The rate is constant.
First order
- The concentration falls as a downward curve that eventually plateaus.
Second order
- The concentration falls as a steeper curve, decreasing more at first than in first order.
Section 12 of 28Initial rate from a concentration–time graph
- Initial rate = the rate at the very start of the reaction, when the reactant concentrations are known exactly
Initial rate from a concentration–time graph
Draw a tangent to the curve at t = 0 s.
Calculate the gradient of the tangent, which is the initial rate.
Section 13 of 28Initial-rate experiments
Conditions
- Conditions the temperature must stay constant and only one reactant concentration changes in each experiment
Procedure
- Procedure for each experiment draw a concentration–time graph and find the initial rate from the tangent at t = 0
General reaction
- General reaction for 2A + B + C, experiment 1 uses base concentrations, experiment 2 changes [A], experiment 3 changes [B] and experiment 4 changes [C]
| Experiment | [A] / mol dm-3 | [B] / mol dm-3 | [C] / mol dm-3 | Initial rate / mol dm-3 s-1 |
|---|---|---|---|---|
| 1 | 1.5 × 10⁻³ | 1.5 × 10⁻³ | 1.5 × 10⁻³ | 2.1 × 10⁻³ |
| 2 | 3.0 × 10⁻³ | 1.5 × 10⁻³ | 1.5 × 10⁻³ | 2.1 × 10⁻³ |
| 3 | 1.5 × 10⁻³ | 3.0 × 10⁻³ | 1.5 × 10⁻³ | 4.2 × 10⁻³ |
| 4 | 1.5 × 10⁻³ | 1.5 × 10⁻³ | 3.0 × 10⁻³ | 8.4 × 10⁻³ |
Deducing the orders
- Experiments 1 and 2: [A] doubles and the rate is unchanged, so zero order in A.
- Experiments 1 and 3: [B] doubles and the rate doubles, so first order in B.
- Experiments 1 and 4: [C] doubles and the rate quadruples, so second order in C.
Rate equation
- Rate equation rate = k[B][C]2What the symbols mean: rate (mol dm−3 s−1) · k = rate constant · [ ] = concentration (mol dm−3) · each power is the order with respect to that reactant
- (units depend on the overall order)
Section 14 of 28Rate–concentration graphs (start)
Method
- Method rates measured at various initial concentrations of each reactant are plotted against concentration
Zero order
- The rate does not depend on concentration, so the graph is a horizontal line.
- Rate = k.
Section 15 of 28Rate–concentration graphs
1Zero order
- Zero order rate = k
- The rate stays constant, so the graph is a horizontal line.
2First order
- First order rate = k[A]What the symbols mean: rate (mol dm−3 s−1) · k = rate constant · [ ] = concentration (mol dm−3) · each power is the order with respect to that reactant
- (units depend on the overall order)
- The rate is proportional to concentration, so the graph is a straight line.
- Its gradient is k.
3Second order
- Second order rate = k[A]2
- The rate is proportional to the square of the concentration, so the graph is a smooth curve.
4Exam note
- Exam note a question may give a graph for one reactant and a table for the others, so use both
Section 16 of 28Rate equations and mechanisms
Mechanism = a description of the steps in which bonds break and form in a reaction
Rate-determining step = the slowest step in a mechanism
Link
- Link every reactant in the rate equation appears in the rate-determining step
Exclusions
- Exclusions zero-order reactants and intermediates are not in the rate-determining step
Section 17 of 28Predicting a mechanism
Example
- NO2(g) + CO(g) → NO(g) + CO2(g) with rate = k[NO2]2
Deduction
- Deduction it is second order in NO2 and zero order in CO, so two NO2 molecules are in the rate-determining step
Possible mechanism
- Step 1 (slow): 2NO2 → NO + NO3.
- Step 2 (fast): NO3 + CO → NO2 + CO2.
- Adding the steps and cancelling gives NO2 + CO → NO + CO2.
Section 18 of 28Deducing the rate equation from a mechanism
Example
- 2NO + 2H2 → N2 + 2H2O
Mechanism
- Step 1 (fast): NO + NO → N2O2.
- Step 2 (slow, rate-determining): N2O2 + H2 → H2O + N2O.
- Step 3 (fast): N2O + H2 → N2 + H2O.
Deduction
- Deduction the slow step contains N2O2 (from two NO) and one H2
Result
- Result rate = k[NO]2[H2], third order overall
Section 19 of 28Identifying the rate-determining step and catalysts
1
Finding the rate-determining step from the rate equation
- Propane bromination in alkali has rate = k[CH3CH2CH3][OH-].
- Only the hydrocarbon and OH- are involved, not bromine, so the rate-determining step is the step containing them, step 1.
2
Identifying a catalyst
- A species in the rate equation but not in the overall equation is a catalyst.
- Butanone halogenation has rate = k[CH3CH2COCH3][H+], and H+ is not in the equation, so it is a catalyst.
- The butanone and H+ are in the rate-determining step as an intermediate formed in that step.
Section 20 of 28Required Practical 7: overview
Required Practical 7: overview
Parts
- Part A is an initial rate method and Part B is a continuous monitoring method
Part A aim
- Part A aim to use an iodine clock to find the order with respect to iodide ions in the reaction of iodide with hydrogen peroxide in acid
Apparatus
- 0.25 mol dm-3 H2SO4, 0.10 mol dm-3 KI, a burette of 0.05 mol dm-3 sodium thiosulfate, 0.10 mol dm-3 H2O2, starch, 50 cm3 burettes with funnel, stand and clamp, white tile, pipette, measuring cylinders, 100 and 250 cm3 beakers, stirrer, timer and deionised water
Section 21 of 28Required Practical 7 Part A: method
1
Rinse and fill the burette with potassium iodide solution.
2
In a clean dry 250 cm3 beaker put 25 cm3 sulfuric acid, 20 cm3 water, 1 cm3 starch, 5.0 cm3 KI and 5.0 cm3 sodium thiosulfate, adding the thiosulfate last.
3
Stir the mixture.
4
Transfer 10.0 cm3 hydrogen peroxide to the beaker and start the timer immediately.
5
Stir and stop the timer when the mixture turns blue-black, which may take several minutes.
6
Record the time to a suitable precision.
7
Empty, rinse with deionised water and dry the beaker.
| Experiment | H2SO4 / cm3 | Starch / cm3 | Water / cm3 | KI / cm3 | Na2S2O3 / cm3 |
|---|---|---|---|---|---|
| 1 | 25 | 1 | 20 | 5.0 | 5.0 |
| 2 | 25 | 1 | 15 | 10.0 | 5.0 |
| 3 | 25 | 1 | 10 | 15.0 | 5.0 |
| 4 | 25 | 1 | 5 | 20.0 | 5.0 |
| 5 | 25 | 1 | 0 | 25.0 | 5.0 |
- Repeat
- experiments 2 to 5 use the same steps with these volumes
Section 22 of 28Required Practical 7 Part A: practical tip and analysis
- Hydrogen peroxide strength
- it is often labelled by volume, with "10 vol" meaning 1 cm3 produces 10 cm3 of oxygen on decomposition (2H2O2 → O2 + 2H2O),
- and 10 vol or 3% is about 0.979 mol dm-3
- it is often labelled by volume, with "10 vol" meaning 1 cm3 produces 10 cm3 of oxygen on decomposition (2H2O2 → O2 + 2H2O),
1
Calculate the concentration of KI in each mixture, such as 5 cm3 of 0.1 mol dm-3 in 250 cm3 giving 0.0005 mol dm-3.
2
Convert the time to a rate, rate = 1 ÷ time.
3
Plot concentration of KI (x) against rate (y).
4
Use the graph to find the order for iodide ions.
Required Practical 7 Part A: practical tip and analysis
Example data
- Example data concentrations 0.015 to 0.075 mol dm-3 give times of 40, 20, 13, 10 and 8 s and rates of 0.025 to 0.120 s-1
Conclusion
- Conclusion the rate is directly proportional to [KI], so the reaction is first order with respect to iodide ions
Section 23 of 28Required Practical 7 Part B: continuous monitoring
Required Practical 7 Part B: continuous monitoring
Aim
- Aim to monitor the reaction of magnesium with hydrochloric acid continuously by gas collection
Apparatus
- 6 cm strips of magnesium, 0.8 mol dm-3 HCl, 50 cm3 measuring cylinder, 100 cm3 conical flask, stand, boss and clamp, a gas syringe with bung and delivery tube (or a water trough with inverted 100 cm3 measuring cylinder), timer and deionised water
Experiment 1
- Put 50 cm3 of 0.8 mol dm-3 HCl in the flask.
- Set up the gas collection equipment.
- Add one 6 cm magnesium strip, fit the bung firmly and start the timer immediately.
- Record the hydrogen volume every 15 seconds for 2.5 minutes.
Experiment 2
- Mix 25 cm3 of 0.8 mol dm-3 HCl with 25 cm3 of water to give 50 cm3 of 0.4 mol dm-3 acid.
- Repeat the same steps with this acid.
Section 24 of 28Practical tip and results table
Magnesium surface
- Magnesium surface if the ribbon is not new and shiny, clean it with sandpaper
Results table
- Results table time every 15 s (0 to 150 s) with the volume of gas produced by 0.8 mol dm-3 HCl and by 0.4 mol dm-3 HCl
Section 25 of 28Evaluation of the results
1
Plot time (x-axis, seconds) against volume of gas (y-axis, cm3).
2
Add a smooth best-fit curve for the 0.8 mol dm-3 results.
3
Draw the tangent at t = 0 s and calculate its gradient, which is the initial rate.
4
Add a smooth best-fit curve for the 0.4 mol dm-3 results.
5
Draw the tangent at t = 0 s and calculate its gradient.
- Comparison
- the two initial rates show the effect of acid concentration on rate
Section 26 of 28Example calculation
Reaction
- Mg(s) + 2HCl(aq) → MgCl2(aq) + H2(g), with acid at 0.5 and 1.0 mol dm-3
Rate equation
- Rate equation rate = volume ÷ time in cm3 s-1
Example
- 18 cm3 in 30 s is 0.6 cm3 s-1, and 12 cm3 in 40 s is 0.3 cm3 s-1
Conclusion
- Conclusion the higher concentration gives the larger initial rate
Section 27 of 28Key terms
| Term | Meaning |
|---|---|
| Rate equation | An expression linking rate to reactant concentrations, rate = k[A]m[B]n. |
| Rate constant | The constant k in the rate equation. |
| Order of reaction | The power of a reactant concentration in the rate equation. |
| Overall order | The sum of the orders of all reactants in the rate equation. |
| Initial rate | The rate at the start of a reaction, at known concentrations. |
| Term | Meaning |
|---|---|
| Arrhenius equation | k = Ae−Ea/RT, linking rate constant, temperature and activation energy. |
| Arrhenius plot | A graph of ln k against 1/T, with gradient −Ea/R. |
| Initial rate | The reaction rate at the start, found from the tangent at t = 0. |
| Zero order | A reaction order in which the rate is independent of concentration. |
| Term | Meaning |
|---|---|
| Mechanism | The sequence of steps by which a reaction occurs. |
| Rate-determining step | The slowest step in a reaction mechanism. |
| Intermediate | A species formed in one step and used up in a later step. |
| Iodine clock | An experiment in which the time for a blue-black colour to appear measures a rate. |
| Continuous monitoring | Measuring a changing quantity throughout a reaction. |
| Term | Meaning |
|---|---|
| Initial rate | The gradient of the tangent to the volume–time graph at t = 0. |
| Tangent | A line touching a curve at a point, with a gradient equal to the rate at that point. |
| Continuous monitoring | Measuring the volume of gas at regular time intervals throughout a reaction. |
| Smooth curve of best fit | A single smooth line drawn through the plotted points. |
Section 28 of 28Exam technique
1
Using the stoichiometric coefficients as orders — orders are found by experiment.
2
Including product concentrations in the rate equation — they do not appear unless they affect the rate.
3
Saying doubling a second-order reactant doubles the rate — it quadruples it.
4
Quoting units of k without checking the overall order — units depend on the order.
1
Reading the order from the wrong graph type — concentration–time and rate–concentration graphs differ in shape.
2
Using a chord instead of a tangent at t = 0 — the initial rate needs a tangent.
3
Taking ln k against T instead of 1/T — the Arrhenius plot uses 1/T.
4
Changing more than one concentration at a time — only one concentration should change.
1
Including zero-order reactants in the rate-determining step — they do not appear in it.
2
Adding the thiosulfate before the other reagents — it must be added last.
3
Taking the time as the rate — rate = 1 ÷ time.
4
Calling a catalyst an intermediate — a catalyst is in the rate equation but not the overall equation, while an intermediate is formed and used in the mechanism.
1
Using the average rate over the whole experiment as the initial rate — use the tangent at t = 0.
2
Using a chord rather than a tangent — it does not give the rate at that moment.
3
Not starting the timer as soon as the bung is fitted — the first readings are lost.
4
Using old, oxidised magnesium — the surface should be cleaned.