2.1.5Variation, Homeostasis and Micro-organisms
Sampling for Abundance and Distribution
5 min read 7 parts Lesson 6 of 51 Unit quiz
Section 1 of 7Why sample?
Abundance
- Abundance Abundance means how many individuals of a species, or how many different species, are present in a habitat.
Distribution
- Distribution Distribution describes where in the habitat a species is found and how that changes from place to place.
Estimating the whole
- Estimating the whole In a large habitat you cannot find and count every organism,
- so you count small sample areas and scale the result up to estimate the total.
Section 2 of 7Making a sample representative
Reliable sampling
Random positions
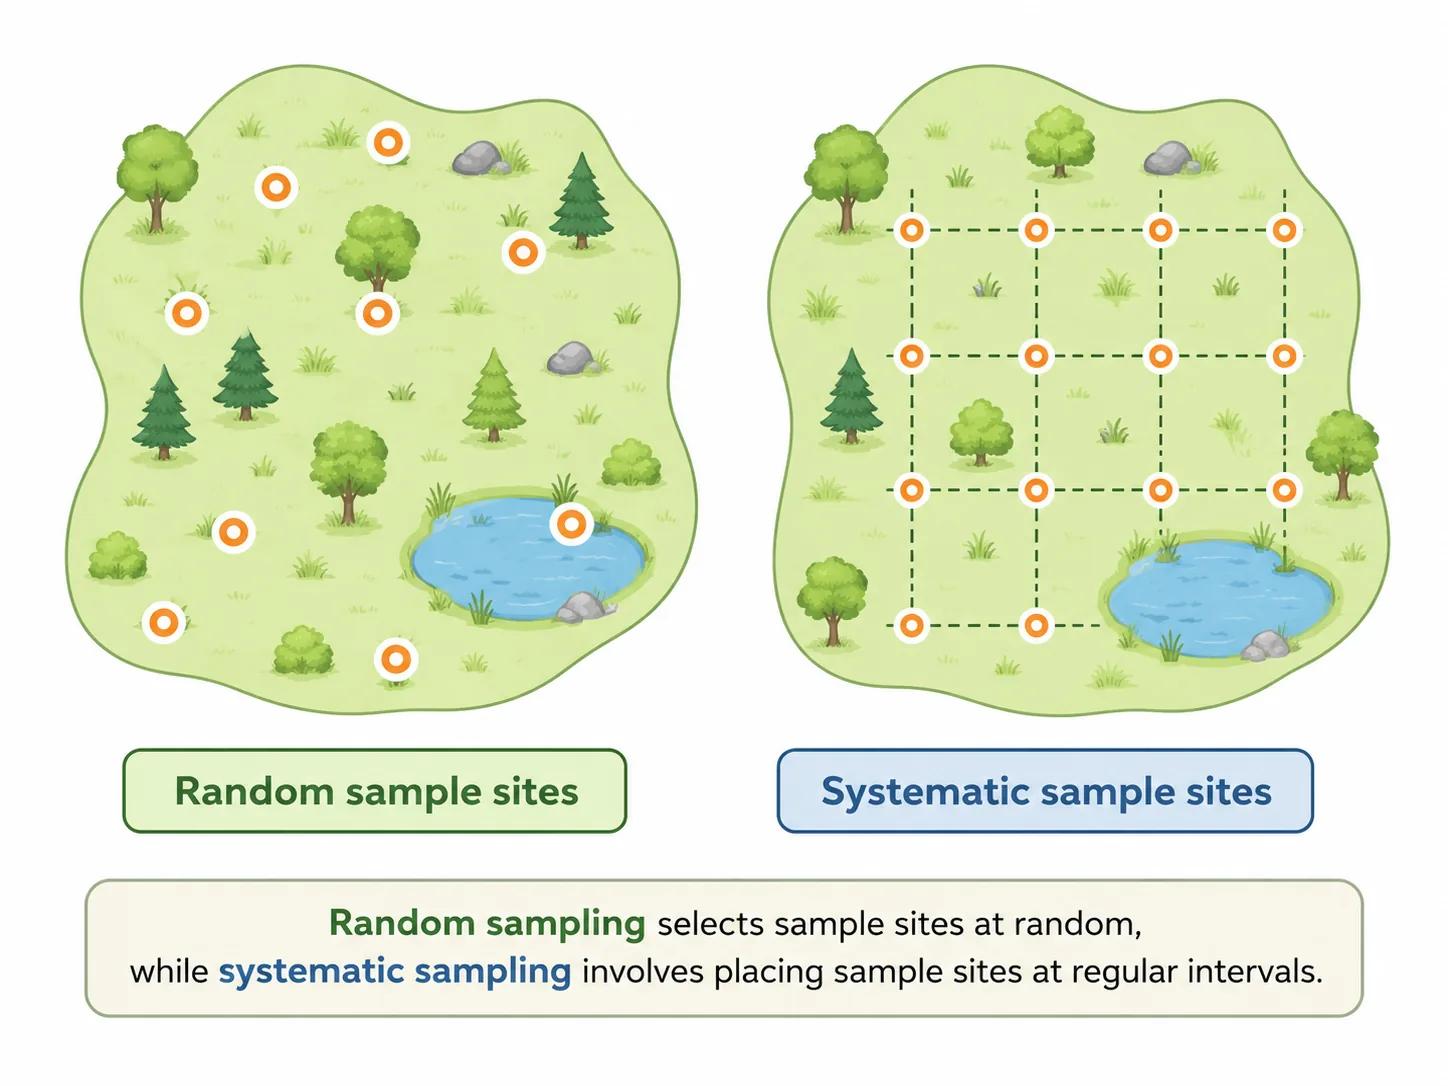
- Random positions Sample sites must be chosen at random, otherwise a student may pick easy or attractive spots and introduce bias.
Enough samples
- Enough samples The more samples taken, the better they represent the whole habitat and the more reliable the estimate.
Suitable quadrat size
- Suitable quadrat size A 1 m2 quadrat suits small plants or limpets, whereas a much larger marked-out area is needed for trees.
Section 3 of 7Random quadrat sampling


1
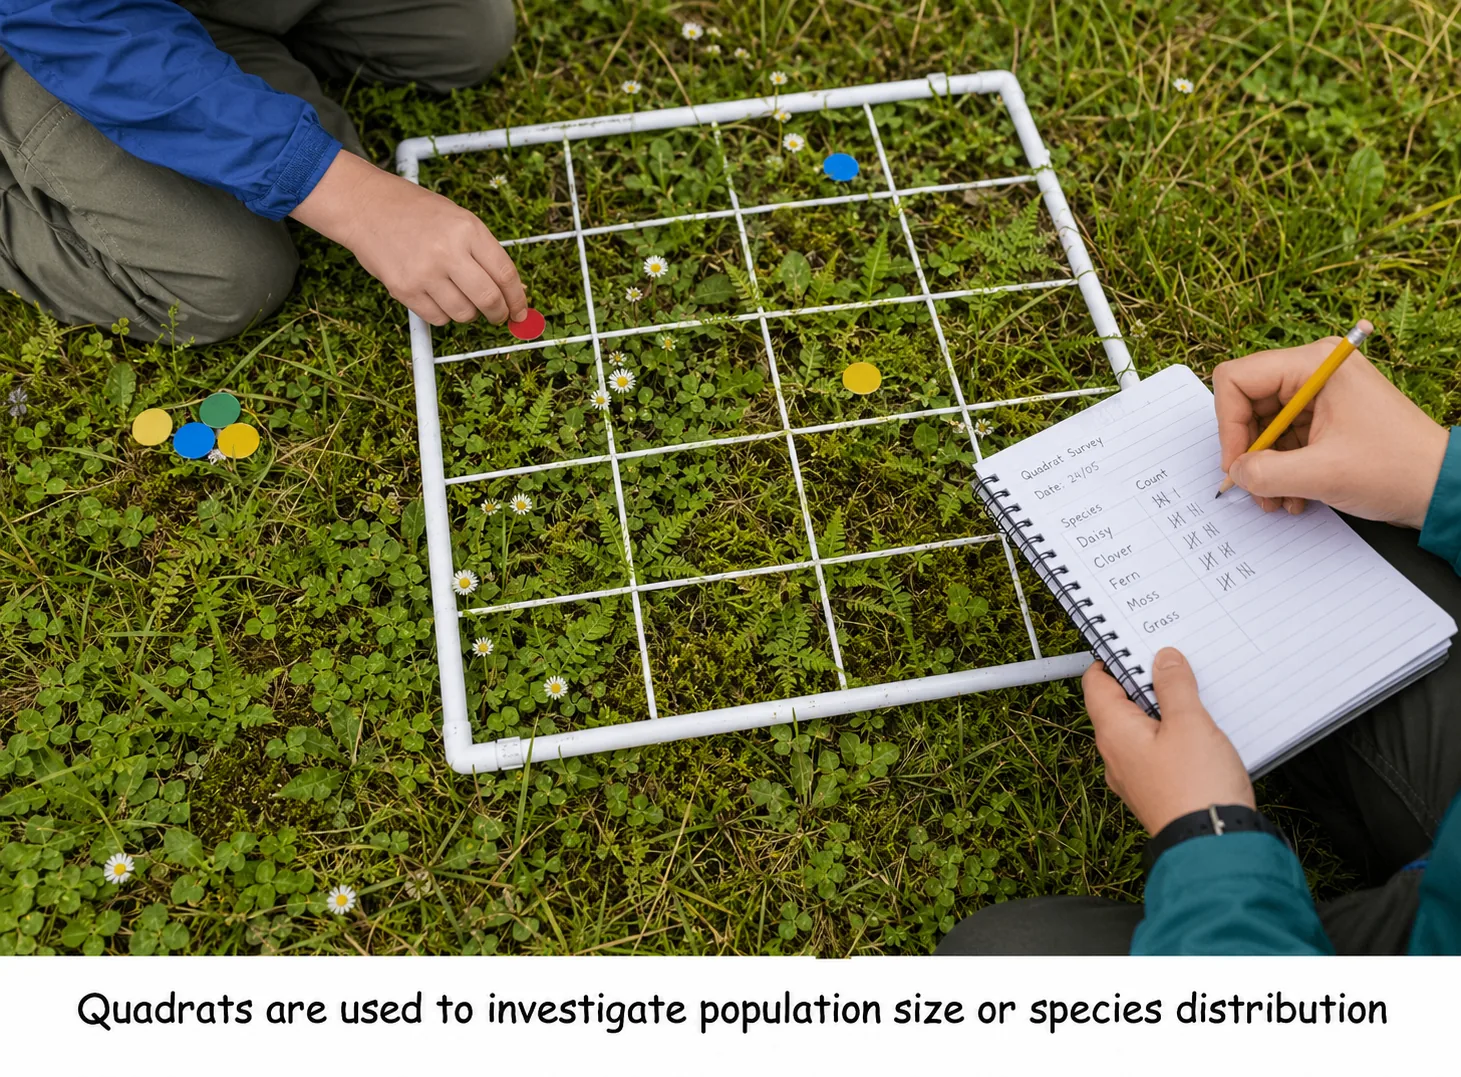
Lay two long tape measures along the edges of the study area at right angles, like the axes of a graph.
2
Use a random number generator to pick two numbers, and use them as coordinates along the tapes.
3
Place the quadrat where the coordinates meet.
4
Record the abundance, for example the number of species, the number of individuals of one species, or the percentage cover of species such as grass.
5
Repeat with new random coordinates many times and calculate a mean per quadrat.
Section 4 of 7Transects for distribution
What a transect is
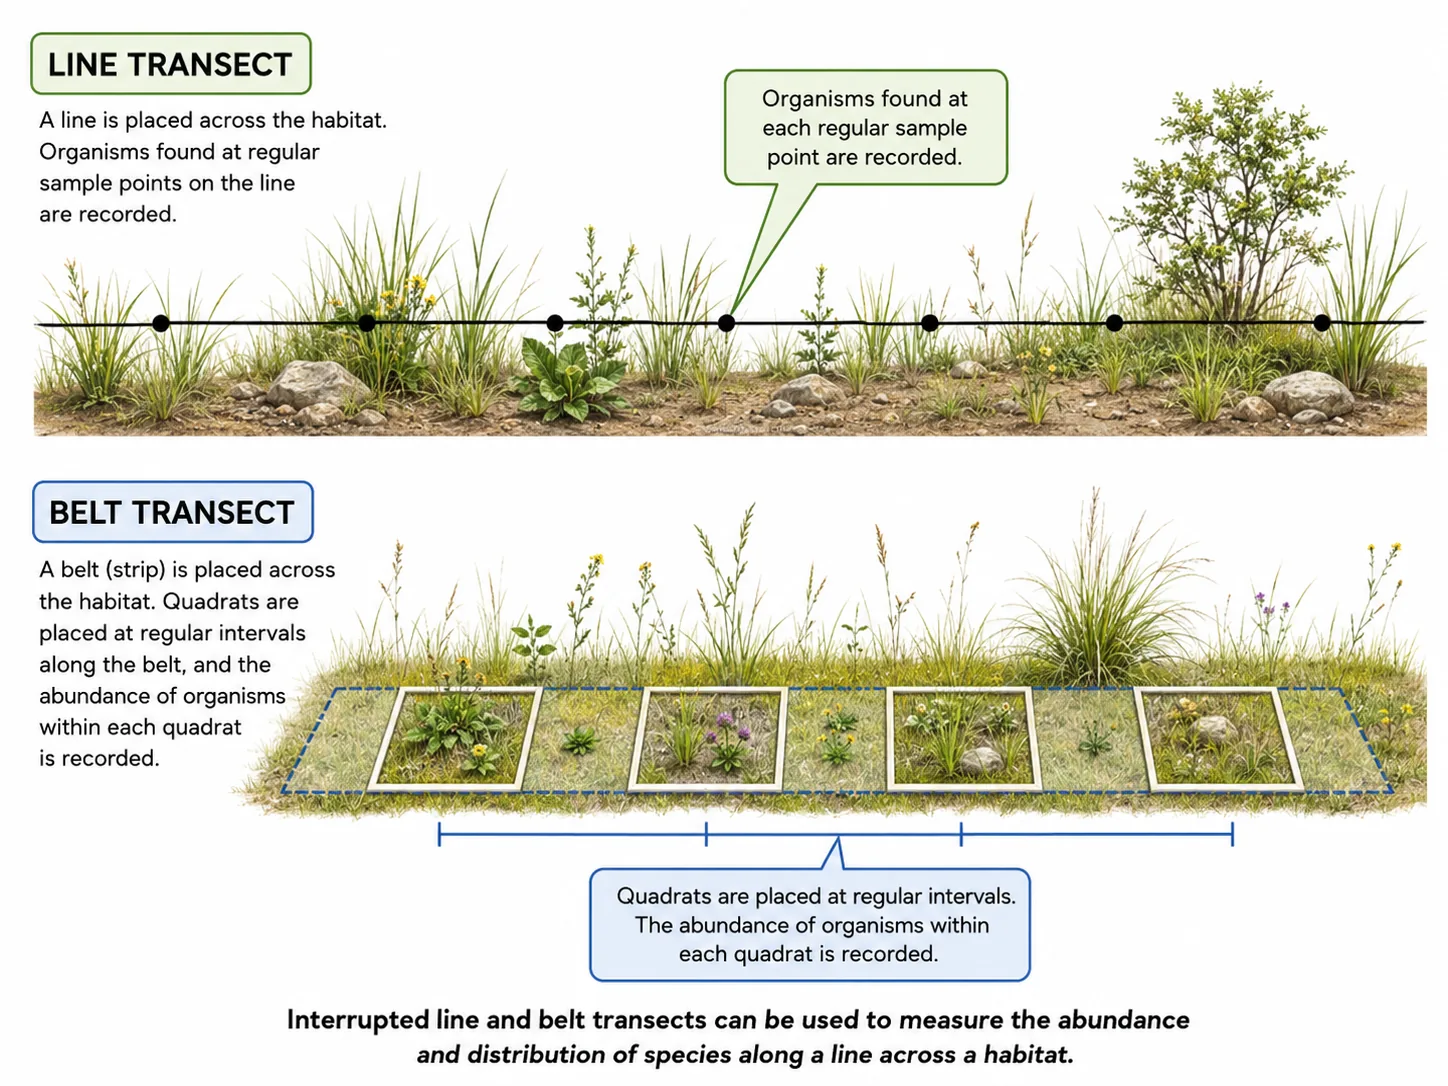
- What a transect is A transect is a line laid across the habitat, along which quadrats are placed at regular intervals.
When to use one
- When to use one Use a transect when conditions change gradually, for example moving away from a hedge, a path or the edge of a pond, or up a seashore.
Interpreting results
- Interpreting results Plotting abundance against distance along the line shows how a factor such as light, moisture or trampling affects where species live.
Section 5 of 7Choosing the method

| Question | Method | Reason |
|---|---|---|
| How many daisies are in the whole field? | Random quadrats | Avoids bias and covers the whole area |
| How do plants change away from a woodland edge? | Transect with quadrats | Samples a gradient in a fixed order |
| Species that are hard to count as individuals | Percentage cover | Grass cannot be counted plant by plant |
Section 6 of 7Key terms
| Term | Meaning |
|---|---|
| Sampling | Collecting data from small parts of a habitat to represent the whole habitat. |
| Quadrat | A square frame of known area placed on the ground to sample organisms. |
| Transect | A line across a habitat along which samples are taken. |
| Bias | A systematic error that makes results unrepresentative, such as choosing sample sites by eye. |
| Percentage cover | The proportion of a quadrat covered by a species, used when individuals cannot be counted. |
Section 7 of 7Exam technique
1
Throwing a quadrat over the shoulder is not truly random; use random number coordinates instead.
2
Taking too few samples and then treating the result as representative of the whole habitat.
3
Using a transect when the question is about total numbers across the habitat; random quadrats are better for that.
4
Counting only the individuals and forgetting that grass and similar plants need percentage cover.