2.5.4Variation, Homeostasis and Micro-organisms
Investigating Factors Affecting Reaction Time
5 min read 7 parts Lesson 34 of 51 Unit quiz
Section 1 of 7What reaction time is
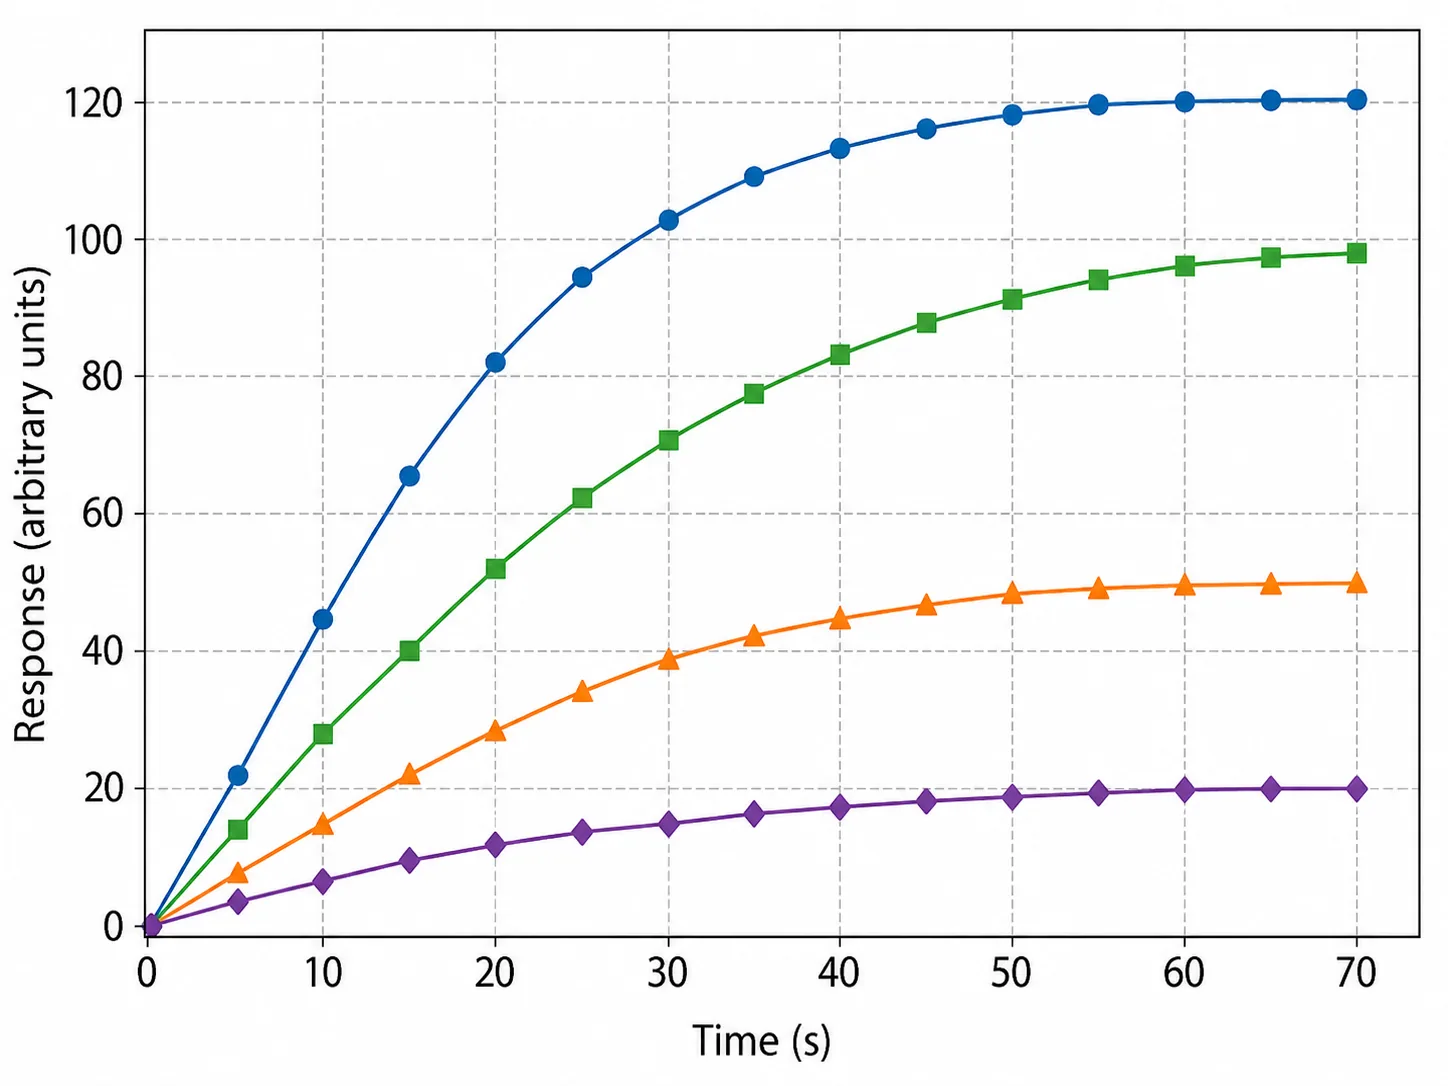
Definition
- Definition Reaction time is the interval between a stimulus being detected and the body making a response.
- For a simple reflex-type task it is usually well under one second.
- The pathway involved is receptor, sensory neurone, coordinator (brain or spinal cord), motor neurone and effector (muscle).
Factors that change it
- Factors that change it Age, tiredness, stress and distraction can all lengthen reaction time.
- Drugs alter the speed of nerve transmission.
- Caffeine is a stimulant and tends to shorten reaction time, whereas alcohol and many sedatives lengthen it.
The hypothesis tested here
- The hypothesis tested here In this practical the hypothesis is that reaction time improves with practice,
- so later attempts should give shorter times than early ones.
- A hypothesis is a testable prediction; the results then support it or fail to support it.
Section 2 of 7The measuring principle
1Ruler is released
- Ruler is released The ruler falls freely from rest, so the longer it falls the further it travels.
2Brain processes the stimulus
- Brain processes the stimulus The volunteer sees it move, and the signal travels through the nervous system to the hand muscles.
3Fingers close
- Fingers close The ruler is caught after a delay. A slow response means the ruler has fallen further.
4Distance gives time
- Distance gives time A bigger catch distance means a longer reaction time.
- A conversion table or the relationship between distance and free-fall time turns centimetres into seconds.
Section 3 of 7Method

1
Seat the volunteer upright with the forearm resting on the table edge and the hand hanging over the edge, so that the arm is supported but the hand is free.
2
Hold a 30 cm ruler vertically so that the 0 cm end is level with the top of the volunteer's open thumb and forefinger, with the ruler between them but not touching.
3
Without warning, let go of the ruler. The volunteer catches it as quickly as possible between thumb and forefinger.
4
Read the number on the ruler level with the top of the thumb. This is the catch distance in centimetres. A smaller number means a faster response.
5
Record five trials for the same volunteer, using the same hand each time, then repeat with at least four more volunteers.
6
Calculate the mean catch distance for each trial number, and use the conversion table to change each mean distance into a reaction time.
Section 4 of 7Variables and apparatus
| Type | Detail | Why it matters |
|---|---|---|
| Independent variable | The person catching the ruler, and the trial number (amount of practice) | This is what is being compared |
| Dependent variable | Reaction time, found from the catch distance on the ruler | This is what is measured |
| Control: hand | Always the dominant hand | Different hands may respond at different speeds |
| Control: ruler | The same ruler, released from the same height, 0 cm end downwards | A different release point would change the distance fallen |
| Control: environment | Same room, same level of distraction, volunteers eyes on the ruler | Distractions lengthen reaction time |
| Apparatus | 30 cm ruler, chair and table, at least five volunteers, results table | Simple equipment keeps the test repeatable |
Section 5 of 7Analysis and evaluation
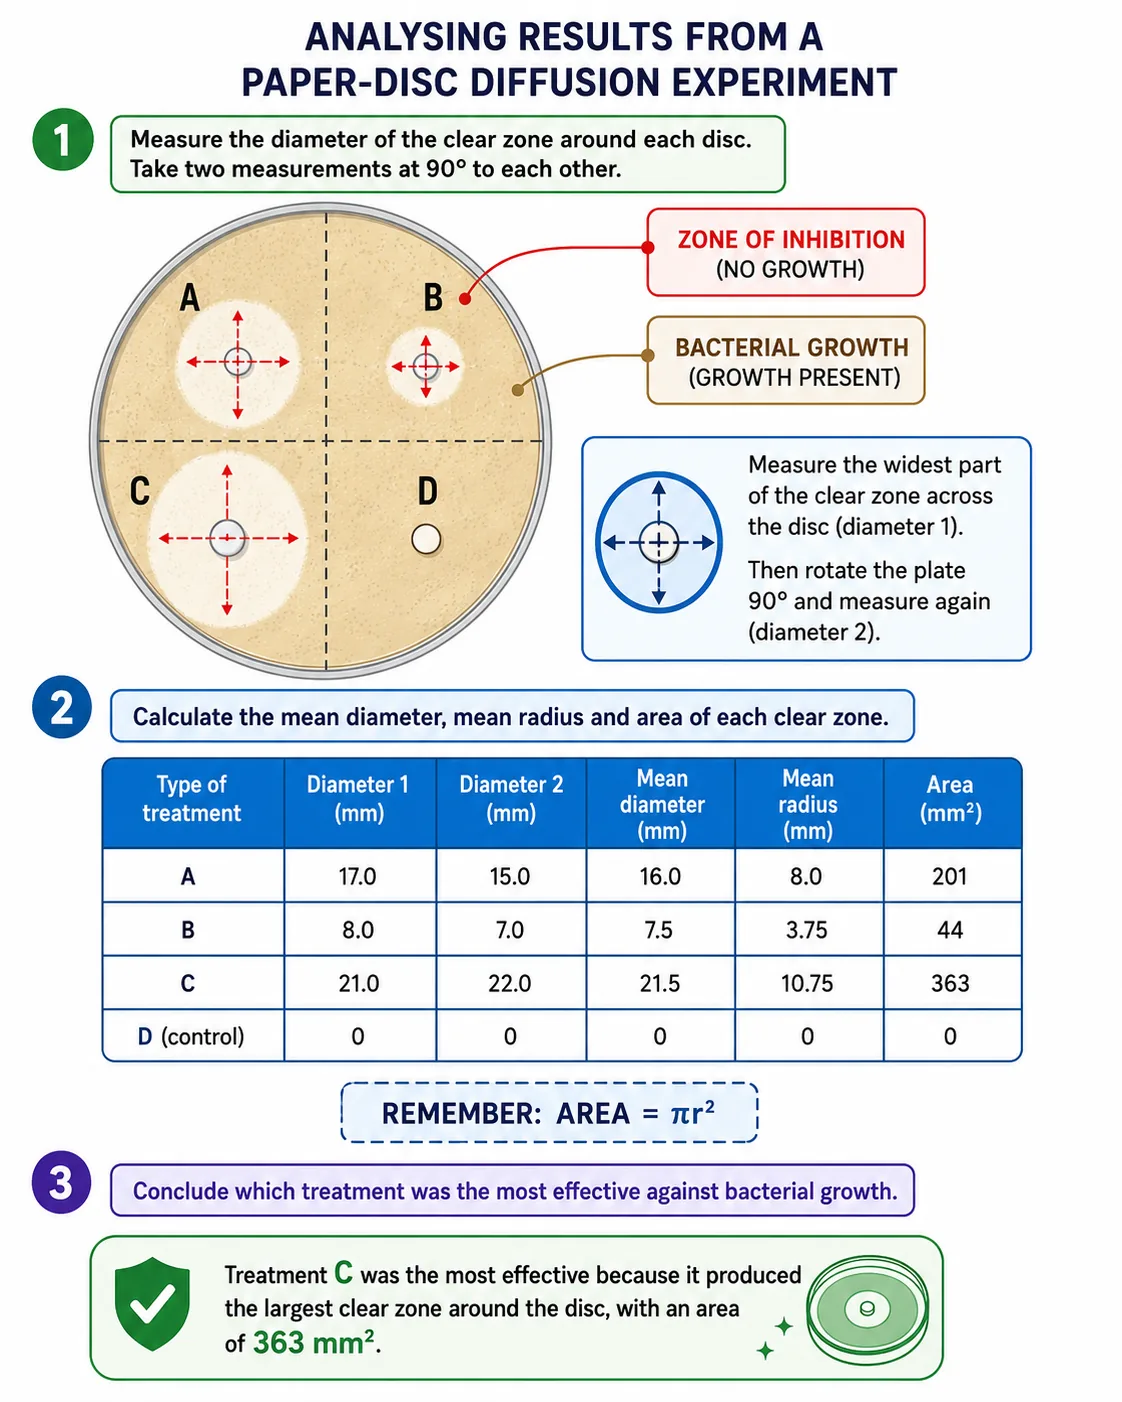
Processing the data
- Processing the data Convert distance to time to translate the data from one form into another.
- Plot the mean reaction time against trial number to see any trend.
- Decide whether the trend supports the hypothesis.
- If times fall as trials increase, practice appears to improve reaction time, but only for this small sample.
Sources of error
- Sources of error It is hard to read exactly where the fingers meet the ruler, and the start position may differ slightly each time.
- A volunteer may anticipate the drop, for example by watching the dropper's hand, which gives an unfairly fast result.
Improvements
- Improvements Use a computer-based test or light gates, which remove human error from timing and can record in milliseconds for greater precision.
- Use more volunteers and more trials, and discard clear anomalies before calculating means.
Section 6 of 7Key terms
| Term | Meaning |
|---|---|
| Reaction time | The time taken to respond to a stimulus after it is detected. |
| Stimulus | A change in the environment that is detected by a receptor, such as the ruler starting to fall. |
| Hypothesis | A testable prediction that an investigation is designed to support or reject. |
| Control variable | A factor kept the same throughout so that it cannot affect the result. |
| Mean | The average value, found by adding the readings and dividing by how many there are. |
| Anomaly | A result that does not fit the pattern of the others and may be due to error. |
Section 7 of 7Exam technique
1
Saying the person who catches the ruler is the dependent variable. The person is the independent variable; reaction time is dependent.
2
Reading the catch distance from the bottom of the ruler rather than at the top of the thumb, which gives the wrong number.
3
Believing a larger ruler reading means a faster response. The further the ruler falls, the slower the reaction.
4
Writing 'human error' as an evaluation point without saying what the error is, such as misjudging the catch position, or how to fix it.
5
Using only one trial per person and treating it as reliable instead of repeating and calculating a mean.