2.4.2Chemical Bonding, Application Of Chemical Reactions and Organic Chemistry
Energy Profiles
5 min read 7 parts Lesson 39 of 54 1 quiz
Section 1 of 7Reading an energy profile
The axes
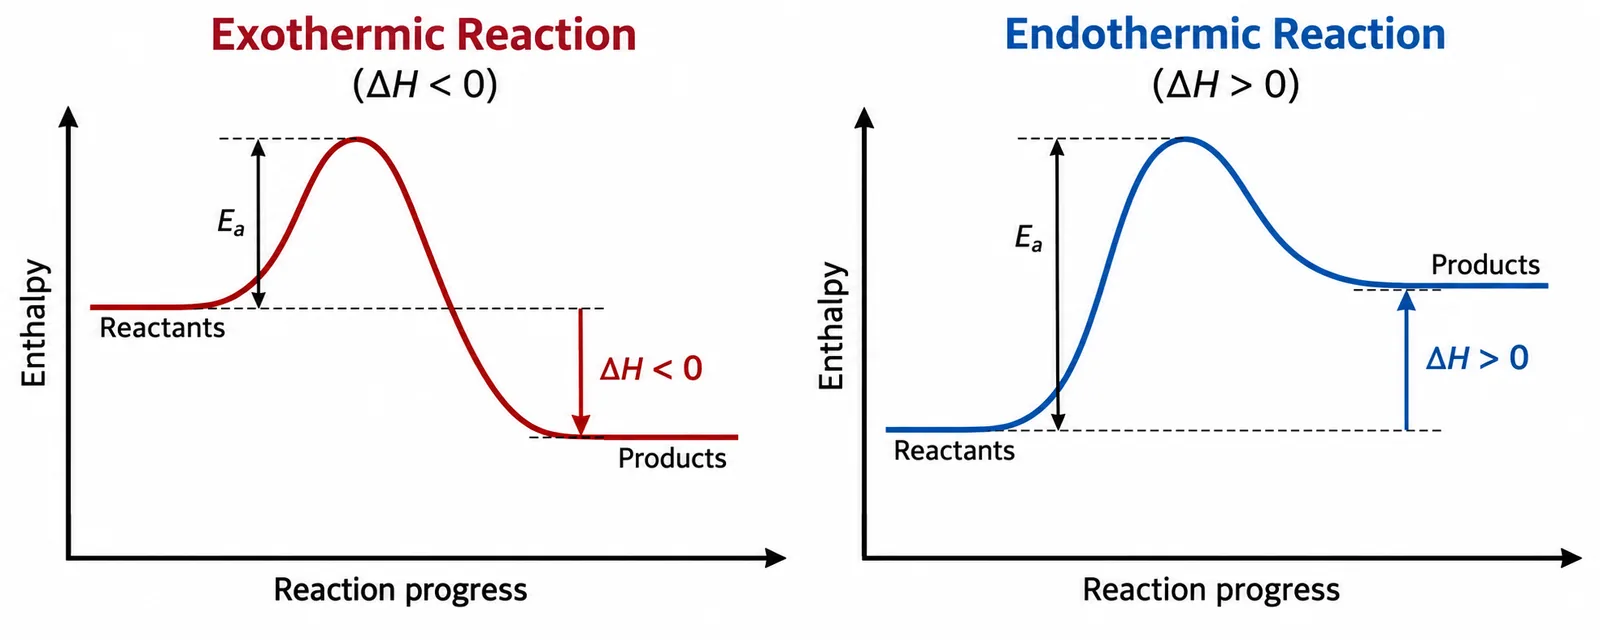
- The axes The vertical axis shows the relative energy of the chemicals.
- The horizontal axis shows the progress of the reaction from reactants on the left to products on the right.
The overall energy change
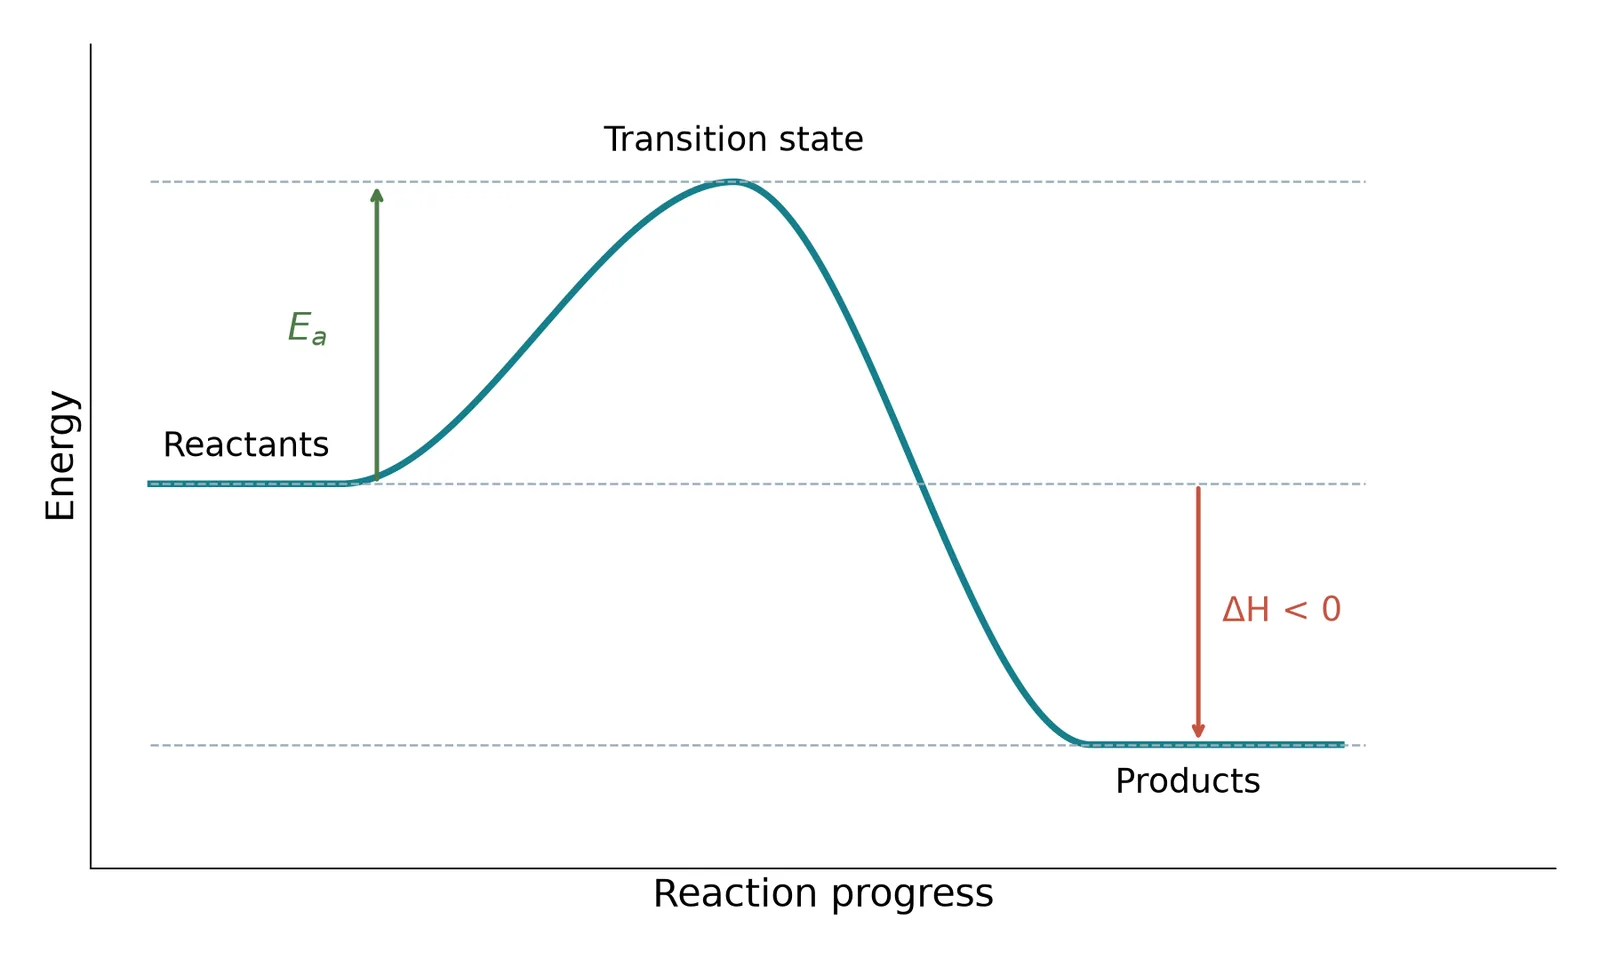
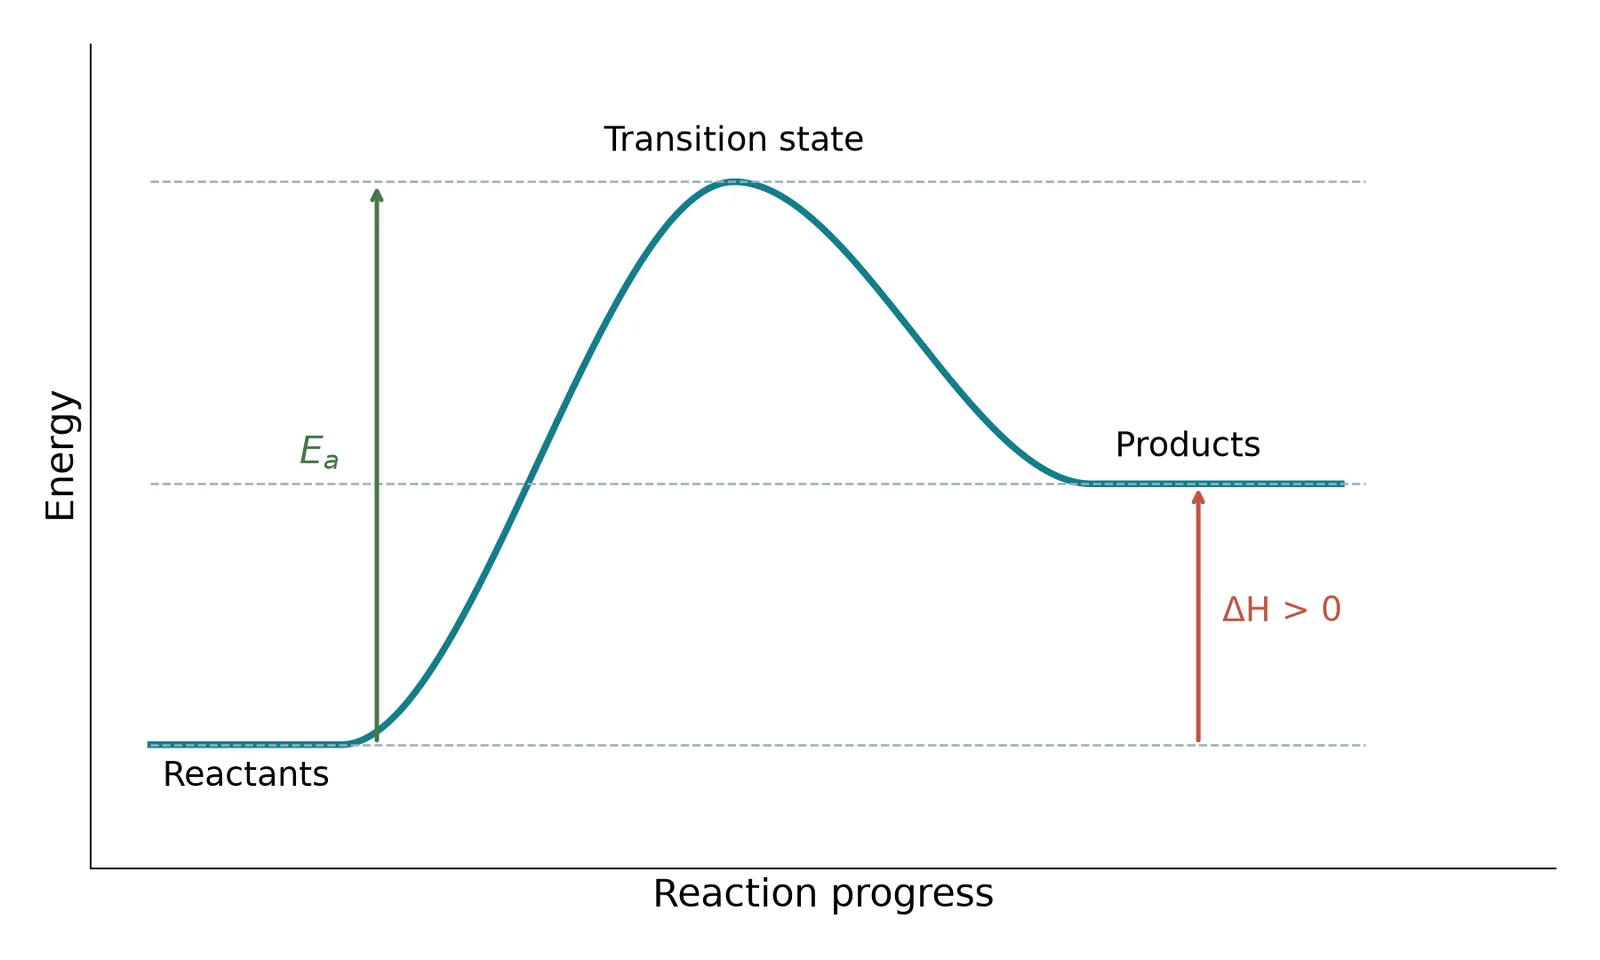
- The overall energy change The vertical gap between the level of the reactants and the level of the products is the overall energy change of the reaction.
- An arrow drawn between the two levels shows its direction: down for energy released, up for energy absorbed.
The curve
- The curve A curve joins reactants to products.
- The rise to the peak of the curve represents the energy barrier that must be crossed first.
Section 2 of 7Exothermic and endothermic reactions


| Feature | Exothermic | Endothermic |
|---|---|---|
| Energy transfer | Energy is given out to the surroundings | Energy is taken in from the surroundings |
| Products compared with reactants | Lower in energy | Higher in energy |
| Sign of the energy change | Negative | Positive |
| Arrow on the profile | Points downwards | Points upwards |
| Temperature of surroundings | Rises | Falls |
Section 3 of 7Activation energy

1Particles collide
- Particles collide For a reaction to happen, particles must first collide with each other.
2Enough energy needed
- Enough energy needed Collisions must have at least a minimum energy, and the particles must meet in the right orientation.
3Bonds are broken
- Bonds are broken This minimum energy, called the activation energy (Ea), is needed to break bonds in the reactants.
4Reaction proceeds
- Reaction proceeds Collisions with at least Ea are successful, so new bonds form and products appear.
Section 4 of 7Drawing a full profile
1
Draw labelled axes: energy on the vertical axis and progress of reaction on the horizontal axis.
2
Draw a horizontal line at the left for the reactants and label it. For an exothermic reaction, draw the products line lower on the right; for an endothermic reaction, draw it higher.
3
Join the two levels with a smooth curve that rises to a peak above the higher of the two levels.
4
Mark the activation energy with an upward arrow from the reactants' level to the top of the peak, and label it Ea.
5
Mark the overall energy change with an arrow from the reactants' level to the products' level, pointing down for exothermic and up for endothermic.
Section 5 of 7Interpreting profiles
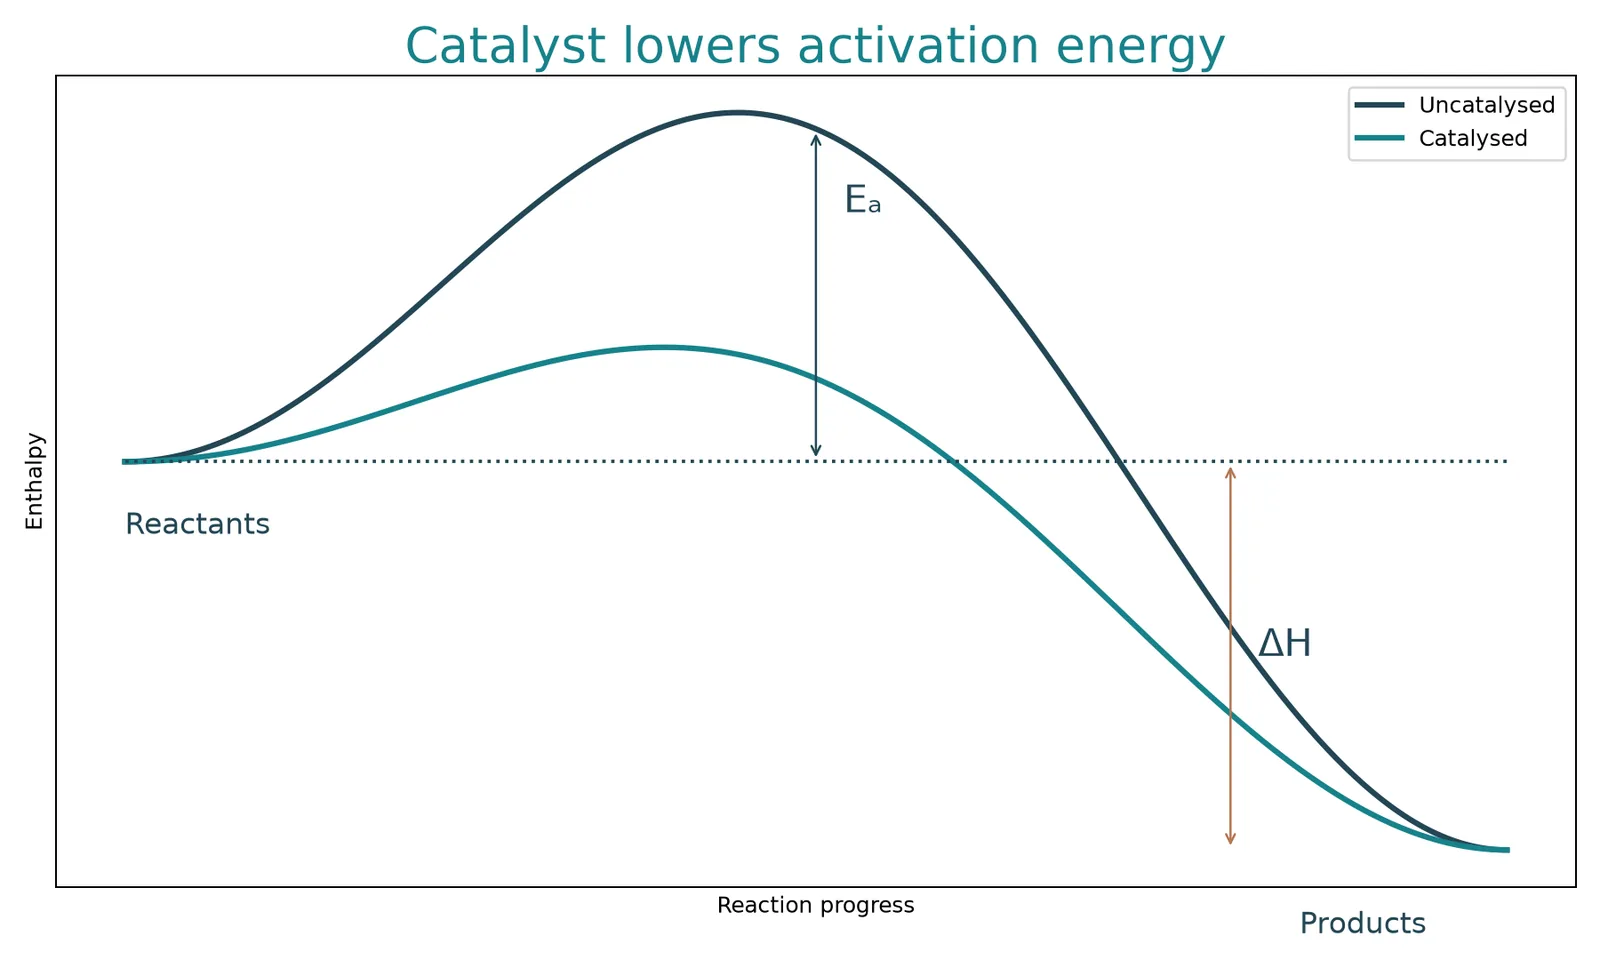
Energy profile
Taller peak
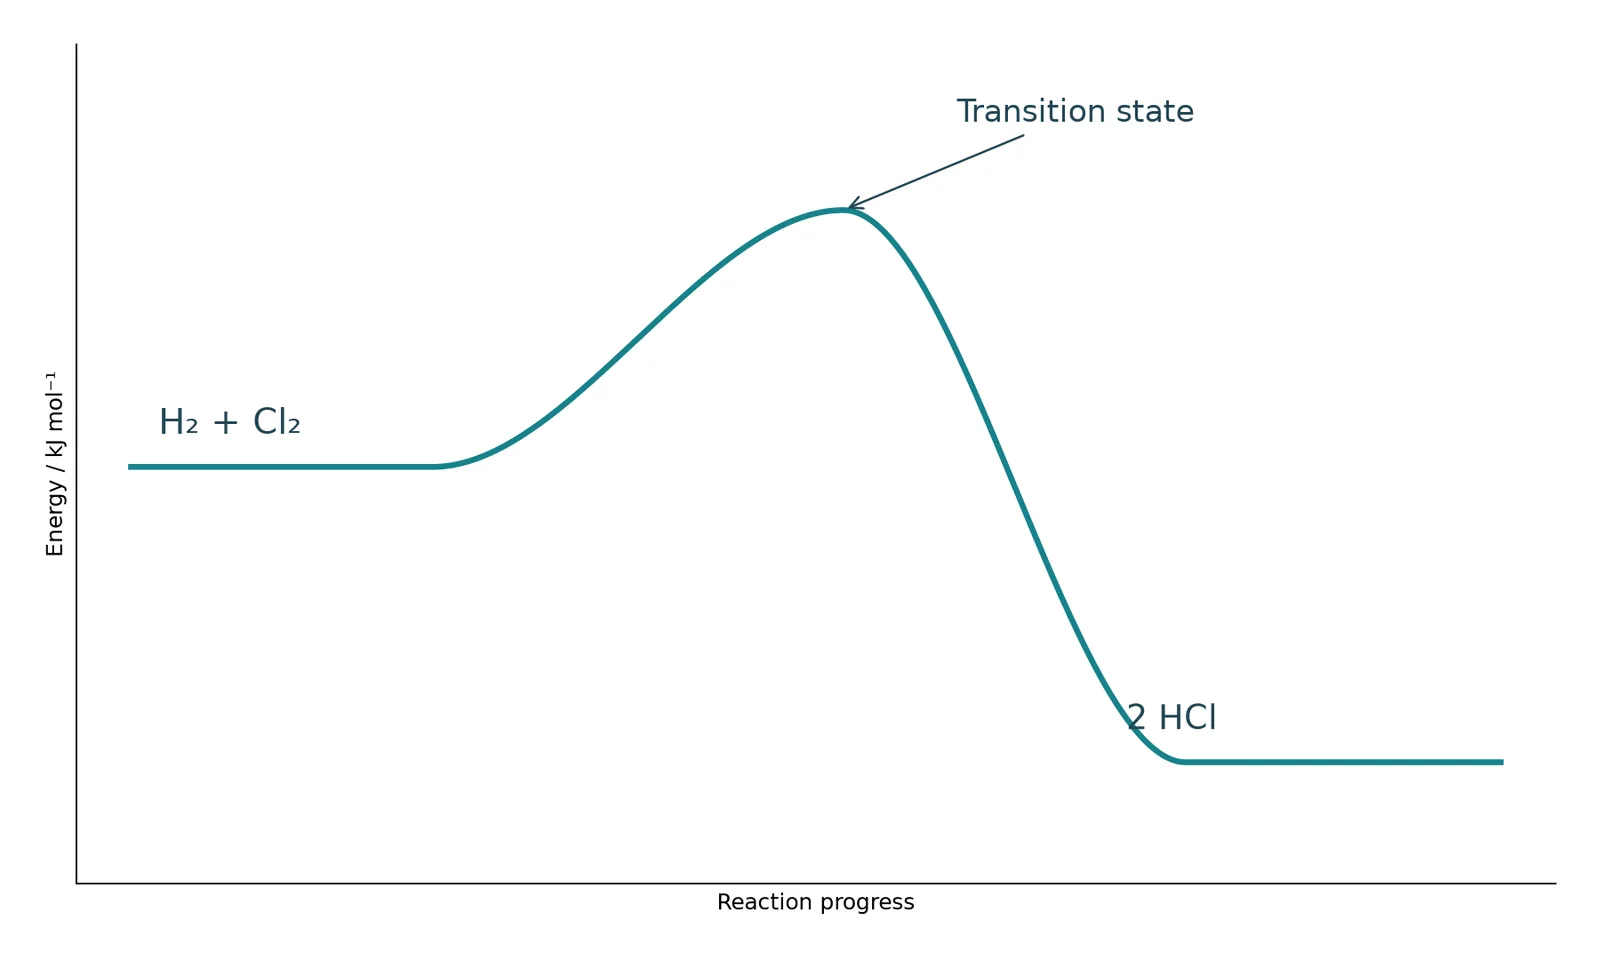
- Taller peak A bigger rise means a higher activation energy, so more energy (for example more heating) is needed to start the reaction.
Every reaction has Ea
- Every reaction has Ea Even exothermic reactions need an initial input of energy to break bonds, so their curves also have a peak.
Identifying the type
- Identifying the type Compare the end level with the start level.
- Lower means exothermic;
- higher means endothermic.
- Lower means exothermic;
Section 6 of 7Key terms
| Term | Meaning |
|---|---|
| Energy profile | A graph showing the relative energy of reactants and products as a reaction progresses. |
| Exothermic | A reaction that transfers energy to the surroundings, so the products have less energy than the reactants. |
| Endothermic | A reaction that takes in energy from the surroundings, so the products have more energy than the reactants. |
| Activation energy | The minimum energy that colliding particles need for a reaction to take place. |
| Overall energy change | The difference in energy between the products and the reactants. |
Section 7 of 7Exam technique
1
Drawing the arrow for the overall energy change from the baseline to the peak: that arrow is the activation energy, not the overall change.
2
Leaving out the activation energy peak on an exothermic profile because the reaction gives out energy.
3
Labelling the axes incorrectly, for example writing 'time' instead of 'progress of reaction'.
4
Saying exothermic reactions have a positive energy change: it is negative because the products have less energy.
5
Starting the activation energy arrow at the bottom of the graph instead of at the level of the reactants.