Curriculum
ACT SCIENCE
ACT Science Overview
0/6
Data Representation
0/7
Research Summaries
0/4
Conflicting Viewpoints
0/4
Required Science Content
0/8
Timed Practice
0/28
-
6.1 Timed Practice Set with Full Explanations
 Preview
-
6.1 Timed Practice Set with Full Explanations - Check yourself
 Preview
-
Princeton Review ACT Science Prep — Chapter 5: Now Passages
Preview
-
Princeton Review ACT Science Prep — Chapter 6: Later Passages
Preview
-
Princeton Review ACT Science Prep — Chapter 7: Science Reading Passages
Preview
-
McGraw-Hill 500 ACT Science Questions — Test 1
Preview
-
McGraw-Hill 500 ACT Science Questions — Test 2
Preview
-
McGraw-Hill 500 ACT Science Questions — Test 3
Preview
-
McGraw-Hill 500 ACT Science Questions — Test 4
Preview
-
McGraw-Hill 500 ACT Science Questions — Test 5
Preview
-
McGraw-Hill 500 ACT Science Questions — Test 6
Preview
-
McGraw-Hill 500 ACT Science Questions — Test 7
Preview
-
McGraw-Hill 500 ACT Science Questions — Test 8
Preview
-
McGraw-Hill 500 ACT Science Questions — Test 9
Preview
-
McGraw-Hill 500 ACT Science Questions — Test 10
Preview
-
McGraw-Hill 500 ACT Science Questions — Test 11
Preview
-
McGraw-Hill 500 ACT Science Questions — Test 12
Preview
-
McGraw-Hill 500 ACT Science Questions — Answers to All Twelve Tests
Preview
-
Princeton Review Aligned ACT Science Practice — Complete Passages, Data & Questions
Preview
-
McGraw-Hill 500 ACT Science Aligned Practice — Complete Passages, Data & Questions
Preview
-
Princeton Review ACT Science Prep — Chapter 8: Science Practice Test 1
Preview
-
Princeton Review ACT Science Prep — Chapter 9: Science Practice Test 1: Answers and Explanations
Preview
-
Princeton Review ACT Science Prep — Chapter 10: Science Practice Test 2
Preview
-
Princeton Review ACT Science Prep — Chapter 11: Science Practice Test 2: Answers and Explanations
Preview
-
Princeton Review ACT Science Prep — Chapter 12: Science Practice Test 3
Preview
-
Princeton Review ACT Science Prep — Chapter 13: Science Practice Test 3: Answers and Explanations
Preview
-
Princeton Review ACT Science Prep — Chapter 14: Science Practice Test 4
Preview
-
Princeton Review ACT Science Prep — Chapter 15: Science Practice Test 4: Answers and Explanations
Preview
Text lesson
Princeton Review ACT Science Prep — Chapter 5: Now Passages
MasterStudy LMS Complete Reference — ACT Science Mastery: Princeton Review ACT Science Prep — Chapter 5: Now Passages.
1Theoretical Principles & Core Foundations2Theoretical Principles & Core Foundations3Theoretical Principles & Core Foundations4Theoretical Principles & Core Foundations5Theoretical Principles & Core Foundations6Theoretical Principles & Core Foundations7Theoretical Principles & Core Foundations8Theoretical Principles & Core Foundations9Theoretical Principles & Core Foundations10Theoretical Principles & Core Foundations11Theoretical Principles & Core Foundations12Theoretical Principles & Core Foundations13Theoretical Principles & Core Foundations
1Mechanisms, Detailed Processes & Governing Concepts2Mechanisms, Detailed Processes & Governing Concepts3Mechanisms, Detailed Processes & Governing Concepts4Mechanisms, Detailed Processes & Governing Concepts5Mechanisms, Detailed Processes & Governing Concepts6Mechanisms, Detailed Processes & Governing Concepts7Mechanisms, Detailed Processes & Governing Concepts8Mechanisms, Detailed Processes & Governing Concepts9Mechanisms, Detailed Processes & Governing Concepts10Mechanisms, Detailed Processes & Governing Concepts11Mechanisms, Detailed Processes & Governing Concepts12Mechanisms, Detailed Processes & Governing Concepts13Mechanisms, Detailed Processes & Governing Concepts14Mechanisms, Detailed Processes & Governing Concepts15Mechanisms, Detailed Processes & Governing Concepts16Mechanisms, Detailed Processes & Governing Concepts17Mechanisms, Detailed Processes & Governing Concepts
Detailed acetylcholine release, receptor binding and recycling at a cholinergic synapse
Mechanisms, Detailed Processes & Governing Concepts
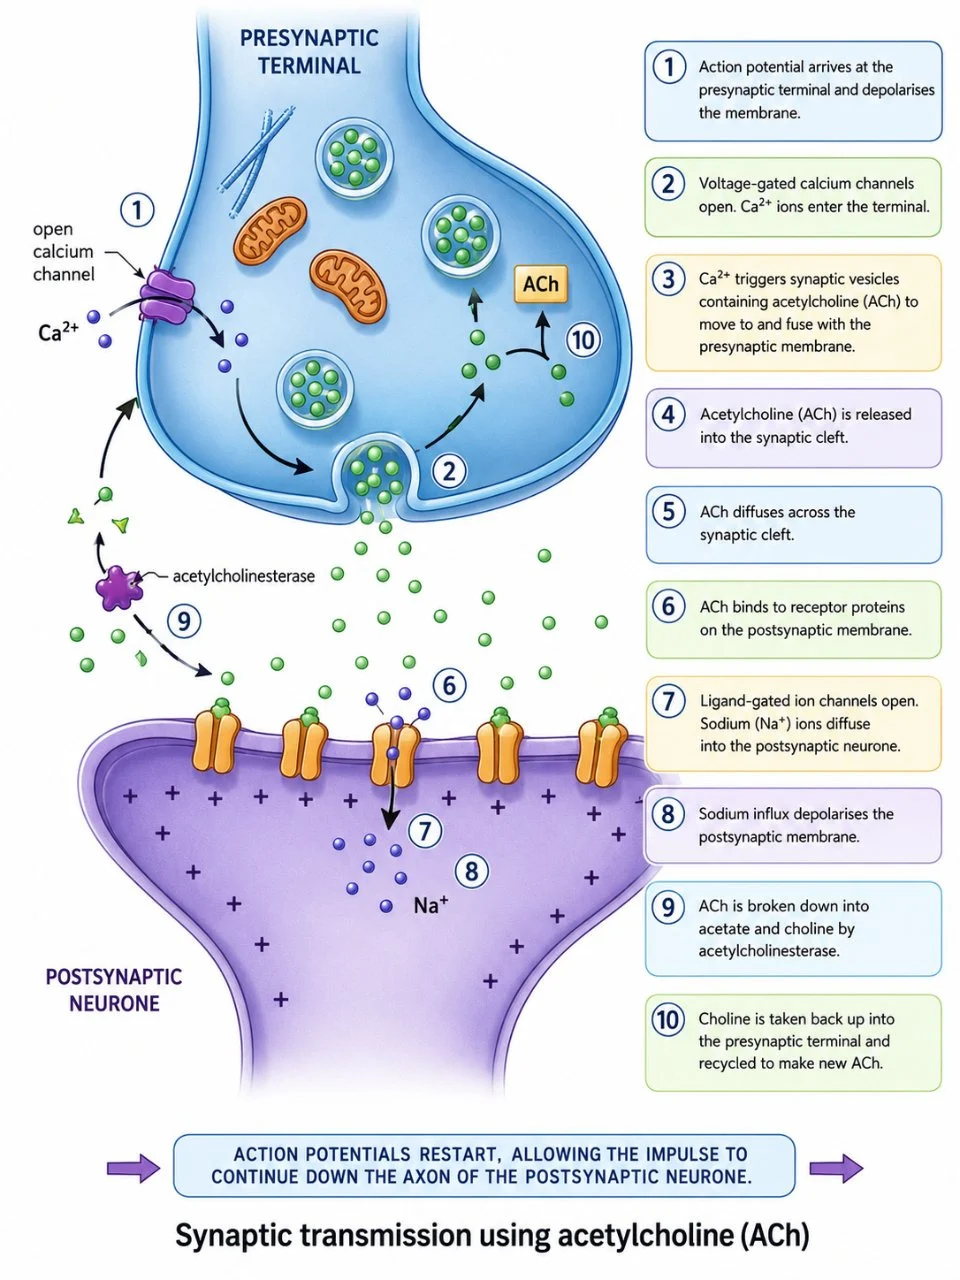 ⤢ Enlarge
1
1
2
A resistor is an object that creates electrical resistance in a circuit.
3
R is the electrical resistance, in ohms (Ω)
which describes the tendency of a resistor to oppose electric conduction.
4
Conductance, G, in siemens (S), is the inverse of R : it describes the tendency of a resistor to allow electric conduction.
5
When a voltage, V, in volts (V), is run across a circuit, R will affect the resulting current, I, measured in amperes (A).
6
2
1 / 17Next ▶
Mechanisms, Detailed Processes & Governing Concepts
Mechanisms, Detailed Processes & Governing Concepts
Students tested several different resistors. For each trial, the students applied a series of voltages across a circuit that contained a resistor and measured the resulting current. The students then calculated the power, P, in watts (W), delivered through the circuit. P is a measure of the rate at which current flows across a circuit.
3
In Trials 1–5, the circuit contained a blue resistor with R = 0.005 Ω. The results are shown in Table 1. Each trial had a different voltage ( V ) across the circuit.
4
Data Table Row(s):
Table 1
◀ Previous2 / 17Next ▶
Mechanisms, Detailed Processes & Governing Concepts
Mechanisms, Detailed Processes & Governing Concepts
Trial | V (V) | I (A) | P (W)
1 2 3 4 5 | 0.02 0.04 0.06 0.08 0.09 | 4 8 12 16 18 | 0.08 0.32 0.72 1.28 1.62
In Trials 6–10, the circuit contained a red resistor with R = 0.015 Ω.
As in Study 1, each trial had a different voltage ( V ) across the circuit.
5
Data Table Row(s): Table 2
Trial | V (V) | I (A) | P (W) 6 7 8 9 10 | 0.02 0.04 0.06 0.08 0.09 | 1.3 2.7 4 5.3 6 | 0.03 0.11 0.24 0.43 0.54
◀ Previous3 / 17Next ▶
Mechanisms, Detailed Processes & Governing Concepts
1
6
2
In Trials 11–15, the circuit contained a green resistor with R = 0.040 Ω. As in the prior studies, each trial had a different voltage ( V ) across the circuit.
3
7
4
Data Table Row(s): Table 3
Trial | V (V) | I (A) | P (W) 11 12 13 14 15 | 0.02 0.04 0.06 0.08 0.09 | 0.5 1 1.5 2 2.2 | 0.01 0.04 0.09 0.16 0.20
5
8
6
1. If an additional trial had been conducted in Study 1 with V = 0.03 V, the value of P for this additional trial would most likely have been:
◀ Previous4 / 17Next ▶
Mechanisms, Detailed Processes & Governing Concepts
1
9
2
A. less than 0.08 watts. B. between 0.08 watts and 0.32 watts. C. between 0.32 watts and 0.72 watts. D. greater than 1.62 watts. 2. In each study, as the voltage across each circuit increased, the electrical power:
3
10
4
F. remained the same.
5
G. varied
but with no general trend. 3. The students then tested two new circuits, Circuit A (with Resistor A) and Circuit B (with Resistor B).
6
The students ran the same voltage across each of the new circuits.
◀ Previous5 / 17Next ▶
Mechanisms, Detailed Processes & Governing Concepts
Mechanisms, Detailed Processes & Governing Concepts
Circuit A exhibited a higher electrical power compared to Circuit B.
Based on Studies 1–3
which resistor has the higher electrical resistance?
11
A. Resistor A
because a higher resistance results in a lower power. B. Resistor Abecause a lower resistance results in a lower power. C. Resistor Bbecause a higher resistance results in a lower power.
12
D. Resistor B
because a lower resistance results in a lower power. 4. In which of the following trials was the conductance ( G ) of the circuit the greatest?
◀ Previous6 / 17Next ▶
Mechanisms, Detailed Processes & Governing Concepts
1
13
2
J.
3
Trials 1, 6, and 11 all have the same conductance.
5.Prior to the studies, 4 students made predictions about which of the 3 resistors, if any, would have the lowest P for a given V.
4
Student L predicted that it would be the blue resistor.
5
Student M predicted that it would be the red resistor.
6
Student N predicted that it would be the green resistor, and Student O predicted that all three resistors would have the same P for a given V.
◀ Previous7 / 17Next ▶
Mechanisms, Detailed Processes & Governing Concepts
1
Which prediction is correct?
2
14
3
6. A student concluded that, for a constant resistance, increasing the value of V by a factor of 3 increases the value of P by a factor of 9. Which pair of trials best supports this conclusion?
4
15
5
7. A fourth resistor, the purple resistor, has a current of 3 A at a voltage of 0.06 V. The resistance of the purple resistor is most likely:
6
16
◀ Previous8 / 17Next ▶
Mechanisms, Detailed Processes & Governing Concepts
Mechanisms, Detailed Processes & Governing Concepts
A. less than 0.005 ohms. B. between 0.005 and 0.015 ohms. C. between 0.015 and 0.040 ohms. D. greater than 0.040 ohms. In 3 studies, students investigated the thermal expansion of rectangular metal rods various lengths and materials (see Figure 1).
17
Using the water bath shown in Figure 2, the students heated the rods to different temperatures. In each trial, the rod was transferred to a water bath preheated to a particular temperature and then allowed to incubate for a set amount of time. During the incubation process, water temperature was kept constant while the metal rods underwent thermal expansion.
18
After completion of the incubation, the metal rod was removed, and the length, width, and height of the metal rod were promptly measured. After being measured, the metal rod returned to room temperature and reverted to its original dimensions.
19
◀ Previous9 / 17Next ▶
Mechanisms, Detailed Processes & Governing Concepts
1
The intrinsic thermal expansion of the metal rod was represented by the volumetric expansion constant, b. In Trials 1–4, students determined the change in volume, D V, for rods of different lengths, L (see Table 1). In every trial, the time of incubation was 30 minutes and the temperature was 80°C.
2
20
3
Data Table Row(s): Table 1
Trial | L (mm) | D V (mm 3 ) 1 | 50 | 1.5 2 | 100 | 3.1 3 | 150 | 4.5 4 | 200 | 5.9 In Trials 5–8, students determined D V for rods of the same L composed of Metals W–Z, respectively.
4
Each metal had a different value of b (see Table 2).
5
In every trial, L = 100 mm, the time of incubation was 30 minutes, and the temperature was 80°C.
6
21
◀ Previous10 / 17Next ▶
Mechanisms, Detailed Processes & Governing Concepts
1
Data Table Row(s): Table 2
Trial | Metal | b (°C -1 ) | D V (mm 3 ) 5 | W | 0.8 | 1.7 6 | X | 1.4 | 3.1 7 | Y | 2.2 | 4.9 8 | Z | 4.6 | 10.2
2
22
3
In Trials 9–12, students determined D V for rods at different temperatures (see Table 3). In every trial, L = 100 mm, and the incubation time was 30 minutes.
4
23
5
Table 3
6
Trial | Temperature (C°) | D V (mm 3 )
◀ Previous11 / 17Next ▶
Mechanisms, Detailed Processes & Governing Concepts
Mechanisms, Detailed Processes & Governing Concepts
9 | 40 | 5.1
10 | 60 | 7.7
11 | 80 | 10.2
12 | 100 | 12.8
1.
If density is defined as mass divided by volume,which of the following is true concerning the change in density of the metal beam after incubation in the water bath?
24
◀ Previous12 / 17Next ▶
Mechanisms, Detailed Processes & Governing Concepts
1
A. Density increases because the volume increases. B. Density decreases because the volume decreases. C. Density increases because the mass increases.
2
25
3
D. Density decreases because the volume increases. 2. If, in Study 3, a trial had been conducted in which the incubation temperature was 70°C, D V would most likely have been closest to which of the following?
4
26
5
3. If the thermal energy contained within the metal rod is proportional to the product of the incubation time and the initial length, in which of the following trials does the rod contain the greatest amount of thermal energy following incubation?
6
27
◀ Previous13 / 17Next ▶
Mechanisms, Detailed Processes & Governing Concepts
1
4. The results of Study 1 are best represented by which of the following graphs? 5. The beam tested in Study 3 was most likely composed of which of the metals tested in Study 2 ?
2
28
3
6. Based on the results of Studies 1 and 2, for a given temperature
which of the following combinations of L and b would yield the greatest thermal expansion?
4
29
5
F.
6
L (mm) : 100, ß (°C –1 ) : 2.2 G.
◀ Previous14 / 17Next ▶
Mechanisms, Detailed Processes & Governing Concepts
Mechanisms, Detailed Processes & Governing Concepts
L (mm) : 100, ß (°C –1 ) : 4.6 H.
L (mm) : 200, ß (°C –1 ) : 2.2 J.
L (mm) : 200, ß (°C –1 ) : 4.6
7. In a new study, Study 4, the conditions of Study 2 were replicated except that the bars used in Study 4 were 20% wider than those used in Study 2.Based on the information in Study 1 and Study 2, how would the values of β and ∆ V in Trials 13–16 of Study 4 compare to those in Trials 5–8, respectively?
30
A. In Trials 13–16, the values of β would be greater than those in Trials 5–8, and the values of ∆ V would be the same as those in Trials 5–8.
31
◀ Previous15 / 17Next ▶
Mechanisms, Detailed Processes & Governing Concepts
1
B. In Trials 13–16, the values of β would be the same as those in Trials 5–8, and the values of ∆ V would be greater than those in Trials 5–8.
2
32
3
C. In Trials 13–16, the values of β and ∆ V would be the same as those in Trials 5–8. D. In Trials 13–16, the values of β and ∆ V would be greater than those in Trials 5–8.
4
33
5
Ethylene glycol is the main ingredient in antifreeze and has the chemical structure shown below: Figures 1–3 show how solutions of antifreeze vary as the concentration of ethylene glycol changes.
6
Concentration is given as the percent ethylene glycol by volume in water (% EG) at atmospheric pressure (101.3 kPa).
◀ Previous16 / 17Next ▶
Mechanisms, Detailed Processes & Governing Concepts
1
Figure 1 shows how the melting point (the temperature at which a solid would begin melting) of antifreeze varies with % EG.
2
Figure 2 shows how the boiling point of antifreeze varies with % EG.
3
34
4
Figure 3 shows how the density at 25°C varies with % EG.
◀ Previous17 / 17
1Key Experimental Procedures & Practical Investigations2Key Experimental Procedures & Practical Investigations3Key Experimental Procedures & Practical Investigations4Key Experimental Procedures & Practical Investigations5Key Experimental Procedures & Practical Investigations6Key Experimental Procedures & Practical Investigations7Key Experimental Procedures & Practical Investigations8Key Experimental Procedures & Practical Investigations9Key Experimental Procedures & Practical Investigations10Key Experimental Procedures & Practical Investigations11Key Experimental Procedures & Practical Investigations12Key Experimental Procedures & Practical Investigations13Key Experimental Procedures & Practical Investigations14Key Experimental Procedures & Practical Investigations
1Analytical Data, Comparative Structures & Scientific Framewo2Analytical Data, Comparative Structures & Scientific Framewo3Analytical Data, Comparative Structures & Scientific Framewo4Analytical Data, Comparative Structures & Scientific Framewo5Analytical Data, Comparative Structures & Scientific Framewo6Analytical Data, Comparative Structures & Scientific Framewo7Analytical Data, Comparative Structures & Scientific Framewo8Analytical Data, Comparative Structures & Scientific Framewo9Analytical Data, Comparative Structures & Scientific Framewo10Analytical Data, Comparative Structures & Scientific Framewo11Analytical Data, Comparative Structures & Scientific Framewo12Analytical Data, Comparative Structures & Scientific Framewo13Analytical Data, Comparative Structures & Scientific Framewo14Analytical Data, Comparative Structures & Scientific Framewo15Analytical Data, Comparative Structures & Scientific Framewo16Analytical Data, Comparative Structures & Scientific Framewo17Analytical Data, Comparative Structures & Scientific Framewo18Analytical Data, Comparative Structures & Scientific Framewo19Analytical Data, Comparative Structures & Scientific Framewo20Analytical Data, Comparative Structures & Scientific Framewo21Analytical Data, Comparative Structures & Scientific Framewo22Analytical Data, Comparative Structures & Scientific Framewo23Analytical Data, Comparative Structures & Scientific Framewo24Analytical Data, Comparative Structures & Scientific Framewo25Analytical Data, Comparative Structures & Scientific Framewo
1Comprehensive Problem Solving & Synoptic Evaluation2Comprehensive Problem Solving & Synoptic Evaluation3Comprehensive Problem Solving & Synoptic Evaluation4Comprehensive Problem Solving & Synoptic Evaluation5Comprehensive Problem Solving & Synoptic Evaluation6Comprehensive Problem Solving & Synoptic Evaluation7Comprehensive Problem Solving & Synoptic Evaluation8Comprehensive Problem Solving & Synoptic Evaluation9Comprehensive Problem Solving & Synoptic Evaluation10Comprehensive Problem Solving & Synoptic Evaluation11Comprehensive Problem Solving & Synoptic Evaluation12Comprehensive Problem Solving & Synoptic Evaluation13Comprehensive Problem Solving & Synoptic Evaluation14Comprehensive Problem Solving & Synoptic Evaluation15Comprehensive Problem Solving & Synoptic Evaluation16Comprehensive Problem Solving & Synoptic Evaluation17Comprehensive Problem Solving & Synoptic Evaluation18Comprehensive Problem Solving & Synoptic Evaluation19Comprehensive Problem Solving & Synoptic Evaluation20Comprehensive Problem Solving & Synoptic Evaluation21Comprehensive Problem Solving & Synoptic Evaluation22Comprehensive Problem Solving & Synoptic Evaluation23Comprehensive Problem Solving & Synoptic Evaluation24Comprehensive Problem Solving & Synoptic Evaluation25Comprehensive Problem Solving & Synoptic Evaluation