Curriculum
ACT SCIENCE
ACT Science Overview
0/6
Data Representation
0/7
Research Summaries
0/4
Conflicting Viewpoints
0/4
Required Science Content
0/8
Timed Practice
0/28
-
6.1 Timed Practice Set with Full Explanations
 Preview
-
6.1 Timed Practice Set with Full Explanations - Check yourself
 Preview
-
Princeton Review ACT Science Prep — Chapter 5: Now Passages
Preview
-
Princeton Review ACT Science Prep — Chapter 6: Later Passages
Preview
-
Princeton Review ACT Science Prep — Chapter 7: Science Reading Passages
Preview
-
McGraw-Hill 500 ACT Science Questions — Test 1
Preview
-
McGraw-Hill 500 ACT Science Questions — Test 2
Preview
-
McGraw-Hill 500 ACT Science Questions — Test 3
Preview
-
McGraw-Hill 500 ACT Science Questions — Test 4
Preview
-
McGraw-Hill 500 ACT Science Questions — Test 5
Preview
-
McGraw-Hill 500 ACT Science Questions — Test 6
Preview
-
McGraw-Hill 500 ACT Science Questions — Test 7
Preview
-
McGraw-Hill 500 ACT Science Questions — Test 8
Preview
-
McGraw-Hill 500 ACT Science Questions — Test 9
Preview
-
McGraw-Hill 500 ACT Science Questions — Test 10
Preview
-
McGraw-Hill 500 ACT Science Questions — Test 11
Preview
-
McGraw-Hill 500 ACT Science Questions — Test 12
Preview
-
McGraw-Hill 500 ACT Science Questions — Answers to All Twelve Tests
Preview
-
Princeton Review Aligned ACT Science Practice — Complete Passages, Data & Questions
Preview
-
McGraw-Hill 500 ACT Science Aligned Practice — Complete Passages, Data & Questions
Preview
-
Princeton Review ACT Science Prep — Chapter 8: Science Practice Test 1
Preview
-
Princeton Review ACT Science Prep — Chapter 9: Science Practice Test 1: Answers and Explanations
Preview
-
Princeton Review ACT Science Prep — Chapter 10: Science Practice Test 2
Preview
-
Princeton Review ACT Science Prep — Chapter 11: Science Practice Test 2: Answers and Explanations
Preview
-
Princeton Review ACT Science Prep — Chapter 12: Science Practice Test 3
Preview
-
Princeton Review ACT Science Prep — Chapter 13: Science Practice Test 3: Answers and Explanations
Preview
-
Princeton Review ACT Science Prep — Chapter 14: Science Practice Test 4
Preview
-
Princeton Review ACT Science Prep — Chapter 15: Science Practice Test 4: Answers and Explanations
Preview
Text lesson
Princeton Review ACT Science Prep — Chapter 6: Later Passages
MasterStudy LMS Complete Reference — ACT Science Mastery: Princeton Review ACT Science Prep — Chapter 6: Later Passages.
1Theoretical Principles & Core Foundations2Theoretical Principles & Core Foundations3Theoretical Principles & Core Foundations4Theoretical Principles & Core Foundations5Theoretical Principles & Core Foundations6Theoretical Principles & Core Foundations7Theoretical Principles & Core Foundations8Theoretical Principles & Core Foundations9Theoretical Principles & Core Foundations10Theoretical Principles & Core Foundations11Theoretical Principles & Core Foundations12Theoretical Principles & Core Foundations13Theoretical Principles & Core Foundations14Theoretical Principles & Core Foundations15Theoretical Principles & Core Foundations
1Mechanisms, Detailed Processes & Governing Concepts2Mechanisms, Detailed Processes & Governing Concepts3Mechanisms, Detailed Processes & Governing Concepts4Mechanisms, Detailed Processes & Governing Concepts5Mechanisms, Detailed Processes & Governing Concepts6Mechanisms, Detailed Processes & Governing Concepts7Mechanisms, Detailed Processes & Governing Concepts8Mechanisms, Detailed Processes & Governing Concepts9Mechanisms, Detailed Processes & Governing Concepts10Mechanisms, Detailed Processes & Governing Concepts11Mechanisms, Detailed Processes & Governing Concepts12Mechanisms, Detailed Processes & Governing Concepts13Mechanisms, Detailed Processes & Governing Concepts14Mechanisms, Detailed Processes & Governing Concepts
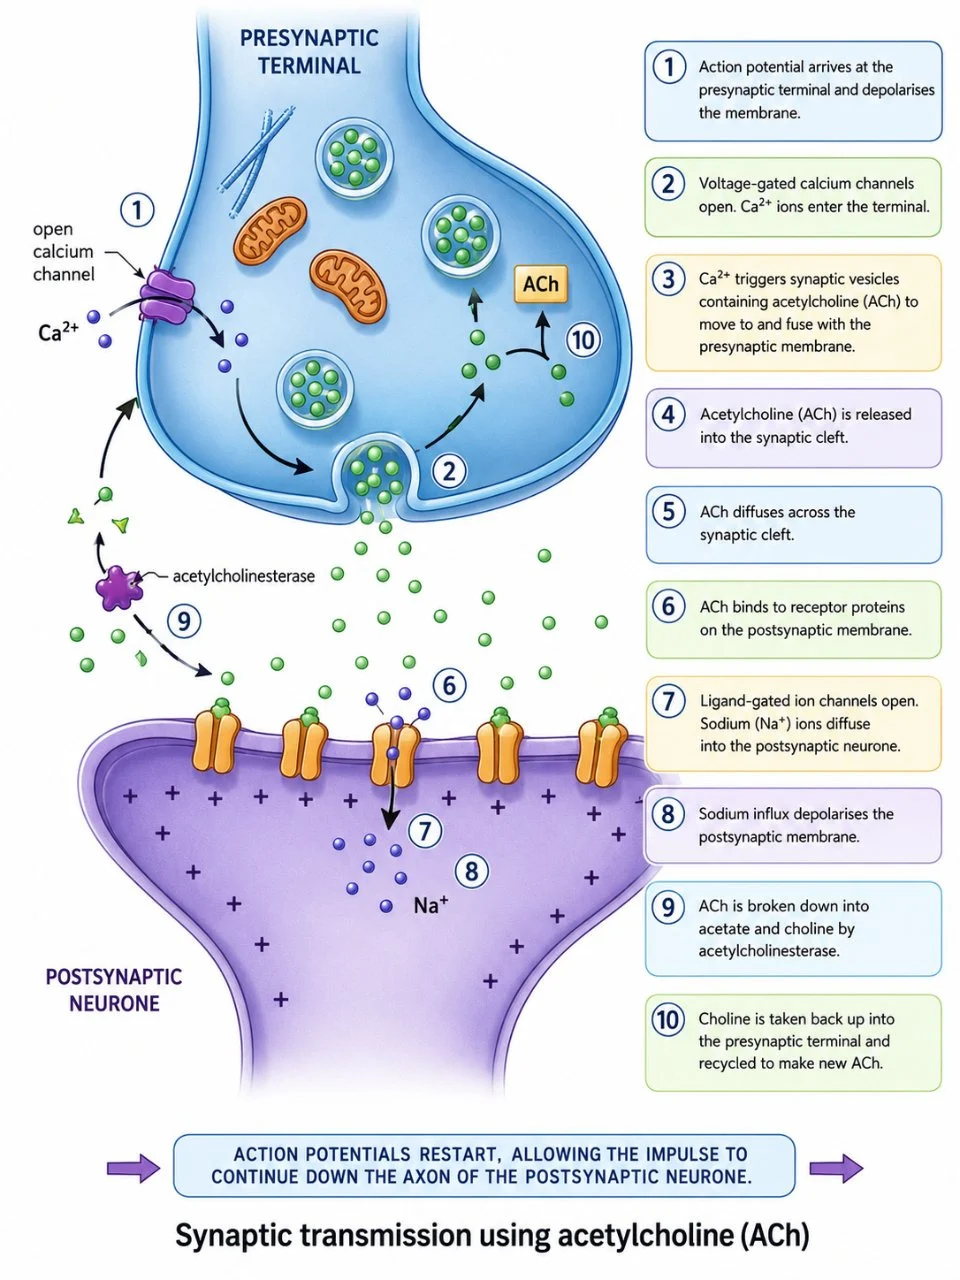
Detailed acetylcholine release, receptor binding and recycling at a cholinergic synapse
Mechanisms, Detailed Processes & Governing Concepts
 ⤢ Enlarge
Mechanisms, Detailed Processes & Governing Concepts
1
A. the nutrient growth media with strains that were lab generated. B. the agar plates with strains that were lab generated. C. both the nutrient growth media and agar plates with strains that were lab generated.
2
D. both the nutrient growth media and agar plates with strains that were not lab generated. 6. Which of the colonies shown in Figure 2 did NOT grow in the presence of ampicillin?
3
J. None of the strains 7. One of the laboratory technicians was hospitalized for an E. coli infection. The infection did not respond to penicillin or tetracycline
but improved after treatment with ampicillin. The technician was most likely infected with:
1 / 14Next ▶
Mechanisms, Detailed Processes & Governing Concepts
1
4
2
The pesticides propargyl bromide (PBr) and 1,3-dichloropropene (1,3-D) are removed from the soil by a variety of factors, including uptake by plants, adsorption by soil, and breakdown by microorganisms, such as those found in manure. Also, PBr can degrade into propargyl alcohol.
3
5
4
Three pairs of pesticide-free soil samples were collected for a study: heavily manure-amended (H1, H2), slightly manure-amended (S1, S2), and unamended (U1, U2), as described in Table
5
1.
On day 1, PBr was added to H1, S1,and U1 and 1,3-D was added to H2, S2,and U2 to produce an initial pesticide concentration of 500 mg/L in each soil sample.
6
PBr, propargyl alcohol, and 1,3-D concentrations in the soil were measured at intervals over the next 12 weeks (see Figures 1–3).
◀ Previous2 / 14Next ▶
Mechanisms, Detailed Processes & Governing Concepts
1
6
2
Data Table Row(s): Table 1
Soil | Description of soilHeavily manure-amended (H1, H2)Slightly manure-amended (S1, S2)Unamended (U1, U2)
3
7
4
1. Assume that the environmental factors (ultraviolet radiation, wind drift, temperature, and moisture) for each soil sample remained constant over the 12 weeks of the study. According to Figure 2, 12 weeks after 1,3-D was added, what percent of the original 1,3-D concentration remained in the soil in U2 ?
5
8
6
B. Between 10% and 30% C. Between 30% and 50% 2. According to Figure 1, 5 weeks after PBr was added, the concentration in the soil in S1 compared to its concentration in H1 was about:
◀ Previous3 / 14Next ▶
Mechanisms, Detailed Processes & Governing Concepts
Mechanisms, Detailed Processes & Governing Concepts
9
3. According to Figures 1 and 3, as the PBr concentration in S1 decreased, the propargyl alcohol concentration: B. decreased
then increased.
10
D. increased
then decreased. 4. Is the statement ‘Over the 12 weeks of the study, PBr concentration was most reduced in the unamended soil sample’ supported by the data in Figure 1 ?
11
F. Yes
12 weeks after PBr was added, its concentration was least in U1. G. Yes12 weeks after PBr was added, its concentration was least in H1.
◀ Previous4 / 14Next ▶
Mechanisms, Detailed Processes & Governing Concepts
1
12
2
H. No
12 weeks after PBr was added, its concentration was least in U1. J. No12 weeks after PBr was added, its concentration was least in H1.
3
13
4
5. As shown in Figure 2, every time the 1,3-D concentrations in the soil in H2, S2, and U2 were measured during the study, the concentrations in S2 and H2 were found to be very similar to the concentration in U2. The most likely explanation for this is that in S2 and H2:
5
14
6
A. adsorption onto soil particles and plant uptake played a more significant role in removing 1,3-D than did breakdown to form PBr. B. adsorption onto soil particles and plant uptake played a less significant role in removing 1,3-D than did breakdown to form PBr.
◀ Previous5 / 14Next ▶
Mechanisms, Detailed Processes & Governing Concepts
Mechanisms, Detailed Processes & Governing Concepts
15
C. bacterial decomposition played a more significant role in removing 1,3-D than did adsorption onto soil particles and plant uptake. D. bacterial decomposition played a less significant role in removing 1,3-D than did adsorption onto soil particles and plant uptake.
16
6. After two weeks, in which soil was the concentration of PBr reduced the least and in which soil was the concentration of 1,3-D reduced the least?
17
F.
◀ Previous6 / 14Next ▶
Mechanisms, Detailed Processes & Governing Concepts
Mechanisms, Detailed Processes & Governing Concepts
PBr : U1, 1,3-D : S2 G.
PBr : H1, 1,3-D : H2 H.
PBr : U1, 1,3-D : U2 J.
PBr : S1, 1,3-D : U2 7.
A farmer asserted that the propargyl alcohol concentration in all soils containing composted steer manure increases every week during the first twelve weeks after treatment with PBr.
Do the data in Table 1 and Figure 3 support this assertion?
18
◀ Previous7 / 14Next ▶
Mechanisms, Detailed Processes & Governing Concepts
1
A. Yes
the propargyl alcohol concentration increased every week for H1, S1, and U1. B. Yesthe propargyl alcohol concentration increased every week for both H1 and S1.
2
19
3
C. No
the propargyl alcohol concentration does not increase every week for U1. D. Nothe propargyl alcohol concentration does not increase every week for both H1 and S1.
4
20
5
Honeybees often rely on their strong sense of smell to find nectar and pollen. Several scientists performed three experiments to test the hypothesis that western honeybees ( Apis mellifera ) are more strongly attracted to some scents than others.
6
21
◀ Previous8 / 14Next ▶
Mechanisms, Detailed Processes & Governing Concepts
1
Common sunflowers ( Helianthus annuus ) do not produce much natural fragrance.
2
Three drops of essential oil in one of five scents (chamomile, jasmine, lavender, rosemary,
and sage) were added to each of twenty H. annuus flowers that had recently bloomed such that there were four flowers with each scent.
3
All of the sunflowers were placed equally spaced in a glass container.
4
An A. mellifera bee was then placed in the glass container and observed for 2 hours.
5
22
6
Scientists recorded the number of times the bee landed on a flower of each scent. The same procedure was repeated for an additional 49 A. mellifera bees. The average number of visits to each flower scent over the 2 hours is shown in Figure 1.
◀ Previous9 / 14Next ▶
Mechanisms, Detailed Processes & Governing Concepts
Mechanisms, Detailed Processes & Governing Concepts
23
The procedure for Experiment 1 was repeated with the same set of 50 A. mellifera bees and the same 20 H. annuus flowers two weeks later as the H. annuus neared the end of their blooming period.
Each flower received three more drops of the same essential oil that was applied to it in Experiment 1.
The average number of visits to each flower scent over the 2 hours is shown in Figure 2.
24
The procedure for Experiment 1 was repeated except with 20 recently bloomed prairie sunflowers ( Helianthus pauciflorus ) instead of H. annuus flowers. The average number of visits to each flower scent over the 2 hours is shown in Figure 3.
◀ Previous10 / 14Next ▶
Mechanisms, Detailed Processes & Governing Concepts
1
25
2
1. Suppose that an additional experiment was performed in which the scientists repeated Experiment 2 except that they recorded the scent of the flowers visited by 25 bees in 2 hrs.
3
Assuming the 25 bees in the new experiment behaved in the same way as the bees in Experiment 2, would the total number of recorded visits to flowers more likely have been greater than or less than the total number of visits to flowers in Experiment 2 ?
4
26
5
A. Greater
because the number of bees visiting the flowers would have been four times as great. B. Greaterbecause the number of bees visiting the flowers would have been two times as great.
6
27
◀ Previous11 / 14Next ▶
Mechanisms, Detailed Processes & Governing Concepts
Mechanisms, Detailed Processes & Governing Concepts
C. Less
because the number of bees visiting the flowers would have been one-fourth as great. D. Lessbecause the number of bees visiting the flowers would have been one-half as great.
28
2. Was the scientists’ hypothesis supported by the results of the experiments? F. No
in each experiment, on average, the bees landed on the same number of flowers with each scent in 2 hrs.
29
G. No
in each experiment, on average, the bees landed on more jasmine-scented flowers than flowers with any other scent in 2 hrs. H. Yesin each experiment, on average, the bees landed on the same number of flowers with each scent in 2 hrs.
30
◀ Previous12 / 14Next ▶
Mechanisms, Detailed Processes & Governing Concepts
Mechanisms, Detailed Processes & Governing Concepts
J. Yes
in each experiment, on average, the bees landed on more jasmine-scented flowers than flowers with any other scent in 2 hrs. 3. How many total sunflowers were needed to complete Experiments 1–3 ?
31
4. Which of the following experiments could be used to determine if a different species of pollinator would have the same scent preferences for H. annuus near the end of their blooming period?
32
F. Repeat Experiment 2 with A. mellifera as the pollinator. G. Repeat Experiment 2 with a species of pollinator other than A. mellifera. H. Repeat Experiment 3 with A. mellifera as the pollinator.
33
◀ Previous13 / 14Next ▶
Mechanisms, Detailed Processes & Governing Concepts
Mechanisms, Detailed Processes & Governing Concepts
J. Repeat Experiment 3 with a species of pollinator other than A. mellifera . 5. Which of the following calculations was most likely used to calculate each of the values in Figure 3 ?
◀ Previous14 / 14
1Key Experimental Procedures & Practical Investigations2Key Experimental Procedures & Practical Investigations3Key Experimental Procedures & Practical Investigations4Key Experimental Procedures & Practical Investigations5Key Experimental Procedures & Practical Investigations6Key Experimental Procedures & Practical Investigations7Key Experimental Procedures & Practical Investigations8Key Experimental Procedures & Practical Investigations9Key Experimental Procedures & Practical Investigations10Key Experimental Procedures & Practical Investigations11Key Experimental Procedures & Practical Investigations12Key Experimental Procedures & Practical Investigations13Key Experimental Procedures & Practical Investigations14Key Experimental Procedures & Practical Investigations
1Analytical Data, Comparative Structures & Scientific Framewo2Analytical Data, Comparative Structures & Scientific Framewo3Analytical Data, Comparative Structures & Scientific Framewo4Analytical Data, Comparative Structures & Scientific Framewo5Analytical Data, Comparative Structures & Scientific Framewo6Analytical Data, Comparative Structures & Scientific Framewo7Analytical Data, Comparative Structures & Scientific Framewo8Analytical Data, Comparative Structures & Scientific Framewo9Analytical Data, Comparative Structures & Scientific Framewo10Analytical Data, Comparative Structures & Scientific Framewo11Analytical Data, Comparative Structures & Scientific Framewo12Analytical Data, Comparative Structures & Scientific Framewo13Analytical Data, Comparative Structures & Scientific Framewo14Analytical Data, Comparative Structures & Scientific Framewo15Analytical Data, Comparative Structures & Scientific Framewo16Analytical Data, Comparative Structures & Scientific Framewo17Analytical Data, Comparative Structures & Scientific Framewo18Analytical Data, Comparative Structures & Scientific Framewo19Analytical Data, Comparative Structures & Scientific Framewo20Analytical Data, Comparative Structures & Scientific Framewo21Analytical Data, Comparative Structures & Scientific Framewo22Analytical Data, Comparative Structures & Scientific Framewo
1Comprehensive Problem Solving & Synoptic Evaluation2Comprehensive Problem Solving & Synoptic Evaluation3Comprehensive Problem Solving & Synoptic Evaluation4Comprehensive Problem Solving & Synoptic Evaluation5Comprehensive Problem Solving & Synoptic Evaluation6Comprehensive Problem Solving & Synoptic Evaluation7Comprehensive Problem Solving & Synoptic Evaluation8Comprehensive Problem Solving & Synoptic Evaluation9Comprehensive Problem Solving & Synoptic Evaluation10Comprehensive Problem Solving & Synoptic Evaluation11Comprehensive Problem Solving & Synoptic Evaluation12Comprehensive Problem Solving & Synoptic Evaluation13Comprehensive Problem Solving & Synoptic Evaluation14Comprehensive Problem Solving & Synoptic Evaluation15Comprehensive Problem Solving & Synoptic Evaluation16Comprehensive Problem Solving & Synoptic Evaluation17Comprehensive Problem Solving & Synoptic Evaluation18Comprehensive Problem Solving & Synoptic Evaluation19Comprehensive Problem Solving & Synoptic Evaluation20Comprehensive Problem Solving & Synoptic Evaluation21Comprehensive Problem Solving & Synoptic Evaluation22Comprehensive Problem Solving & Synoptic Evaluation23Comprehensive Problem Solving & Synoptic Evaluation