Curriculum
Course: ACT SCIENCE
Login

Curriculum

ACT SCIENCE

Timed Practice

0/28 Dr Dabour Hub Science Diagram and Course Material
Text lesson

2.2 Reading Graphs

MasterStudy LMS Complete Reference — ACT Science Mastery: 2.2 Reading Graphs.

1Theoretical Principles & Core Foundations2Theoretical Principles & Core Foundations3Theoretical Principles & Core Foundations4Theoretical Principles & Core Foundations5Theoretical Principles & Core Foundations
Theoretical Principles & Core Foundations
1
Reading Graphs ACT Science notes: Read values from graphs accurately.
2
A steeper line means a faster rate of change.
3
Axes may not start at zero, exaggerating differences.
1 / 5Next ▶
Theoretical Principles & Core Foundations
1

4
2

On log scales, halfway between 10 and 100 is about 32, not 55.
3

5
4

Two curves crossing means equal y-values at that x.
5

6
6

Correlation does not prove causation.
◀ Previous2 / 5Next ▶
Theoretical Principles & Core Foundations
7
Read values from graphs accurately.
8
Compare multiple data sets.
9
Error bars show uncertainty in a measurement.
◀ Previous3 / 5Next ▶
Theoretical Principles & Core Foundations
10
Best-fit lines summarise scattered data.
11
A graph and a table may show the same data in two forms.
◀ Previous4 / 5Next ▶
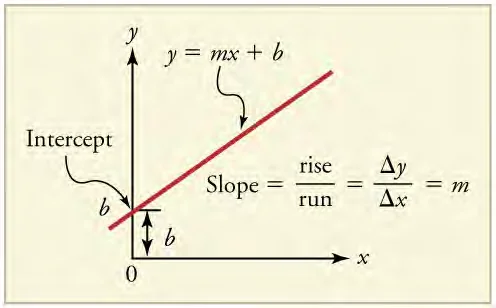
Reading graphs: slope, area and intercept: A straight-line graph with its slope and intercept marked.
Theoretical Principles & Core Foundations
◀ Previous5 / 5
1Mechanisms, Detailed Processes & Governing Concepts2Mechanisms, Detailed Processes & Governing Concepts3Mechanisms, Detailed Processes & Governing Concepts4Mechanisms, Detailed Processes & Governing Concepts
Mechanisms, Detailed Processes & Governing Concepts
1

1
2

Dual-axis graphs need extra care with which axis applies.
3

2
4

Percentages on the y-axis may not relate to absolute amounts.
5

3
6

Read the title and both axis labels with units.
1 / 4Next ▶
Mechanisms, Detailed Processes & Governing Concepts
4
Check the scale (linear or logarithmic, starting value).
5
Use the legend to identify each line or bar.
6
Find the x-value, move vertically to the curve

then horizontally to the y-axis.
◀ Previous2 / 4Next ▶
Mechanisms, Detailed Processes & Governing Concepts
1

7
2

Describe the trend or compare curves.
3

8
4

Reading a point on a graph — write these steps in this order

each step is a marking point.
5

9
6

A line rises from (0 s, 0 m) to (10 s, 50 m). Find the slope. 50 m ÷ 10 s = 5 m/s — this is the speed.
◀ Previous3 / 4Next ▶
Mechanisms, Detailed Processes & Governing Concepts
10
50 m ÷ 10 s = 5 m/s — this is the speed.
11
Axes, units and scale first.
◀ Previous4 / 4
1Key Experimental Procedures & Practical Investigations2Key Experimental Procedures & Practical Investigations3Key Experimental Procedures & Practical Investigations4Key Experimental Procedures & Practical Investigations
Key Experimental Procedures & Practical Investigations
1
Use the legend to pick the right curve.
2
Steeper = faster change.
3
Q1. On a distance–time graph, a horizontal line means
1 / 4Next ▶
Key Experimental Procedures & Practical Investigations
1

4
2

B. Distance not changing.
3

5
4

Q2. A curve that rises steeply then levels off shows
5

6
6

Q3. On a log scale 1, 10, 100, 1000, the value midway between 10 and 100 is about
◀ Previous2 / 4Next ▶
Key Experimental Procedures & Practical Investigations
1

7
2

B. Geometric mean ≈ 31.6.
3

8
4

Q4. Two lines cross at x = 20. At x = 20 the two variables
5

9
6

These Reading Graphs ACT Science notes covered the key ideas, worked examples and exam technique for this topic. Check your Reading Graphs ACT Science understanding with the practice questions below

then reread any Reading Graphs ACT Science point you were unsure about before moving on.
◀ Previous3 / 4Next ▶
Key Experimental Procedures & Practical Investigations
10
Practice: Reading Graphs ACT Science practice questions
11
Previous lesson: 2.1 Reading Tables
◀ Previous4 / 4
1Analytical Data, Comparative Structures & Scientific Framewo2Analytical Data, Comparative Structures & Scientific Framewo3Analytical Data, Comparative Structures & Scientific Framewo4Analytical Data, Comparative Structures & Scientific Framewo
Analytical Data, Comparative Structures & Scientific Frameworks
1

1
2

Next lesson: 2.3 Trends, Interpolation and Extrapolation
3

2
4

Course: ACT Science — all units
5

3
6

Official syllabus: ACT Science test description (act.org)
1 / 4Next ▶
Analytical Data, Comparative Structures & Scientific Frameworks
4
Horizontal axis, usually the independent variable.
5
Vertical axis, usually the dependent variable.
6
The value spacing along an axis.
◀ Previous2 / 4Next ▶
Analytical Data, Comparative Structures & Scientific Frameworks
7
Each equal step multiplies the value (e.g. 1, 10, 100).
8
Explains the symbols or colours of different data sets.
9
Steepness of a line

rate of change of y with x.
◀ Previous3 / 4Next ▶
Analytical Data, Comparative Structures & Scientific Frameworks
1

10
2

Compares quantities across categories.
3

11
4

Shows how a variable changes continuously.
◀ Previous4 / 4
1Comprehensive Problem Solving & Synoptic Evaluation2Comprehensive Problem Solving & Synoptic Evaluation3Comprehensive Problem Solving & Synoptic Evaluation4Comprehensive Problem Solving & Synoptic Evaluation
Comprehensive Problem Solving & Synoptic Evaluation
1

1
2

Identify / Describe (FRQ) A short, specific statement

describing requires relevant characteristics, not a single word.
3

2
4

Explain / Justify (FRQ) Give the cause-and-effect reasoning or evidence

a restated fact does not score.
5

3
6

Calculate Show setup, substitution and the answer with units.
1 / 4Next ▶
Comprehensive Problem Solving & Synoptic Evaluation
4
Predict State the expected outcome

add a reason only if asked to justify.
5
MCQ technique Read every option

eliminate distractors that are true statements but do not answer the questionwatch for NOT/EXCEPT.
6
x-axis · y-axis · Scale · Logarithmic scale · Legend (key) · Slope · Bar graph · Line graph
◀ Previous2 / 4Next ▶
Comprehensive Problem Solving & Synoptic Evaluation
1

7
2

Learn each definition in the Key words tab exactly

a missing keyword in a definition usually loses the mark.
3

8
4

Answer exactly what is asked

extra correct material does not earn credit, and contradictory statements can cancel credit (AP FRQ).
5

9
6

Use precise vocabulary (e.g. ‘active site’, ‘concentration gradient’, ‘allele’), never ‘it/stuff/things’.
◀ Previous3 / 4Next ▶
Comprehensive Problem Solving & Synoptic Evaluation
10
Show units and working in calculations.
11
In MCQs, predict the answer before reading the options

then eliminate.
◀ Previous4 / 4
Accepted payment methods