11.4Chapter 11: Patterns in the Periodic Table
The periodic table: Group 1 — Alhussan Chemistry - Stage 9 Revision Notes & Topical Questions
5 min read 7 parts Lesson 4 of 7 2 quizzes
11.4 The periodic table: Group 1 — Alkali Metals Physical Trends — Alhussan International Academy — Chemistry (Stages 7–9) notes: Give the position of Group 1, describe and explain the pattern in its melting points and use data to describe trends.Position — Group 1 is the column …
- Boiling point
- Compared with other metals
- Down the group
- Attraction
- Secondary source
- Conclusion
Section 1 of 7Position and general properties
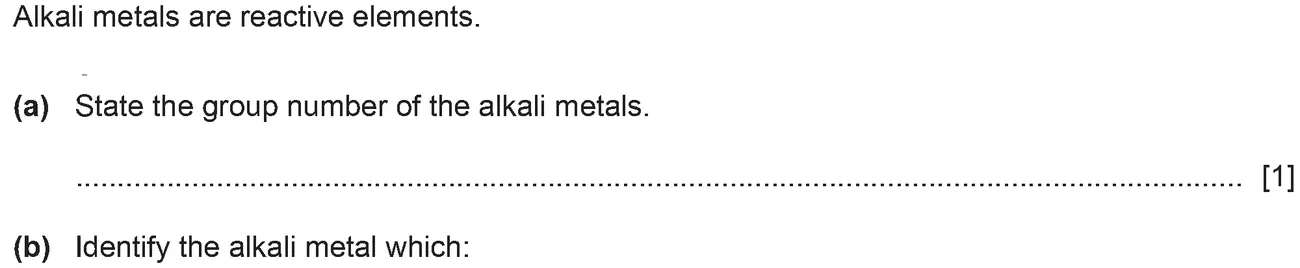
- Group 1 is the column on the left of the periodic table.
- The elements are lithium, sodium, potassium, rubidium, caesium and francium.
- Metals like other metals, the Group 1 elements conduct electricity and are shiny when freshly cut.
- A freshly cut surface tarnishes quickly in air.
- Softness they are softer than most other metals and can be cut with a knife.
- Uses lithium is used in the batteries of electric cars, and Bolivia has huge reserves of lithium in salt flats.
Section 2 of 7Physical trends down the group
| Metal | Melting point (°C) | Boiling point (°C) | Density (g/cm3) |
|---|---|---|---|
| Lithium | 181 | 1330 | 0.53 |
| Sodium | 98 | 890 | 0.97 |
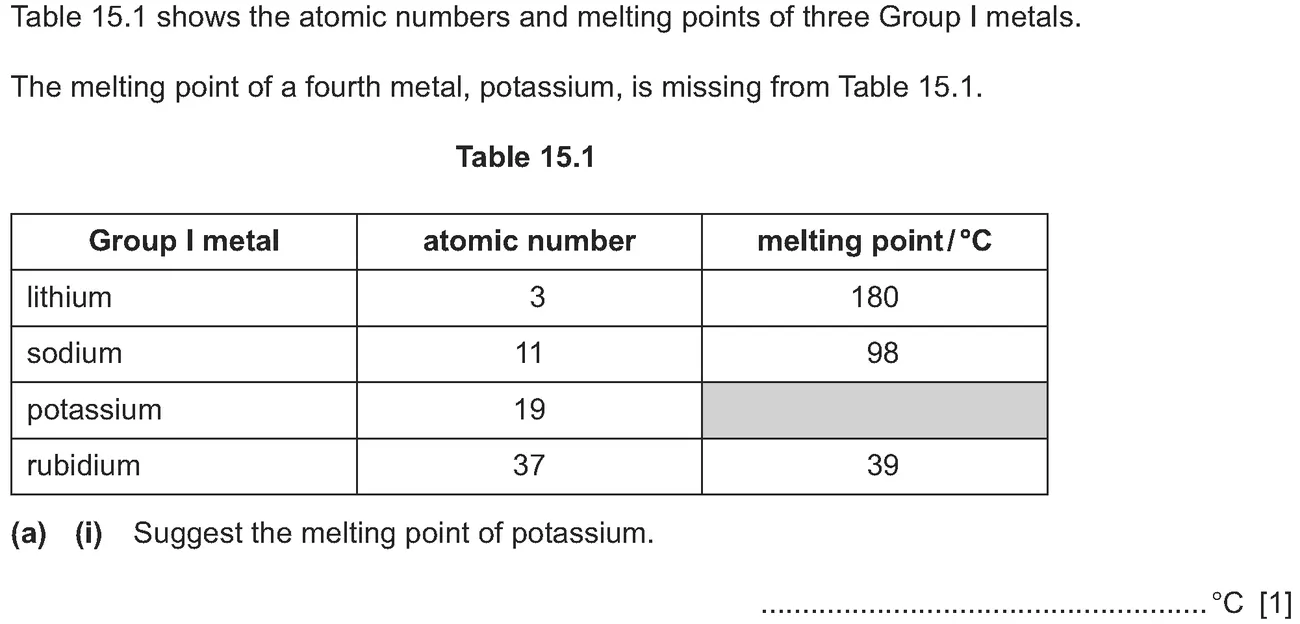
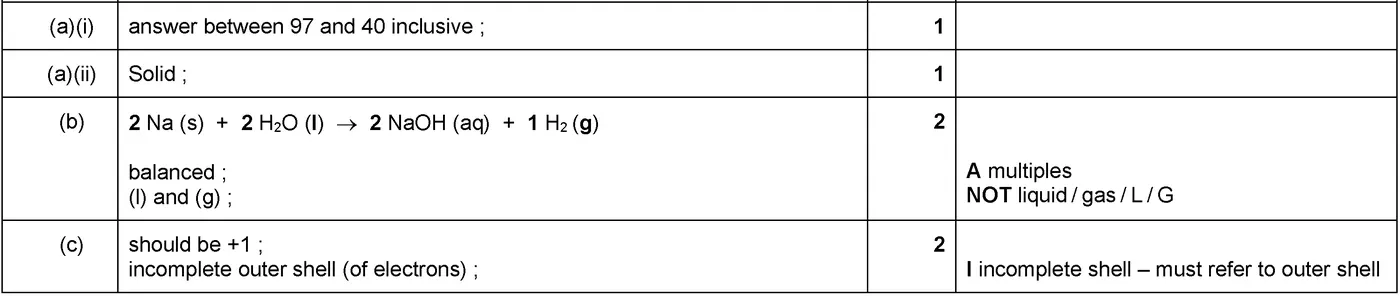
| Potassium | 63 | 774 | 0.86 |
| Rubidium | 39 | 688 | 1.53 |
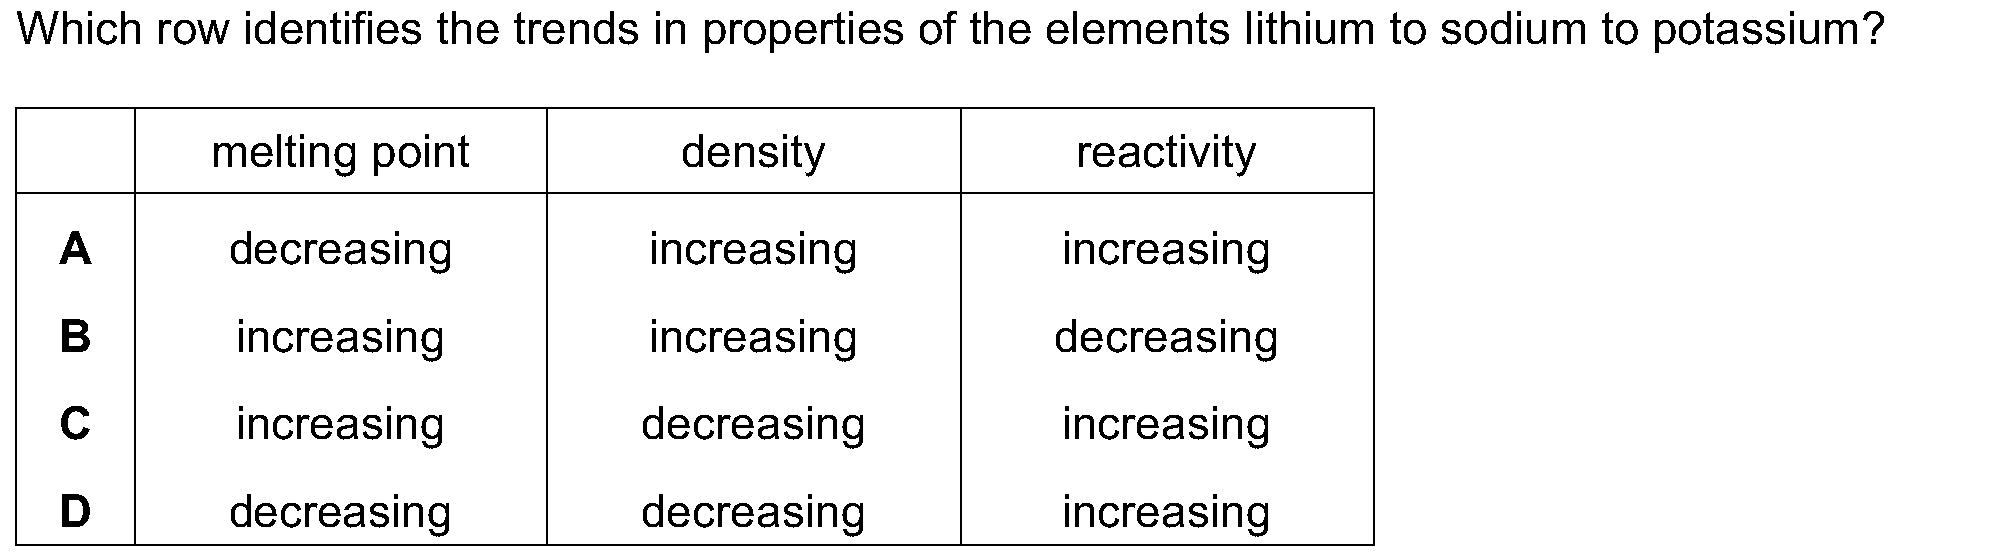
- Melting point it decreases from lithium at the top to caesium at the bottom.
- Caesium melts at about 29 °C, close to room temperature on a warm day.
- Boiling point it also decreases down the group.
- Softness the metals get softer down the group.
- Compared with other metals melting points are low compared with a typical transition metal such as iron (1538 °C).
Section 3 of 7Explaining the melting point pattern
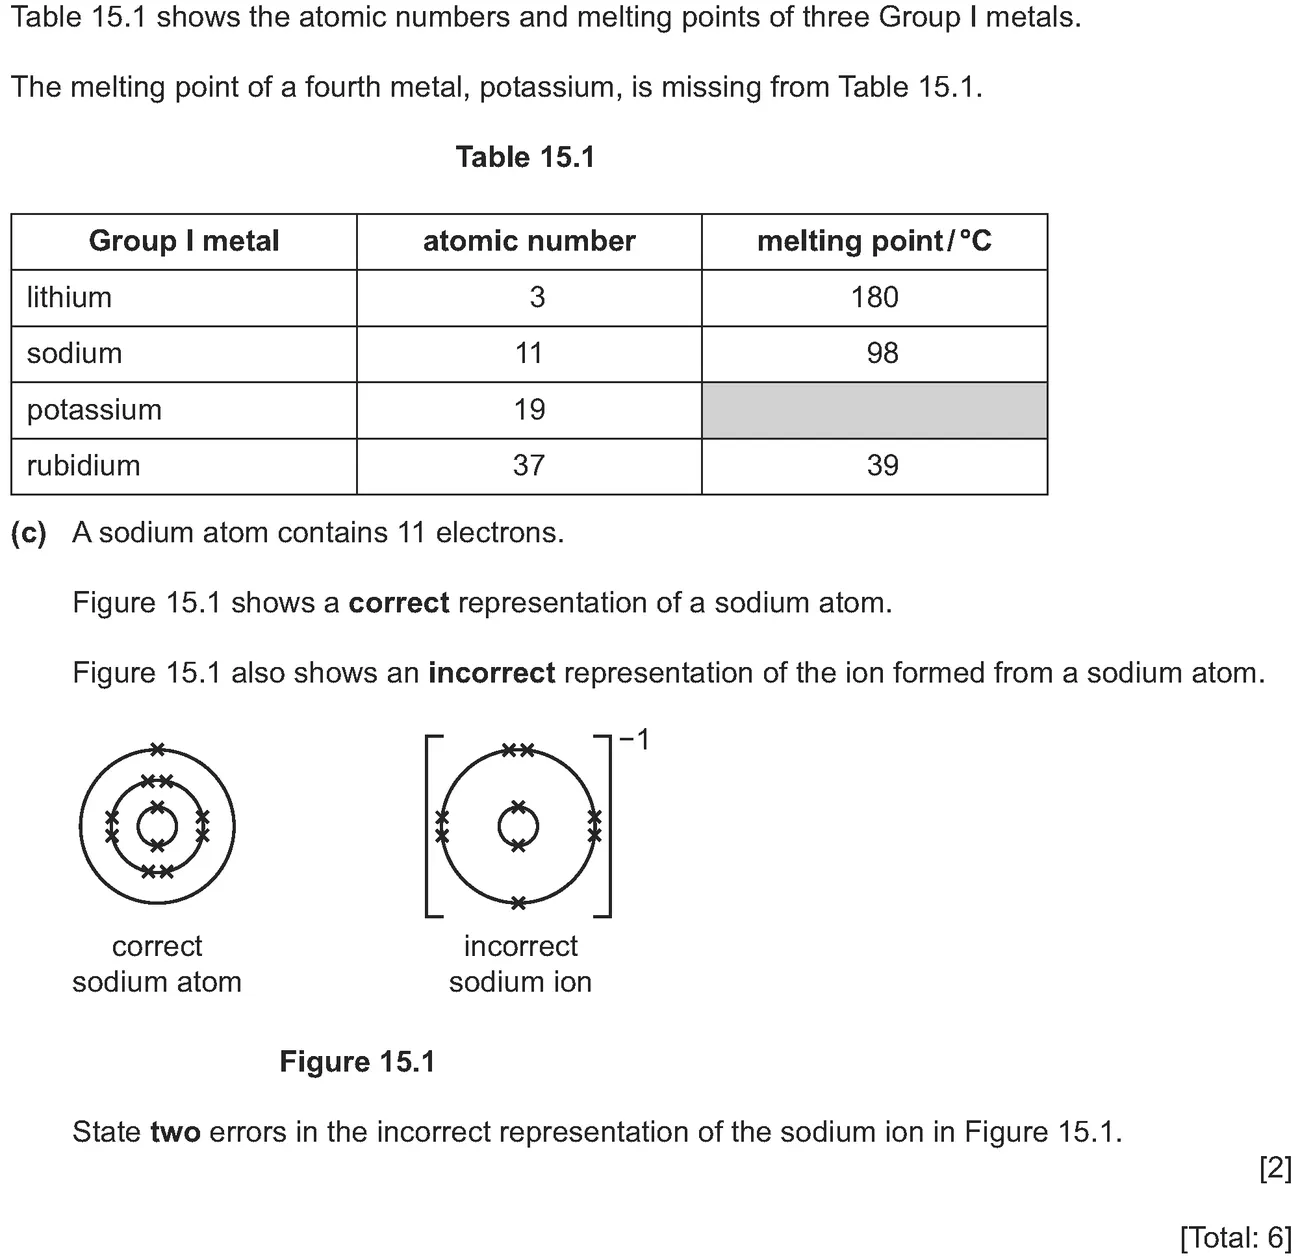
- Group 1 elements have giant metallic structures in which each atom loses its one outer electron to form a positive ion.
- The electrons move around between the ions.
- Down the group the outer electron gets further from the nucleus and the positive ions get bigger.
- Attraction the electrostatic attraction between positive ions and negative electrons gets weaker.
- Result as attractions get weaker, ions leave their fixed positions more easily, so the melting point decreases.
Section 4 of 7Presenting data and drawing conclusions
- Banjeet could not measure melting points himself, so he chose a trustworthy secondary source such as a reference table.
- Evaluate a source by asking whether it is a reliable textbook or scientific database.
- Table the independent variable (the element) goes in the left column.
- Bar chart it is used because the independent variable, the element, is categoric.
- (described by words)
- Conclusion from lithium at the top to caesium at the bottom, melting point decreases.
- Quote valueslithium melts at 181 °C and rubidium at 39 °C, a fall of 142 °C.
- Predicting caesium should melt below rubidium, and interpolation within the data is more reliable than extrapolation beyond it.
Section 5 of 7Density
- Pattern overall density increases from lithium at the top to caesium at the bottom, because the atoms become heavier.
- Exception potassium does not fit the pattern.
- Floating lithium, sodium and potassium are less dense than water and float, whereas rubidium and caesium are denser and sink.
Section 6 of 7Key terms
| Term | Meaning |
|---|---|
| Alkali metal | a soft, reactive metal in Group 1. |
| Trend | a pattern in data. |
| Metallic bonding | the attraction between positive ions and delocalised electrons. |
| Interpolation | estimating a value within the range of data. |
| Categoric variable | a variable described by words. |
| Secondary source | a source of data you did not collect yourself. |
Section 7 of 7Exam technique
Marked practiceQuizzes for this lesson
?What do you want to solve now?
✓Checkpoint Quiz
9 multiple-choice + 3 written questions from real exam papers on this lesson.
Question 1 of 9 1:30
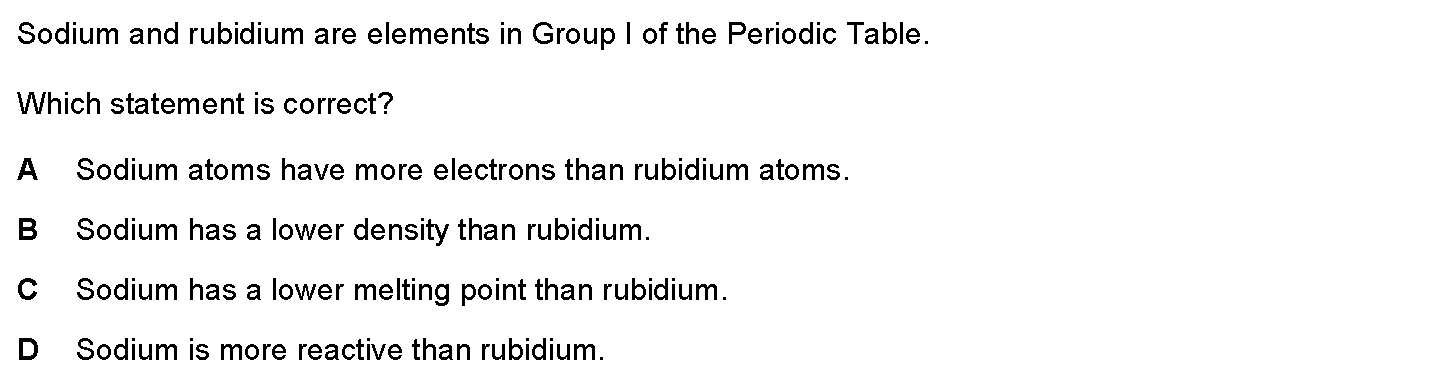
Question 2 of 9 1:30
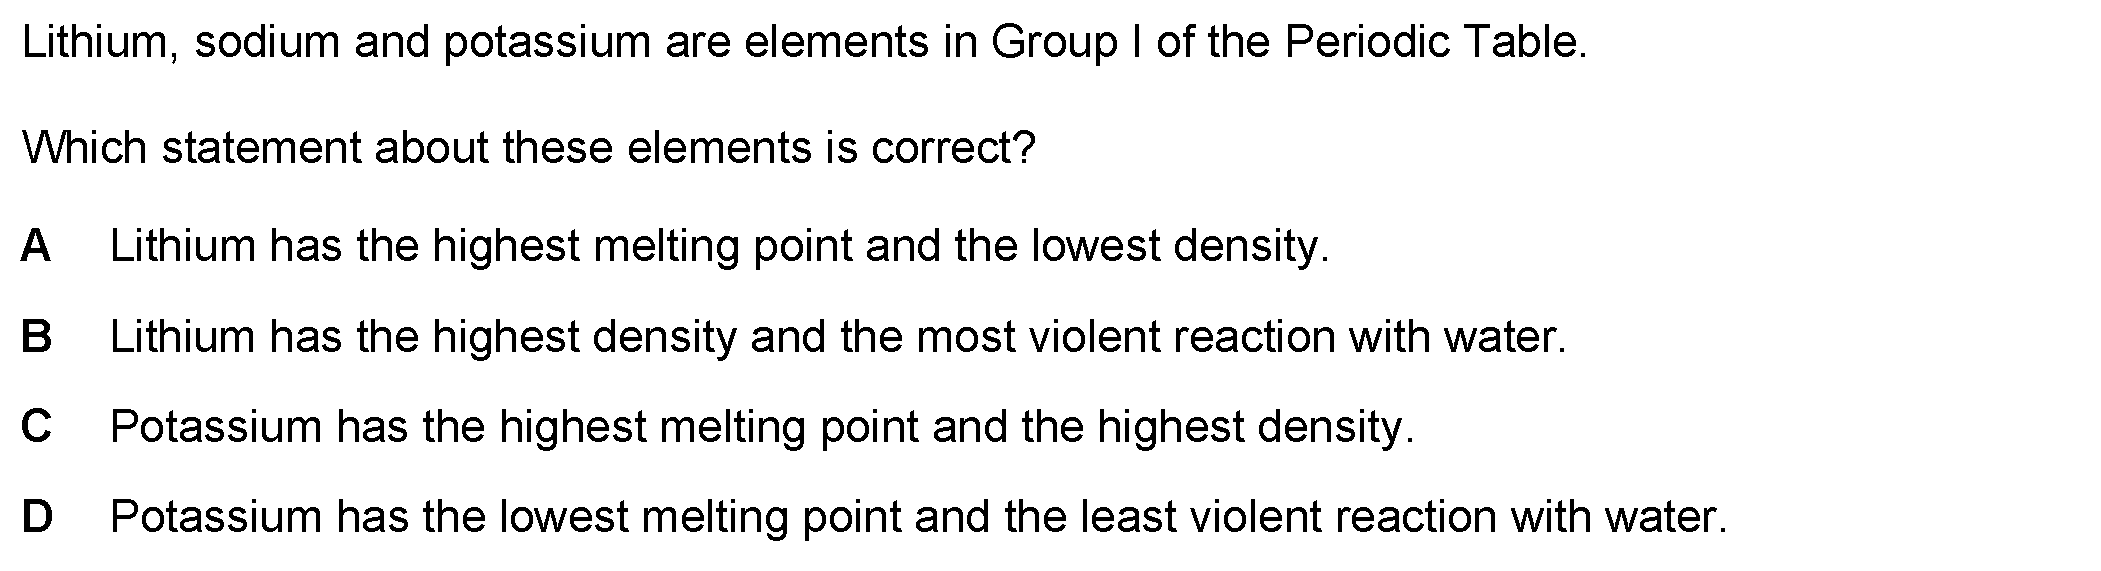
Question 3 of 9 1:30
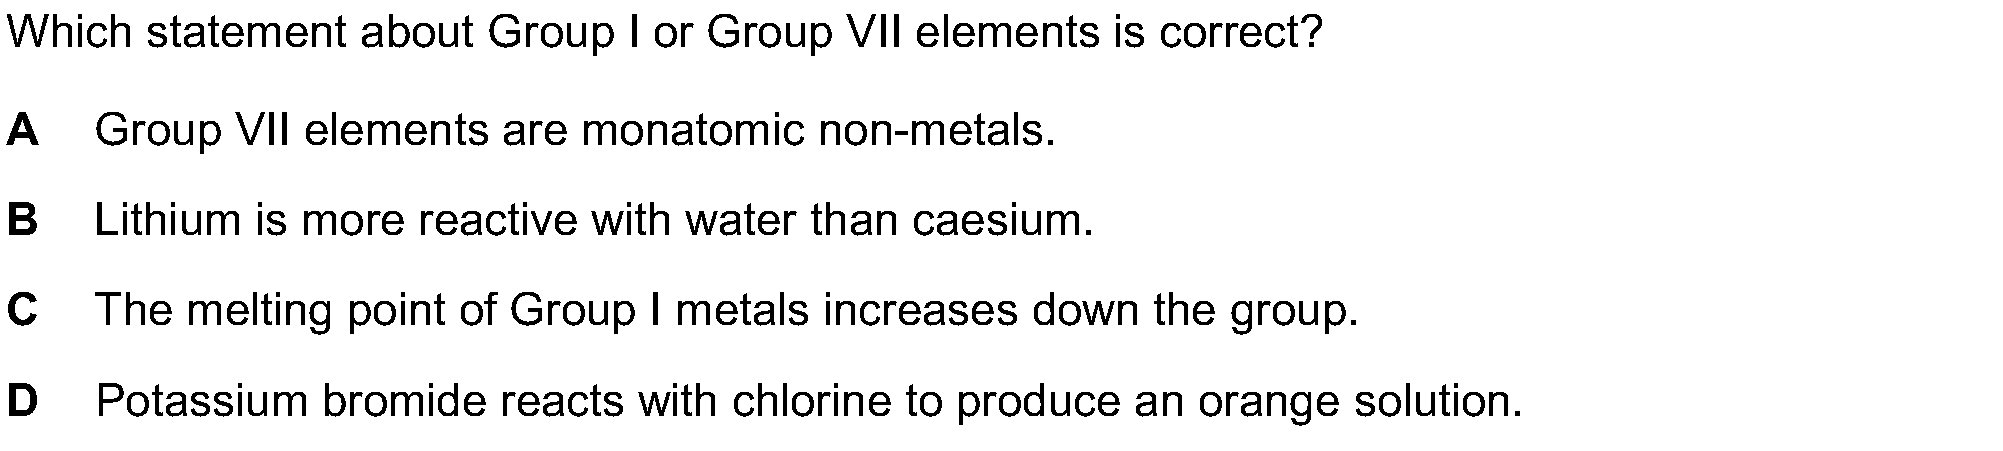
Question 4 of 9 1:30

Question 5 of 9 1:30
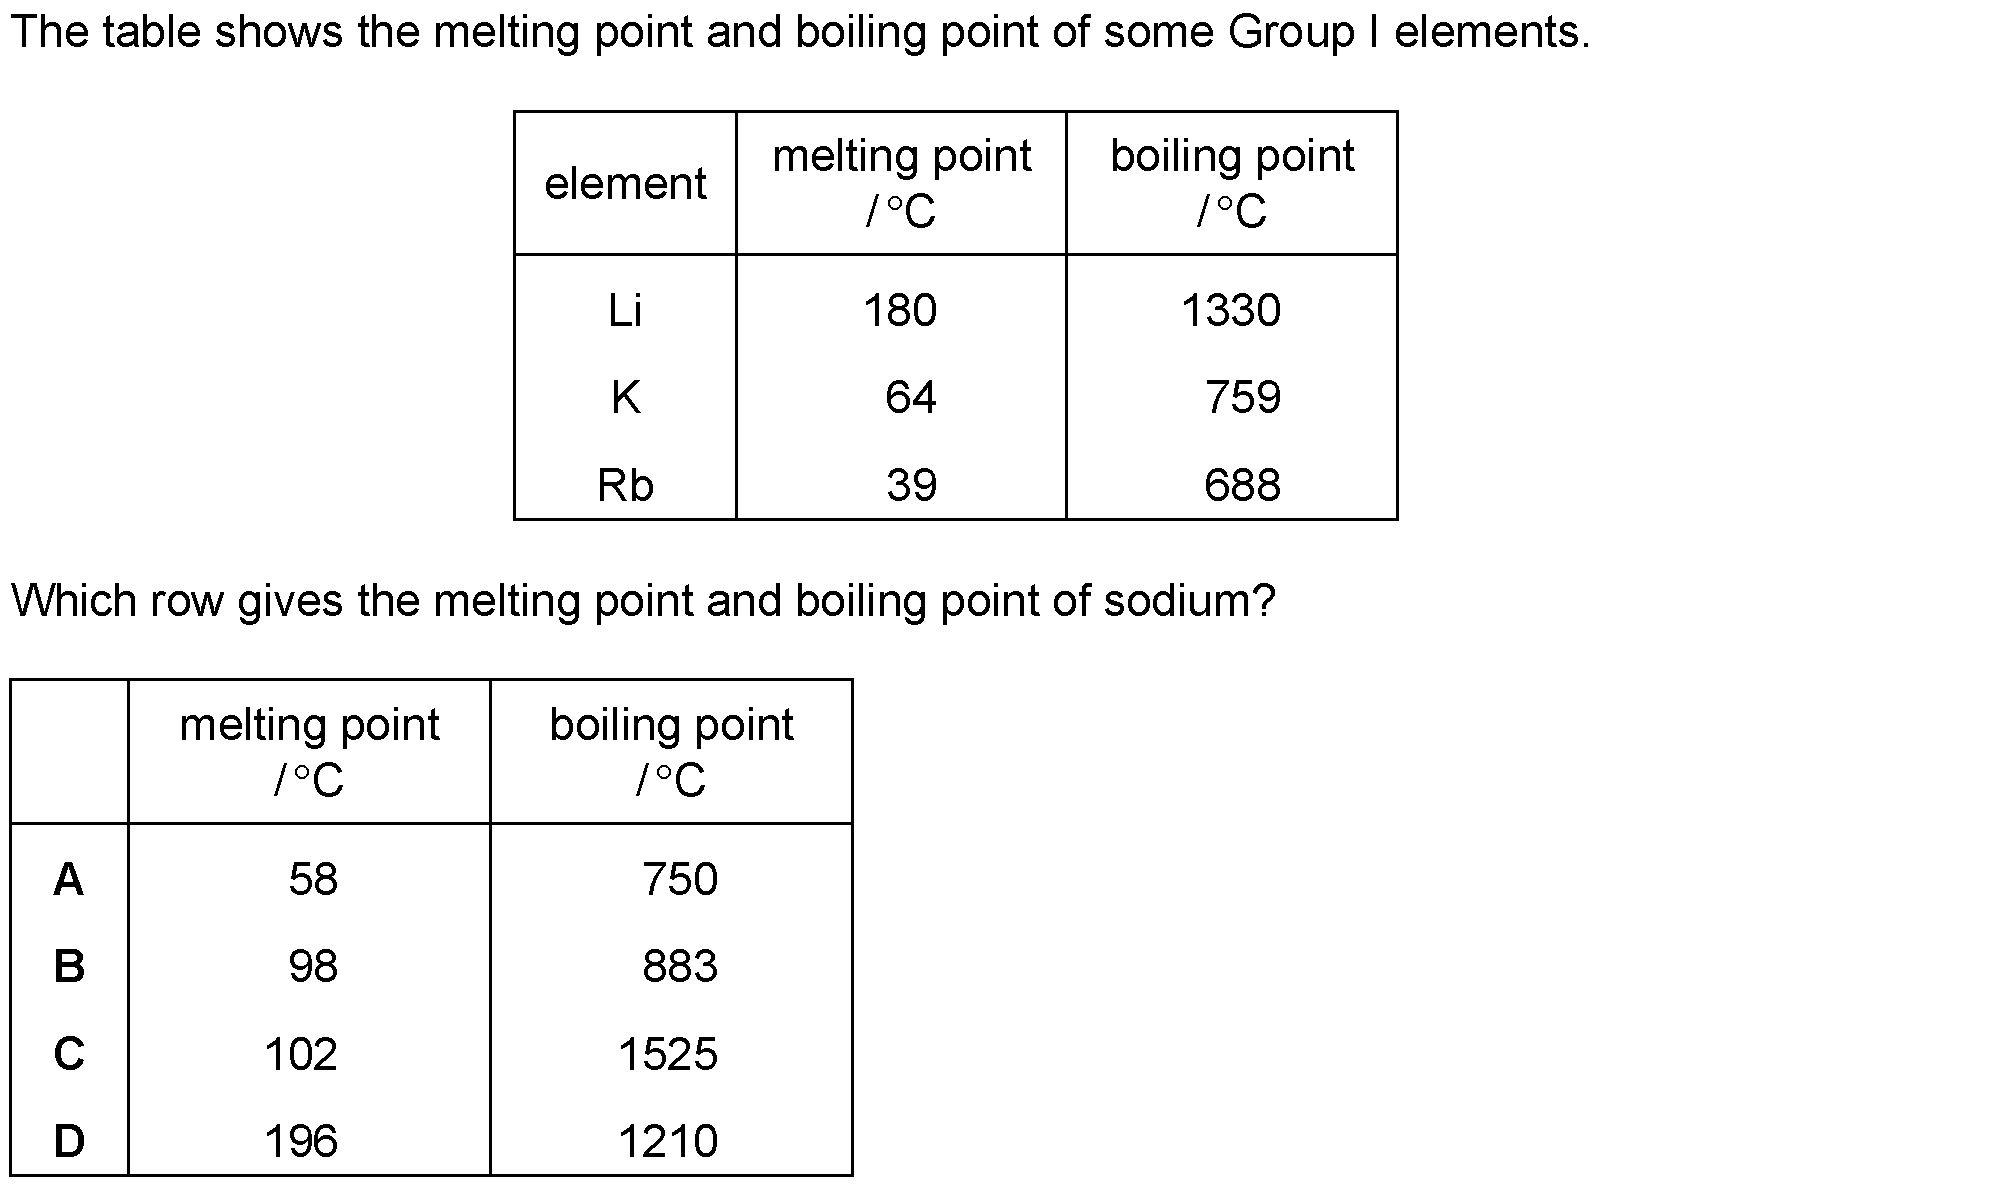
Question 6 of 9 1:30

Question 7 of 9 1:30
Question 8 of 9 1:30

Question 9 of 9 1:30

Answer key
1 B2 A3 D4 A5 B6 C7 A8 C9 D
Written question 1 of 3 · part (a) (1 / 10) 3:00
Show the answer

Written question 1 of 3 · part (b)(i) (2 / 10) 3:00

Show the answer
Written question 1 of 3 · part (c)(i) (3 / 10) 3:00

Show the answer

Written question 1 of 3 · part (c)(iii) (4 / 10) 3:00

Show the answer

Written question 1 of 3 · part (c)(iv) (5 / 10) 3:00

Show the answer

Written question 1 of 3 · part (c)(v) (6 / 10) 3:00

Show the answer

Written question 1 of 3 · part (c) (7 / 10) 3:00
Show the answer

Written question 1 of 3 · part (d)(i) (8 / 10) 3:00
Show the answer

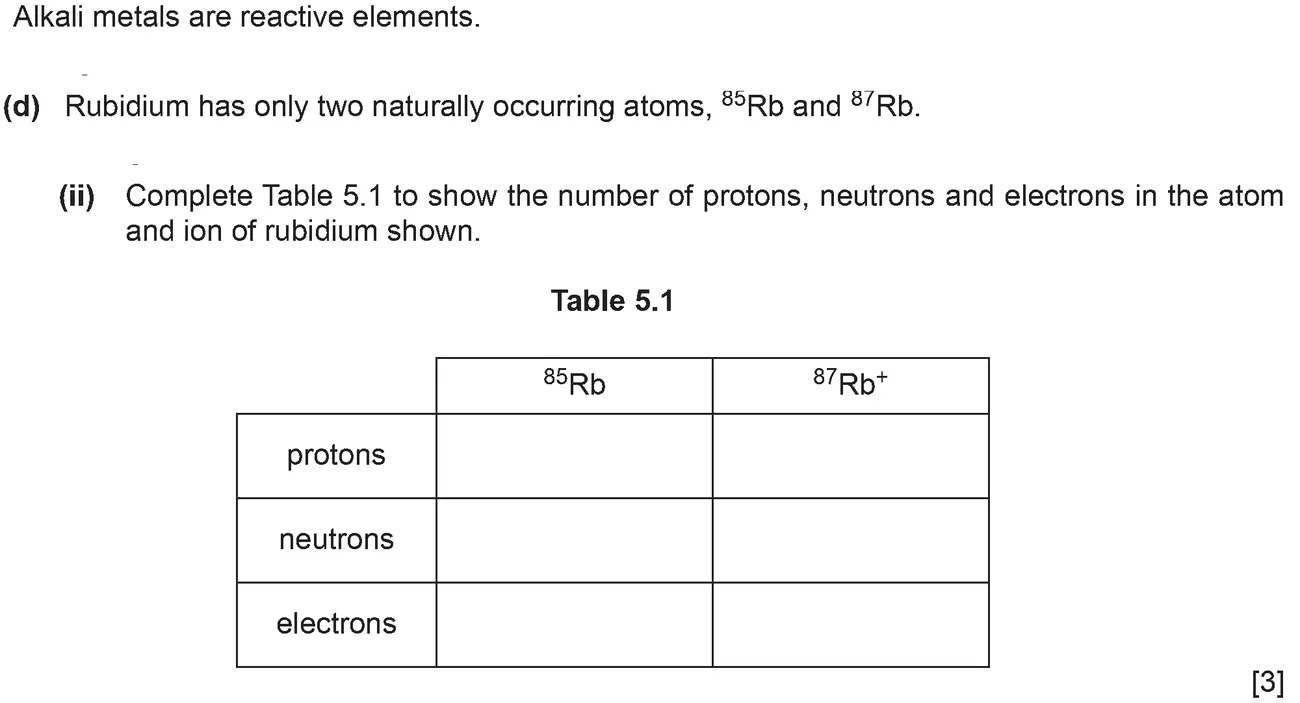
Written question 1 of 3 · part (d)(ii) (9 / 10) 3:00
Show the answer

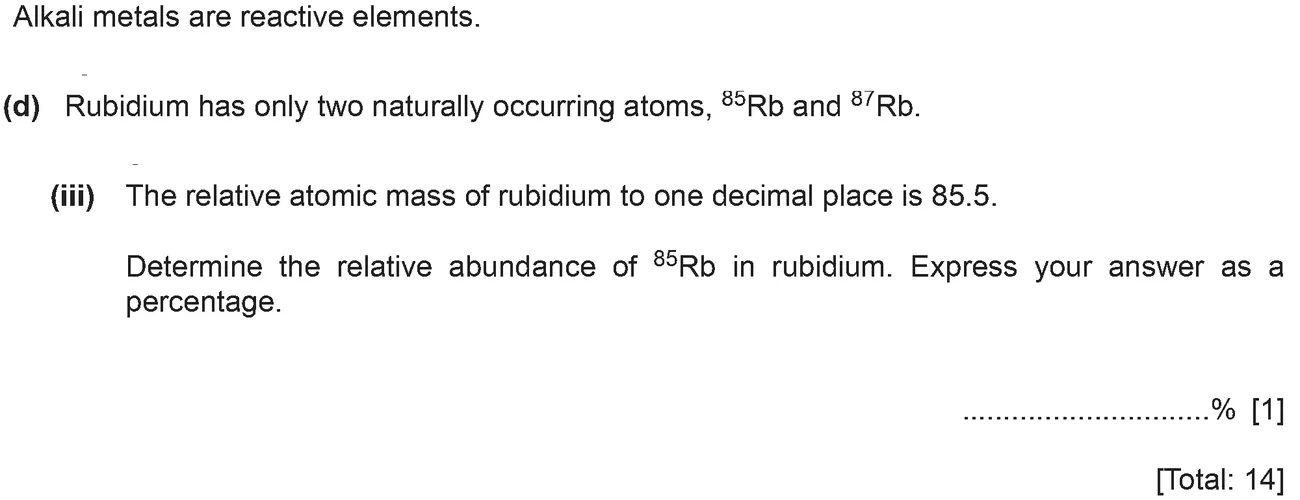
Written question 1 of 3 · part (d)(iii) (10 / 10) 3:00
Show the answer

Written question 2 of 3 · part (a)(i) (1 / 7) 3:00

Show the answer

Written question 2 of 3 · part (a)(ii) (2 / 7) 3:00

Show the answer
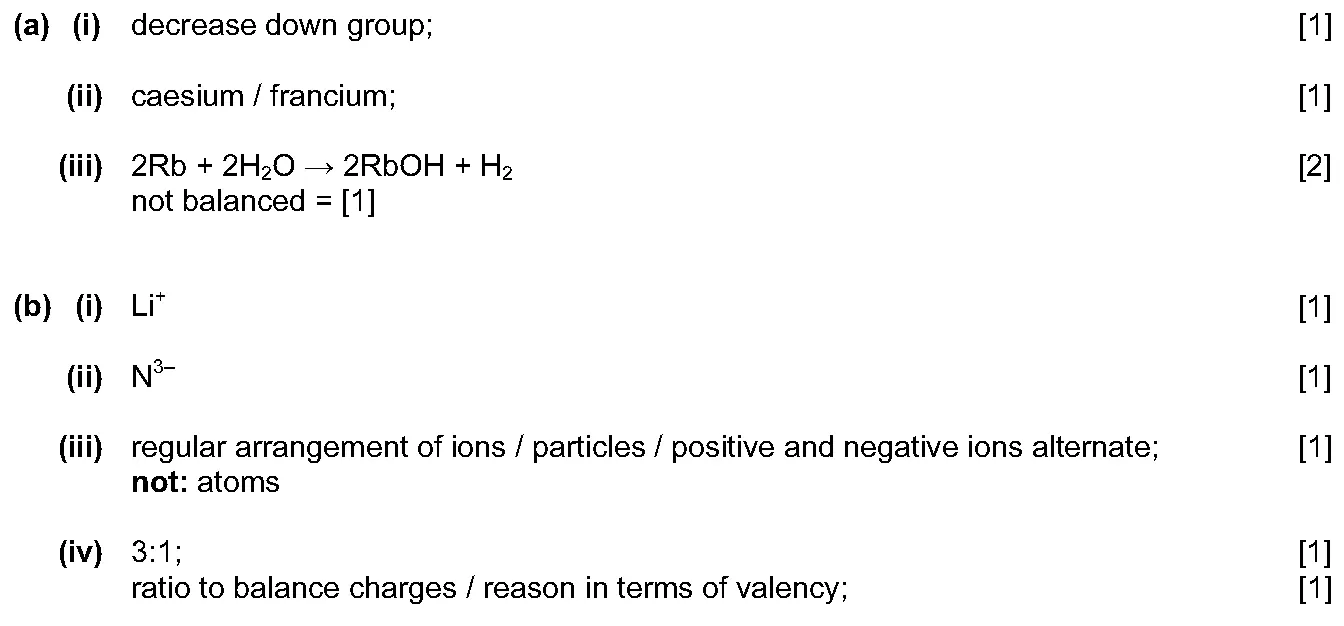
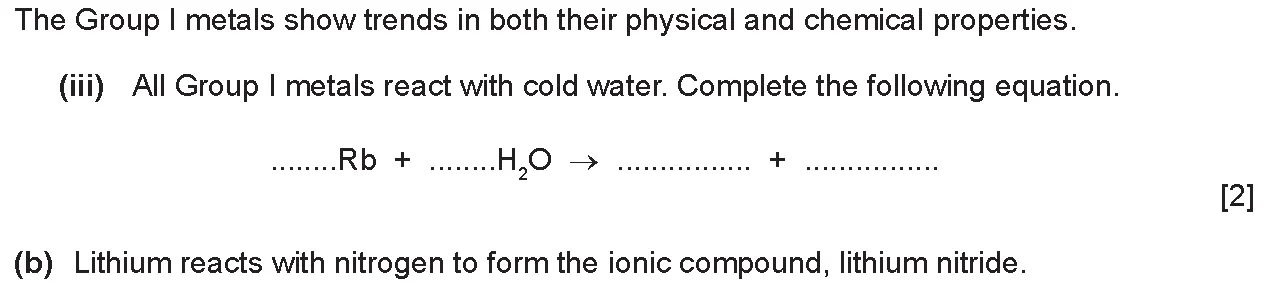
Written question 2 of 3 · part (a)(iii) (3 / 7) 3:00
Show the answer
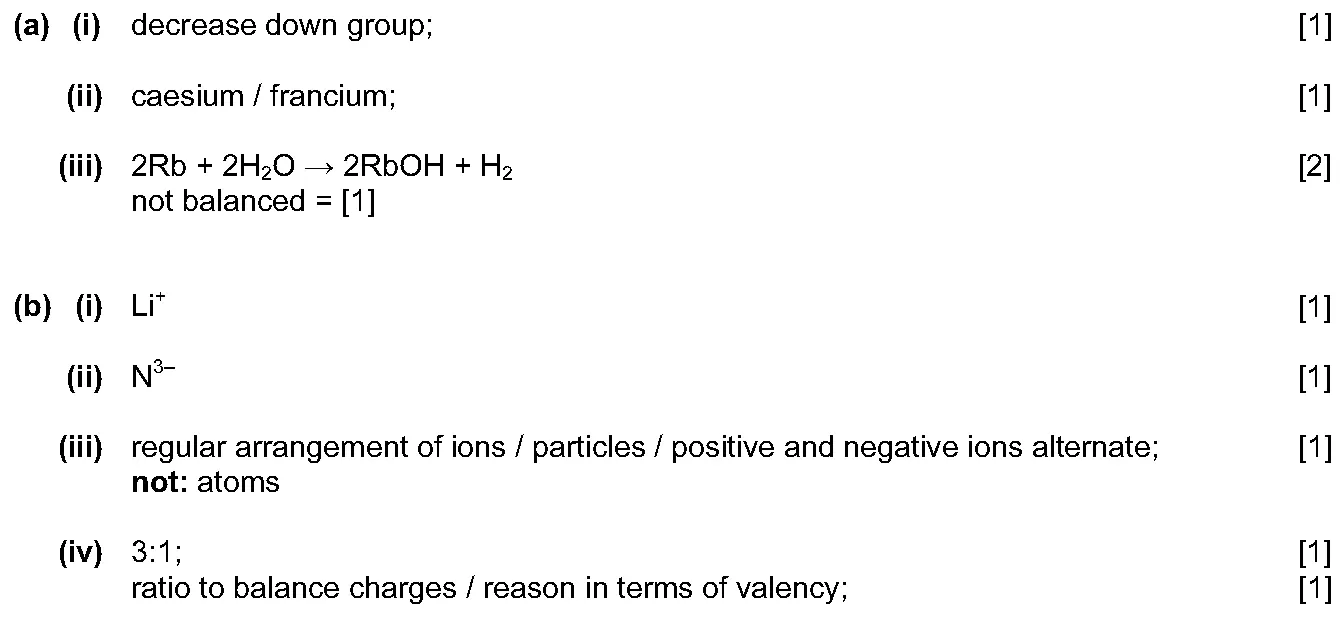
Written question 2 of 3 · part (b)(i) (4 / 7) 3:00

Show the answer
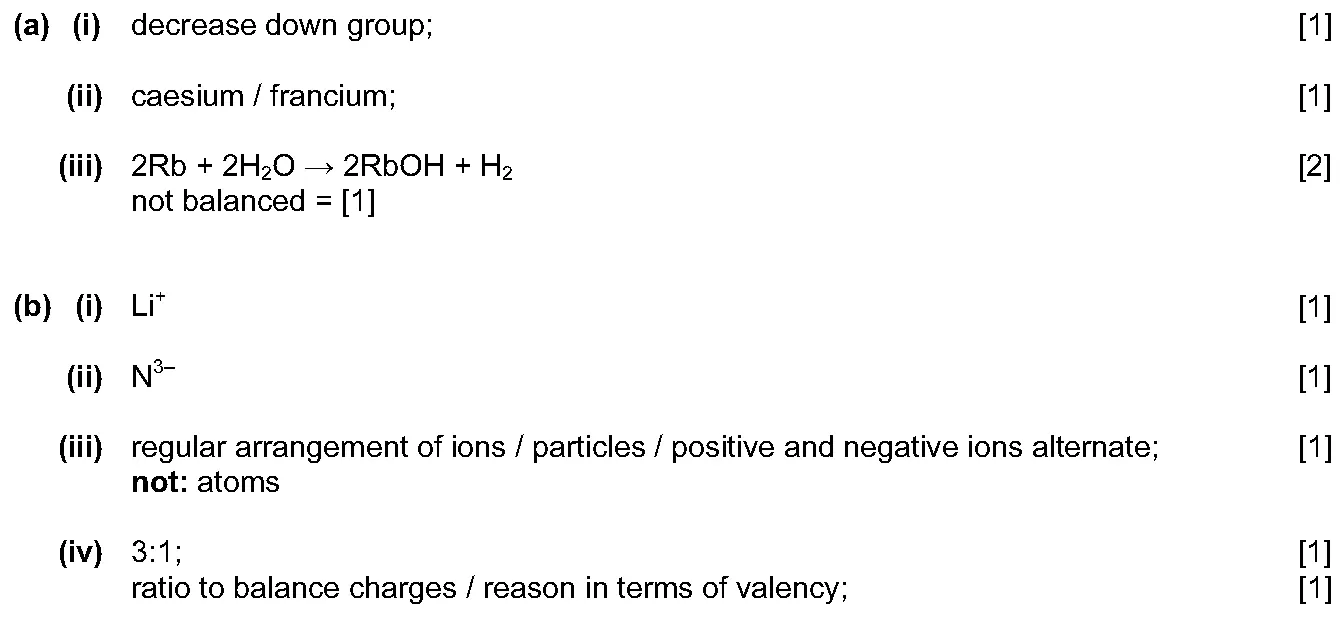
Written question 2 of 3 · part (b)(ii) (5 / 7) 3:00

Show the answer
Written question 2 of 3 · part (b)(iii) (6 / 7) 3:00
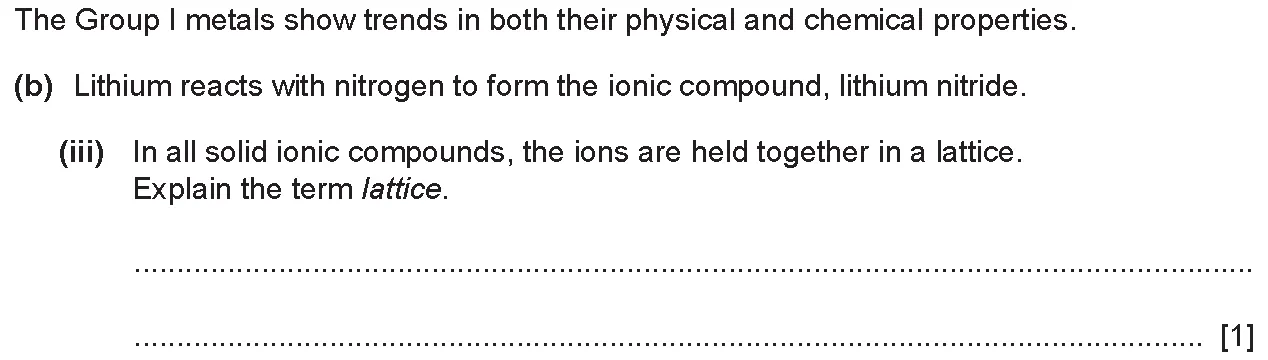
Show the answer
Written question 2 of 3 · part (b)(iv) (7 / 7) 3:00
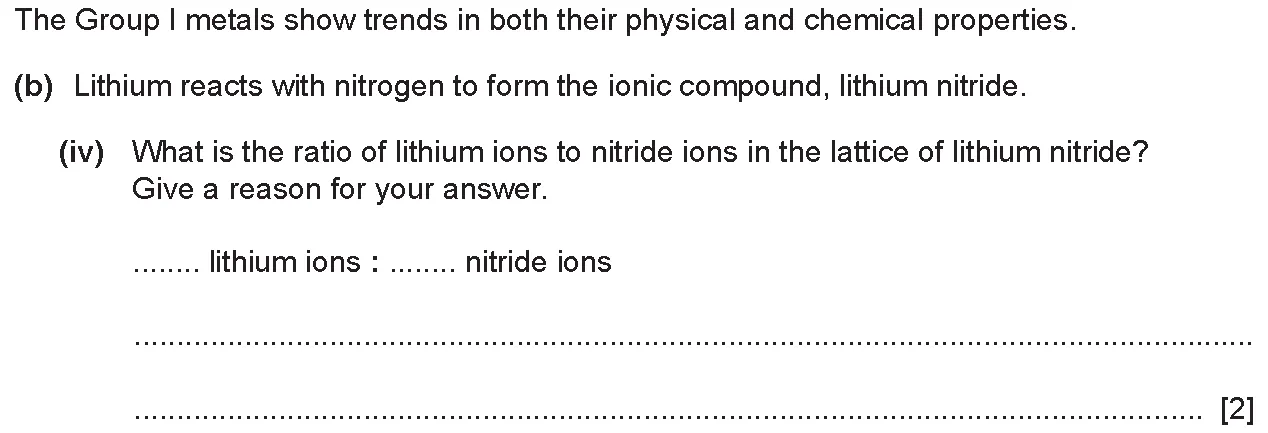
Show the answer
Written question 3 of 3 · part (a)(i) (1 / 4) 3:00
Show the answer
Written question 3 of 3 · part (a)(ii) (2 / 4) 3:00

Show the answer
Written question 3 of 3 · part (b) (3 / 4) 3:00
Show the answer

Written question 3 of 3 · part (c) (4 / 4) 3:00
Show the answer

Each part of a written question is on its own screen. Write your answer first, then open "Show the answer" to check it against the mark scheme.
Last updated: