C1.3Theme C — Interaction and interdependence
Photosynthesis — IB Biology HL Revision Notes & Topical Questions
10 min read 12 parts Lesson 4 of 11 3 quizzes
Curriculum Equation Key معادلة البناء الضوئي الموزونة - Balanced Photosynthesis EquationFast Exam Solution
6CO₂ + 6H₂O ➔ C₆H₁₂O₆ + 6O₂
Word Equation & Conditions: Carbon Dioxide + Water (+ Light & Chlorophyll) -> Glucose + Oxygen | ثاني أكسيد الكربون + ماء (في وجود الضوء والكلوروفيل) ← جلوكوز + أكسجين
Location & Specifications: البلاستيدات الخضراء (Chloroplast): التفاعلات الضوئية في الثايلاكويد، ودورة كالفن في الستروما.
Lesson summary
C1.3 Photosynthesis — IB BIOLOGY HL notes: Explain photosynthesis as energy conversion, the pigments and spectra, the light-dependent and light-independent reactions, and the factors that limit its rate.Definition — autotrophs such as plants, algae and cyanobacteria convert simpl…
- Word equation
- Link with respiration
- Absorption
- Chromatography
- Action spectrum
- Correlation
Part 1 of 10Photosynthesis as energy conversion
Definition
- Definition autotrophs such as plants, algae and cyanobacteria convert simple inorganic compounds into complex organic ones using light.
Energy conversion
- Energy conversion light energy becomes chemical energy stored in the bonds of organic compounds in biomass,
- which provides most of the chemical energy for ecosystems.
- Energy is converted, never created or destroyed.
Word equation
- Word equation carbon dioxide + water → glucose + oxygen.
- (in light, with chlorophyll)
- Hydrogen from split water reduces carbon dioxide to glucose.
- The oxygen released comes from water.
Link with respiration
- Link with respiration glucose and oxygen are the reactants of aerobic respiration,
- and carbon dioxide and water from respiration are reactants of photosynthesis.
Part 2 of 10Photosynthetic pigments and chromatography
- Pigment groups
| Pigment group | Pigment | Colour |
|---|---|---|
| Chlorophylls | Chlorophyll a | Blue-green |
| Chlorophylls | Chlorophyll b | Yellow-green |
| Carotenoids | Carotene | Orange |
| Carotenoids | Xanthophyll | Yellow |
Absorption
- Absorption chlorophylls absorb blue-violet and red light and reflect green, and carotenoids absorb mainly blue-violet.
- Carotenoids surround chlorophyll and widen the range of wavelengths absorbed.
Chromatography
Chromatography a technique that separates a mixture because its components travel at different speeds through a stationary phase.
- Paper chromatography uses cellulose paper, and thin-layer chromatography uses a thin layer of silica gel and separates faster and more clearly.
Method
1
Draw a pencil line about 1 cm above the bottom of the paper (ink would separate into pigments).
2
Grind a healthy, sunlit leaf with 20 drops of propanone in a mortar to release pigments.
3
Spot the extract with a capillary tube on the pencil line.
4
Suspend the paper in solvent with the level below the line and leave until the solvent nears the top.
5
Mark the solvent front, then measure to the centre of each spot.
6
Calculate Rf for each spot.
Rf value
- Rf value larger or less soluble pigments travel less far and have a smaller Rf.
- Carotenoids have the highest Rf (near 1), chlorophyll b the lowest, and chlorophyll a is between them.
Limits
- Limits it identifies pigments but does not give amounts or absorbed wavelengths, which colorimetry can supply.
Part 3 of 10Absorption and action spectra
Absorption spectrum
Absorption spectrum a graph of the absorbance of different wavelengths by a pigment.
Action spectrum
Action spectrum a graph of the rate of photosynthesis at different wavelengths.
- Rates are highest in the blue-violet and red regions and lowest in green-yellow.
Correlation
- Correlation both graphs have two peaks and a trough in green-yellow, which supports the idea that absorbed light drives photosynthesis.
- (blue-violet and red)
Measuring the rate
- Measuring the rate measure oxygen volume or bubbles per minute from pondweed under different colour filters.
- Keep the lamp at the same distance, include a no-filter control and repeat for reliability.
Drawing an action spectrum
Absorption and action spectra
Label the x-axis wavelength / nm from 400 to 700 in 100 nm steps.
Label the y-axis rate of photosynthesis / % of maximum rate, from 0 to 100.
Draw a smooth curve with peaks at both ends and a trough for green.
Part 4 of 10Limiting factors investigation
Organism
- Organism aquatic plants such as Elodea or Cabomba are used because oxygen bubbles can be counted from a cutting.
Variables
- Independent variable is the factor deliberately changed.
- Dependent variable is the factor measured, such as bubbles per minute.
- Control variables are other factors kept constant for validity.
Light intensity
Limiting factors investigation
Place the plant in water with sodium hydrogencarbonate in a tank, with a lamp at a set distance.
Count bubbles over three minutes, or collect gas in a syringe.
Repeat at different lamp distances and take means, or use a data logger.
Controls
- Controls a water tank absorbs lamp heat, LED lamps give off less heat,
- and boiled and cooled water with about 0.1 mol dm−3 sodium hydrogencarbonate keeps carbon dioxide from limiting.
Results
- Results rate rises with light intensity until it levels off, when temperature or carbon dioxide becomes limiting.
- (light is limiting)
Carbon dioxide
- Carbon dioxide add sodium hydrogencarbonate in steps of 0.01 mol dm−3 at constant 25 °C and fixed lamp distance, giving a similar trend.
Temperature
- Temperature vary from 5 to 50 °C with 0.1 mol dm−3 sodium hydrogencarbonate and fixed light.
- Rate rises with kinetic energy and more enzyme-substrate complexes to an optimum, then falls as enzymes denature.
Nature of science
- Nature of science a hypothesis is a provisional explanation needing repeated testing, and careful control of variables is part of experimental design.
Part 5 of 10Carbon dioxide enrichment experiments and photosystems
- Purpose
- they predict future photosynthesis and plant growth under rising carbon dioxide.
| Type | Features |
|---|---|
| Enclosed greenhouse or polytunnel | Light, carbon dioxide, temperature and wavelength can be controlled one at a time, but only small plants fit |
| Free air carbon dioxide enrichment (FACE) | Carbon dioxide is pumped into natural ecosystems so large plants and trees can be studied, but other variables cannot be controlled and are monitored |
- Preliminary research helps identify variables and ways to control them.
Carbon dioxide enrichment experiments and photosystems
Photosystem
Photosystem a cluster of chlorophyll and accessory pigments (carotene, xanthophylls) with a reaction centre, in the thylakoid membrane.
- Photosystem II has reaction centre P680 and photosystem I has P700.
- Photosystem II acts first and is numbered by the order of discovery.
Action
- Action pigments absorb photons and pass the energy to the reaction centre, whose electrons are excited (photoactivated) and passed to an electron acceptor in a reduction.
Advantage of many pigments
- Advantage of many pigments they absorb different wavelengths and excite electrons in a controlled way for the electron transport chain;
- a single pigment could not do this.
| Component | Role |
|---|---|
| Chlorophylls a and b | Absorb blue-violet and red light |
| Carotenoids | Absorb blue-violet light |
| Enzyme proteins | Form ATP from ADP and Pi and reduce NADP+ |
| Electron carriers | Pass electrons along the chain |
Part 6 of 10Light-dependent reactions: photolysis
Location
- Location the thylakoid membrane and lumen, where thylakoids stack up to 100 in grana, with lamellae joining adjacent grana.
- (intermembrane space)
Three processes
- Photolysis in photosystem II splits water.
- Chemiosmosis makes ATP using a proton gradient into the thylakoid space.
- Reduction of NADP+ in photosystem I.
Products
- ATP and reduced NADP pass to the light-independent reaction, and oxygen is a waste product.
Photolysis
- Photolysis the reaction centre of photosystem II acts as an oxidising agent and splits water from the xylem: 2H2O → O2 + 4H+ + 4e−.
- Oxygen leaves via stomata.
- Electrons replace those lost from photosystem II and enter the electron transport chain.
- Protons add to the proton gradient and reduce NADP.
NADP notation
- NADP notation use NADP and reduced NADP, or NADP+ and NADPH, consistently.
Part 7 of 10Oxygen and Earth's history
1
Early Earth
- Early Earth the first life was about 4 billion years ago in an atmosphere with no oxygen.
2
Great Oxidation Event
- Great Oxidation Event photosynthetic prokaryotes from about 3.5 billion years ago released oxygen,
- and atmospheric oxygen reached 2% about 2.2 billion years ago.
3
Effects on Earth
- Dissolved iron in the oceans was oxidised to red iron oxide that formed banded iron formations, a major source of iron ore.
- Methane and carbon dioxide levels fell, causing an ice age.
- By 600 million years ago, large photosynthetic multicellular organisms raised oxygen to 20%, peaking at 35% about 300 million years ago.
- The present level is about 21%, with human activity such as burning fossil fuels and deforestation affecting it.
Part 8 of 10Photophosphorylation and chemiosmosis
- Cyclic photophosphorylation uses photosystem I only.
1
Light excites an electron in P700 (photoactivation).
2
An electron acceptor takes it and it passes along carriers.
3
Energy released pumps protons from the stroma into the thylakoid lumen.
4
The electron returns to photosystem I.
5
The proton gradient drives ATP synthesis by chemiosmosis, and no reduced NADP is made.
- Non-cyclic photophosphorylation uses both photosystems.
1
Photosystem II electrons are excited and passed to an acceptor.
2
They pass down the electron carriers, releasing energy to pump protons.
3
They reach photosystem I, are excited again and pass to ferredoxin.
4
Reduced ferredoxin and protons reduce NADP+ to NADPH: NADP+ + 2H + 2e− → NADPH + H+.
5
Photolysis replaces the electrons lost by photosystem II.
Photophosphorylation and chemiosmosis
Chemiosmosis
- Protons flow down the gradient through ATP synthase, and the energy released phosphorylates ADP.
- Photolysis adds to the proton gradient.
Cyclic compared with non-cyclic
- Cyclic uses only photosystem I and makes no reduced NADP.
- Non-cyclic uses both photosystems and makes ATP, reduced NADP and oxygen.
Part 9 of 10Calvin cycle (light-independent reactions)
1
Location
- Location the stroma, which holds the enzymes.
2
Fixation of carbon
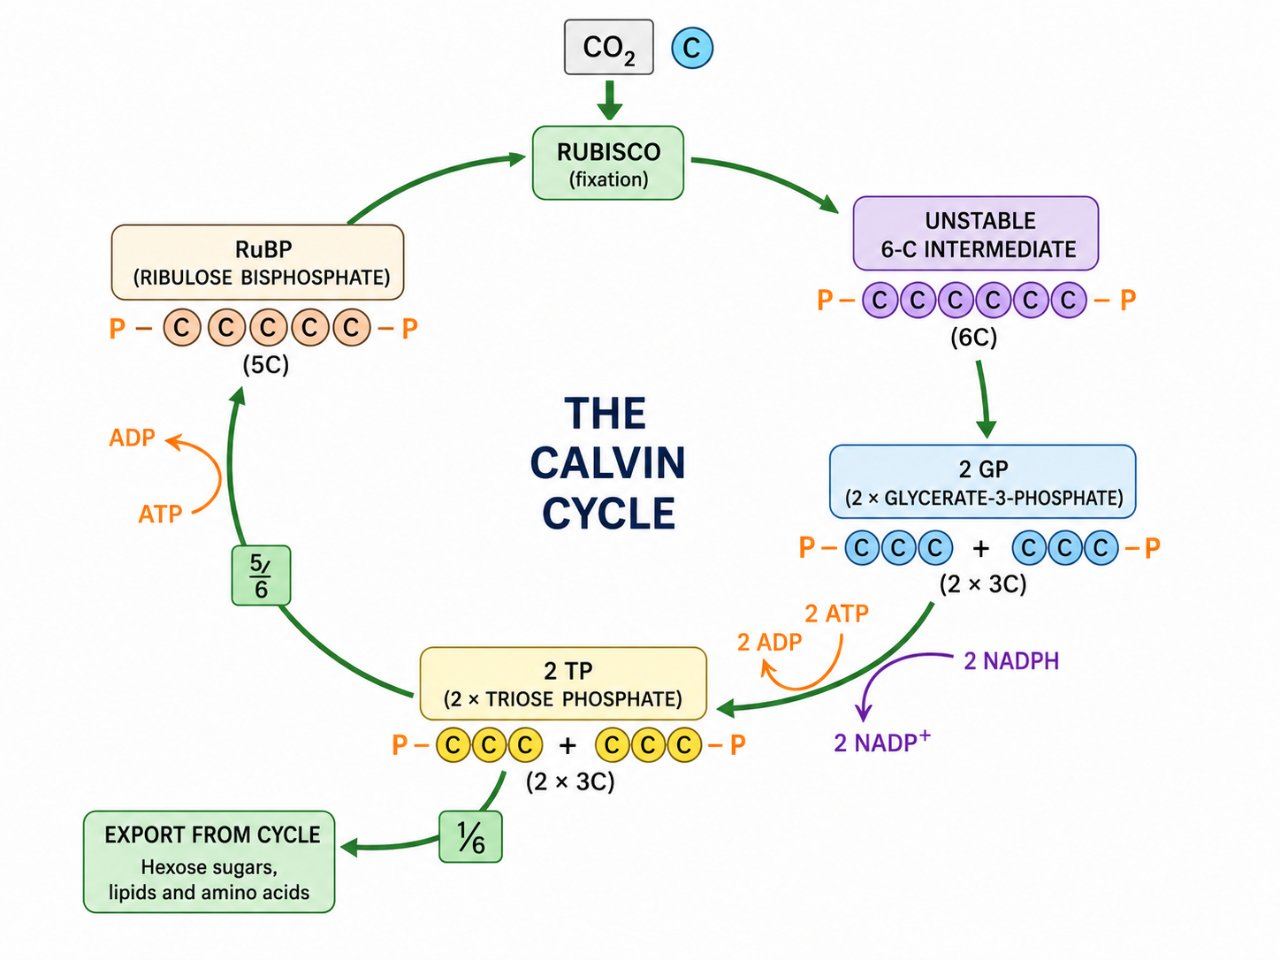
- Fixation of carbon rubisco combines CO2 with ribulose bisphosphate (RuBP, 5C) to give an unstable 6C compound that splits into two glycerate-3-phosphate (GP, 3C).
- Rubisco is the most abundant enzyme and is slow, so much is needed, and it works poorly at low CO2.
3
Reduction
- GP is reduced to triose phosphate (TP) using ATP and reduced NADP.
4
Regeneration
- Regeneration five-sixths of TP regenerates RuBP using ATP, with five TP forming three RuBP.
5
Use
- Use one-sixth of TP forms other compounds.
- Hexose phosphates make starch, sucrose or cellulose.
- Glycerol and fatty acids make lipids and membranes.
- Amino acids are made using nitrate or ammonium ions.
6
Anabolic and endergonic
- Anabolic and endergonic the cycle hydrolyses ATP and oxidises reduced NADP.
7
One glucose needs six turns of the cycle, and three RuBP give six TP of which five regenerate RuBP.
8
Other compounds
- TP can pass through glycolysis and the link reaction to make acetyl CoA for fatty acids, or make glycerol that joins fatty acids as triglycerides.
Part 10 of 10Interdependence of the reactions
Dependence
- Dependence neither stage can occur without the other.
- ATP and reduced NADP from the light-dependent stage drive the Calvin cycle.
- NADP is returned to the thylakoids to accept electrons.
Light intensity
- In low light, products form slowly and the conversion of GP to TP is limited.
- In high light, more products form, but the rate is restricted if NADP is not returned fast enough.
Hydrogen carbonate
- CO2 as HCO3− accepts protons from photosystem II during photolysis and helps the electron transport chain.
- A lack of CO2 prevents fixation and also stops photosystem II working.
Key terms
| Term | Meaning |
|---|---|
| Photolysis | splitting of water by light energy in photosystem II. |
| Photosystem | a cluster of pigments with a reaction centre in the thylakoid membrane. |
| Photophosphorylation | formation of ATP using light energy and an electron transport chain. |
| Rubisco | the enzyme that fixes carbon dioxide onto RuBP. |
| Calvin cycle | the light-independent reactions that fix carbon dioxide into triose phosphate. |
| Action spectrum | a graph of the rate of photosynthesis against wavelength. |
| Rf value | distance moved by a pigment divided by distance moved by the solvent front. |
| Chemiosmosis | ATP synthesis driven by proton flow through ATP synthase. |
Avoid these mistakes
1
Oxygen from photosynthesis comes from carbon dioxide — it comes from the photolysis of water.
2
Plants absorb green light best — green is mostly reflected, and chlorophylls absorb blue-violet and red.
3
Cyclic photophosphorylation makes reduced NADP — it makes ATP only.
4
The light-independent stage works in the dark indefinitely — it depends on ATP and reduced NADP from the light-dependent stage.
Marked practiceQuizzes for this lesson
Last updated:
Biology 0610 & 9700 Exam Model
Limiting Factors Master
Photosynthesis: Limiting Factors & Graph Plateau
6CO2 + 6H2O → C6H12O6 + 6O2 (Light & Chlorophyll required)
- Limiting Factor Definition: Something present in the environment in such short supply that it restricts life processes.
- Graph Plateau: When rate levels off as light intensity increases, light is no longer the limiting factor; CO2 concentration or temperature has become limiting.
- High Temperature Drop: Beyond optimum temp (~40°C), enzymes (e.g. RuBisCO) denature, permanently decreasing rate.