C1.3Theme C — Interaction and interdependence
Photosynthesis — IB Biology SL Revision Notes & Topical Questions
5 min read 12 parts Lesson 4 of 9 3 quizzes
Curriculum Equation Key معادلة البناء الضوئي الموزونة - Balanced Photosynthesis EquationFast Exam Solution
6CO₂ + 6H₂O ➔ C₆H₁₂O₆ + 6O₂
Word Equation & Conditions: Carbon Dioxide + Water (+ Light & Chlorophyll) -> Glucose + Oxygen | ثاني أكسيد الكربون + ماء (في وجود الضوء والكلوروفيل) ← جلوكوز + أكسجين
Location & Specifications: البلاستيدات الخضراء (Chloroplast): التفاعلات الضوئية في الثايلاكويد، ودورة كالفن في الستروما.
Lesson summary
C1.3 Photosynthesis — IB BIOLOGY SL notes: Describe photosynthesis as an energy conversion, the roles of pigments, and how its rate is investigated and limited.Photosynthesis = the conversion of simple inorganic compounds into complex organic ones using light energyIt occurs in p…
- Photolysis
- Fate of glucose
- Link with respiration
- Atmosphere
- Absorption
- Carotenoids
Section 1 of 12Photosynthesis as energy conversion
Photosynthesis
Photosynthesis the conversion of simple inorganic compounds into complex organic ones using light energy
- It occurs in plants, algae and cyanobacteria.
- Light energy is converted to chemical energy stored in the bonds of organic compounds in biomass.
- Energy is never created or destroyed, only converted.
Equations
- Word equationcarbon dioxide + water → glucose + oxygen.
- Symbol equation6CO2 + 6H2O → C6H12O6 + 6O2.
Photolysis
- Photolysis water is split, the oxygen is released as a waste product and the hydrogen is used to reduce carbon dioxide to glucose
- The oxygen released comes from water and not from CO2.
Fate of glucose
- Fate of glucose respiration, starch storage, cellulose, and conversion to amino acids and lipids
Link with respiration
- Link with respiration glucose and oxygen are the reactants of aerobic respiration,
- whereas carbon dioxide and water from respiration are the reactants of photosynthesis
Atmosphere
- Atmosphere photosynthesis made the Earth's atmosphere oxygen-rich
Section 2 of 12Photosynthetic pigments
| Pigment | Group | Own colour | Main light absorbed | Typical Rf |
|---|---|---|---|---|
| Chlorophyll a | Chlorophyll | Blue-green | Blue-violet and red | Middle |
| Chlorophyll b | Chlorophyll | Yellow-green | Blue-violet and red | Low |
| Carotene | Carotenoid | Orange | Blue-violet | Near 1 |
| Xanthophyll | Carotenoid | Yellow | Blue-violet | Fairly high |
Absorption
- Absorption absorbed light excites electrons and starts the reactions of photosynthesis
- The chemical structure of a pigment decides the wavelengths it absorbs.
Carotenoids
- Carotenoids surround the chlorophyll and widen the range of wavelengths that can be used
Pigment colour
- Pigment colour the colour of a pigment is the light it reflects and not the light it absorbs
- Green light is mostly reflected, so leaves look green.
Section 3 of 12Separating pigments by chromatography
- Chromatography = a technique that separates a mixture because its components travel at different speeds
- The solvent is the mobile phase and the paper or silica is the stationary phase.
- Thin-layer chromatography runs faster and separates more sharply than paper.
1
Draw a pencil line about 1 cm above the bottom of the paper, because ink would itself separate.
2
Grind a piece of healthy sunlit leaf with propanone, which dissolves membranes and releases the pigments.
3
Spot the extract on the pencil line with a capillary tube, repeating to build up concentration.
4
Suspend the paper in the solvent with the solvent level below the line.
5
Remove the paper when the solvent nears the top and mark the solvent front in pencil.
6
Measure the distance from the origin to the centre of each spot.
7
Calculate the Rf value for each pigment.
Section 4 of 12Rf values
Rf
Rf distance moved by the pigment divided by distance moved by the solvent front
- It has no units and is always less than 1.
- A pigment that is more soluble in the solvent travels further and has a larger Rf.
- A pigment with a stronger attraction to the stationary phase, or a larger molecule, has a smaller Rf.
Pigments in order
- Pigments in order carotenoids have the highest Rf, then chlorophyll a, then chlorophyll b with a much lower value
Limitations
- Chromatography shows identity only and not the amount of each pigment.
- Colorimetry gives amounts and the wavelengths absorbed.
Section 5 of 12Absorption and action spectra
Absorption spectrum
Absorption spectrum a graph of the absorbance of different wavelengths by a pigment
Action spectrum
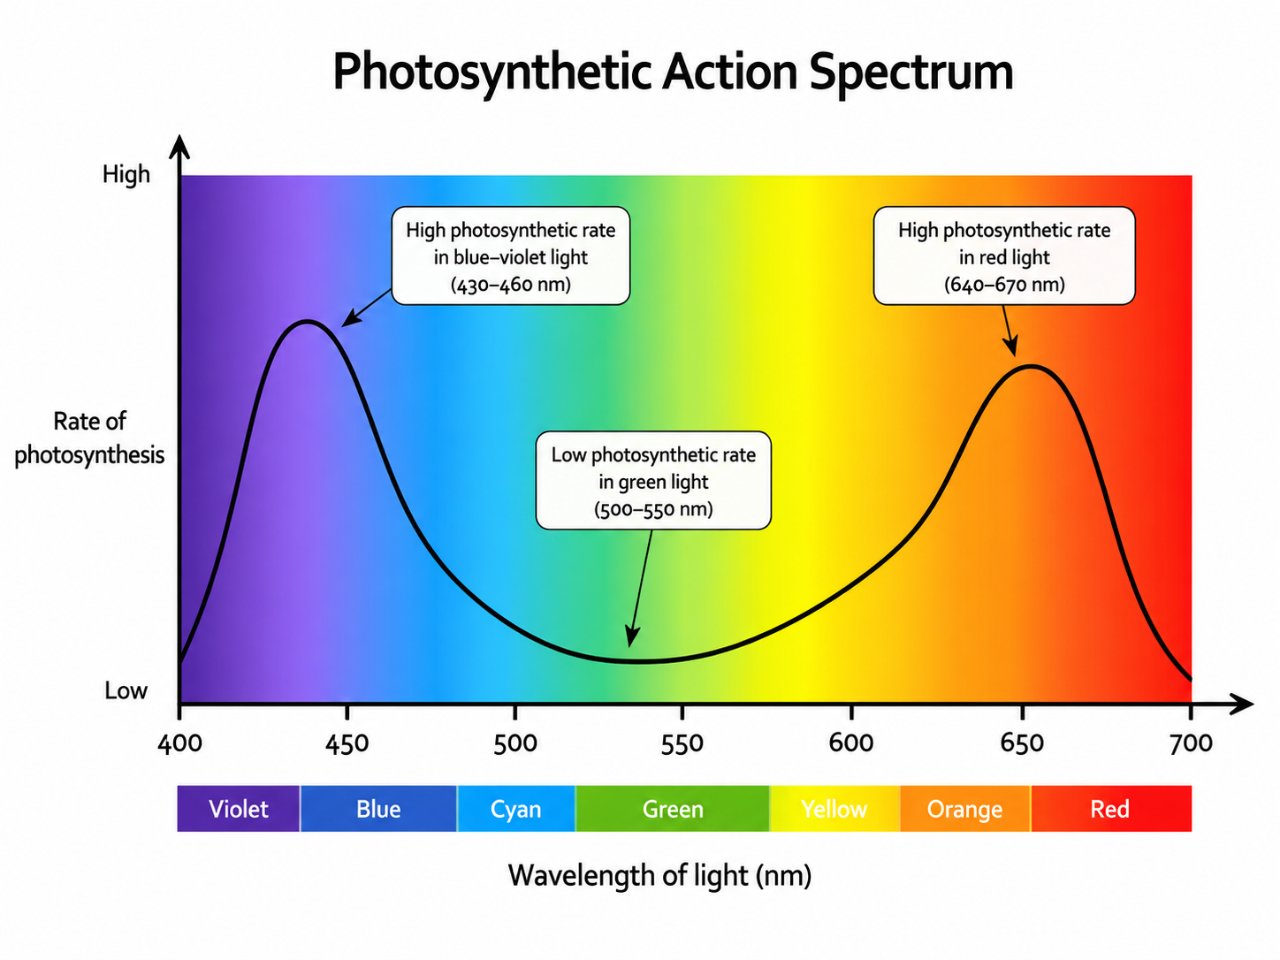
Action spectrum a graph of the rate of photosynthesis at different wavelengths
| Feature | Absorption spectrum | Action spectrum |
|---|---|---|
| Measures | Light absorbed | Rate of photosynthesis |
| Peaks | Blue-violet and red | Blue-violet and red |
| Low point | Green | Green, but not zero |
| Shows | Pigment properties | Which light drives the process |
- Correlation
- the two curves match closely, showing that the light absorbed drives photosynthesis
Section 6 of 12Measuring and drawing an action spectrum
1
Measure the volume of oxygen produced, or the CO2 consumed, by pondweed under different colour filters.
2
Keep the lamp at the same distance each time.
3
Include a white-light control with no filter.
4
Repeat several times for reliability.
Axes
- The x-axis is wavelength / nm from 400 to 700 in 100 nm steps.
- The y-axis is rate of photosynthesis as a percentage of the maximum, from 0 to 100.
Curve
- Curve smooth, with peaks at the blue and red ends and a trough for green light
Section 7 of 12Limiting factors
- Limiting factor
- the factor in shortest supply sets the rate, and raising a non-limiting factor has no effect
| Feature | Light intensity | CO2 concentration | Temperature |
|---|---|---|---|
| Role | Supplies energy | Carbon source | Affects enzyme rates |
| Low values | Little energy and a slow rate | Little fixation and a slow rate | Slow enzymes |
| Rising values | Rate rises then plateaus | Rate rises then plateaus | Rate rises to an optimum |
| Very high values | Plateau as another factor limits | Plateau | Enzymes denature and the rate falls |
| Controlled with | Lamp distance and filters | Hydrogencarbonate solution | Water bath |
Hypothesis
- Hypothesis a provisional explanation that is supported or refuted by repeated testing
Variables
- Variables one independent variable, one dependent variable and all others controlled
Section 8 of 12Investigating light intensity
- Organism
- aquatic Elodea or Cabomba, since oxygen bubbles can be seen and counted
1
Place a piece of the plant in a beaker or boiling tube of water.
2
Add sodium hydrogencarbonate so the CO2 concentration is about 0.1 mol dm-3 and not limiting.
3
Place a lamp at a set distance from the plant.
4
Count the bubbles released in three minutes.
5
Repeat for different distances and at least twice at each distance.
6
Plot bubbles per minute against light intensity.
Controlling temperature
- Controlling temperature a glass tank of water absorbs heat from the lamp, and LED lamps give off less heat
Improvements
- Improvements a gas syringe to collect the volume of gas, repeats to get a mean and a data logger for continuous results
Result
- Result the rate rises with light intensity until it levels off, when temperature or CO2 becomes limiting
Section 9 of 12Investigating CO2 and temperature
Carbon dioxide
- Start with boiled and cooled water to remove dissolved CO2.
- Add sodium hydrogencarbonate in steps of 0.01 mol dm-3 and record the bubbles per minute.
- Keep the temperature at 25 °C in a water bath and the lamp at a fixed distance.
Temperature
- Fix the hydrogencarbonate at about 0.1 mol dm-3 and vary the temperature from 5 to 50 °C in water baths.
- The rate rises with kinetic energy and enzyme-substrate collisions up to the optimum.
- Above the optimum, around 40 °C, enzymes denature and the rate falls.
Preliminary trials
- Preliminary trials background research identifies the variables that must be controlled
Section 10 of 12Carbon dioxide enrichment experiments
- Purpose
- predict plant growth and photosynthesis as atmospheric CO2 rises with climate change
| Feature | Enclosed greenhouse | FACE |
|---|---|---|
| Setting | Artificial enclosure or polytunnel | Natural ecosystem |
| Plant size | Small species only | Includes trees |
| Variables | Controlled | Monitored only |
| Realism | Lower | Higher |
- FACE (free air carbon dioxide enrichment)
- CO2 is released over field plots in a natural ecosystem
- Findings often show higher growth, but gains are limited by nitrogen and water.
- The experiments are expensive, other variables cannot be controlled and there are few sites.
Section 11 of 12Key terms
| Term | Meaning |
|---|---|
| Photosynthesis | The conversion of light energy to chemical energy stored in organic compounds made from CO2 and water. |
| Absorption spectrum | A graph of the light absorbed by a pigment at different wavelengths. |
| Action spectrum | A graph of the rate of photosynthesis at different wavelengths. |
| Rf value | The distance moved by a pigment divided by the distance moved by the solvent front. |
| Carotenoid | A pigment group that absorbs mainly blue-violet light and passes energy to chlorophyll. |
| Limiting factor | The factor in shortest supply that sets the rate of a process. |
| FACE experiment | A field experiment that enriches the air of a natural ecosystem with CO2. |
| Photolysis | The splitting of water in photosynthesis, releasing oxygen. |
Section 12 of 12Exam technique
1
Saying the oxygen released comes from carbon dioxide — it comes from the splitting of water
2
Saying a pigment absorbs the colour it appears — it reflects that colour
3
Using a pen for the origin line in chromatography — pencil is used because ink would separate
4
Saying photosynthesis creates energy — light energy is converted to chemical energy
Marked practiceQuizzes for this lesson
Last updated:
Biology 0610 & 9700 Exam Model
Limiting Factors Master
Photosynthesis: Limiting Factors & Graph Plateau
6CO2 + 6H2O → C6H12O6 + 6O2 (Light & Chlorophyll required)
- Limiting Factor Definition: Something present in the environment in such short supply that it restricts life processes.
- Graph Plateau: When rate levels off as light intensity increases, light is no longer the limiting factor; CO2 concentration or temperature has become limiting.
- High Temperature Drop: Beyond optimum temp (~40°C), enzymes (e.g. RuBisCO) denature, permanently decreasing rate.