3.3.2Stoichiometry
Sound and Oscilloscopes — Cambridge IGCSE Chemistry 0620 Revision Notes & Topical Questions
5 min read 4 parts Lesson 24 of 28 Unit quiz
Curriculum Equation Key Wave Speed & Doppler Effect FormulasFast Exam Solution
v = f × λ | f_obs = f × (v ± v_o) / (v ∓ v_s) | T = 1 / f
Section 1 of 4Reading the Display
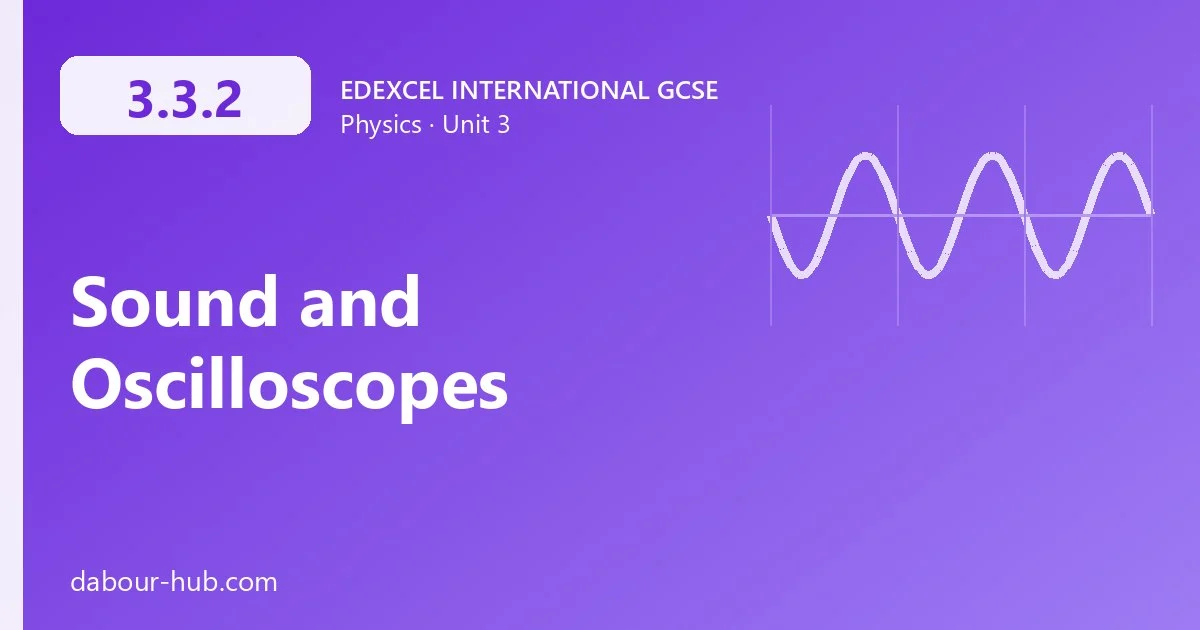
An oscilloscope draws a sound wave as a trace, so the screen axes have different meanings from a real wave diagram.
Horizontal axis
- The horizontal axis is the time base, so a full cycle of the trace can be used to measure the time period.
Vertical axis
- The height of the trace from the centre line is related to the amplitude of the sound wave.
Number of waves
- The number of complete waves across the screen is related to the frequency of the sound.
Longitudinal display
- A longitudinal sound wave is displayed as a transverse-looking trace, even though the air particles move parallel to the wave.
Section 2 of 4Pitch and Loudness
Pitch and Loudness
Pitch
- Pitch depends on frequency, so a sound with a higher frequency has a higher pitch.
Loudness
- Loudness depends on amplitude, so a sound with a larger amplitude is louder.
Changing frequency
- Changing the frequency alone changes the pitch of the sound but not its loudness.
Hearing range
- Humans can hear frequencies from 20 Hz to 20 000 Hz, with infrasound below and ultrasound above this range.
Section 3 of 4Comparing Two Traces
1
Find the time period of each trace by measuring the time for one full wave across the grid.
2
A trace with a shorter time period has a higher frequency and therefore a higher pitch.
3
A trace with a greater height from the centre line has a larger amplitude and is therefore louder.
4
Compare the two traces for both spacing and height before drawing any conclusion about the sounds.
Section 4 of 4Exam Checklist & Tips
3.3.2 – Key Points for the Exam
- Oscilloscope A device that displays a rapidly changing signal, such as a sound wave, as a trace on a screen.
- Time base The horizontal scale of an oscilloscope, used to measure the time period of a wave.
- Amplitude The maximum displacement of a wave from its rest position, which determines the loudness of a sound.
- Pitch How high or low a sound is perceived to be, which depends on its frequency.
- Infrasound Sound with a frequency below 20 Hz, which humans cannot hear.
- Ultrasound Sound with a frequency above 20 000 Hz, which humans cannot hear.
Common Mistakes
- Assuming that a wave with a larger amplitude has a higher pitch; amplitude affects loudness, not pitch.
- Confusing loudness with pitch when comparing two traces.
- Describing a sound of 25 000 Hz as audible; frequencies above 20 000 Hz are ultrasound.
- Treating the time base as the vertical scale; the time base is the horizontal axis.
Last updated:
\n