1.5Chapter 1: The Particle Model and States of Matter
Investigating boiling points — Alhussan Chemistry - Stage 7 Revision Notes & Topical Questions
5 min read 8 parts Lesson 5 of 8 3 quizzes
1.5 Investigating boiling points — Experimental Heating Curves — Alhussan International Academy — Chemistry (Stages 7–9) notes: Plan an investigation into boiling point, interpret a heating curve and data tables, and explain why boiling point matters.Hypothesis = a possible expla…
- Anomalous result
- Prediction
- Limitation
- Improvements
- Sloping line
- Flat line at the boiling point
Part 1 of 5Making a hypothesis and collecting evidence
- Rabia's hypothesisthe higher the altitude (height above sea level), the lower the boiling point of water.
- Testable evidence can be collected,
- so Rabia asked relatives in other places to measure the boiling temperature of water and found altitudes on the Internet.
- One measurement in Mumbai alone is not enough evidence.
- Recording results go in a table so all the data are easy to see, then a line graph makes the pattern easier to spot.
Part 2 of 5Analysing the evidence
| Place | Altitude (m) | Boiling temperature of water (°C) |
|---|---|---|
| Chennai or Mumbai, India | 0 | 100 |
| Jos, Nigeria | 1200 | 96 |
| Srinagar, India | 1585 | 95 |
| Leh, India | 3524 | 88 |
| Summit of Puncak Jaya, Indonesia | 4884 | 83 |
| Summit of Mount Everest, Nepal | about 8850 | 69 |
- Pattern as altitude increases, the boiling temperature of water decreases, which supports the hypothesis.
- The reading for Riyadh (40 °C at 610 m) was wrong because the air temperature was measured, not the boiling temperature,
- so it is left out and the reason given.
- Prediction reading the graph at 2400 m (Addis Ababa) gives a boiling temperature of about 93 °C.
- Limitation the investigation does not explain why boiling temperatures differ at different altitudes,
- because lower air pressure at height lets water boil at a lower temperature.
- Precision three pots boiled in Srinagar gave the same temperature each time, so the data are precise.
- Improvements repeat the experiment three times and use thermometers with a suitable range and small scale divisions.
Part 3 of 5Reading a heating curve
- Axes plot temperature on the y-axis against time on the x-axis.
- Sloping line the temperature rises as energy from the heater makes particles move faster, so their average kinetic energy increases.
- Flat line at the boiling point the temperature does not change although heating continues.
- The energy is used to separate the particles, not to speed them up.
- Pure substances they have a sharp, fixed boiling point, for example 100 °C for water at normal atmospheric pressure,
- while a mixture boils over a range of temperatures.
- Method find where the line becomes flat, read the temperature from the y-axis, and explain the flat line in terms of energy and particles.
Part 4 of 5Accuracy and reliability
- Sources of error reading the scale from the wrong angle, heat lost to the surroundings, and a thermometer touching the bottom of the beaker,
- which is hotter than the liquid.
- A lid or insulation reduces heat loss.
- Variables the independent variable is time, the dependent variable is temperature and control variables include the volume of liquid and the heat source.
Part 5 of 5Why the boiling point matters
- Identification boiling points are used to identify substances by comparing with data-book values.
- Purity impurities, such as dissolved salt in water, raise the boiling point slightly.
- A boiling point different from the data-book value suggests the sample is not pure.
Key terms
| Term | Meaning |
|---|---|
| Hypothesis | A possible explanation based on evidence that can be tested further. |
| Anomalous result | A result that does not fit the pattern. |
| Altitude | Height above sea level. |
| Heating curve | A graph of temperature against time while a substance is heated. |
| Boiling point | The temperature at which a liquid boils. |
| Precise | Giving results that are close together when repeated. |
Avoid these mistakes
Marked practiceQuizzes for this lesson
?What do you want to solve now?
✓Checkpoint Quiz
1 written questions from real exam papers on this lesson.
Written question 1 of 1 · part (a) (1 / 3) 3:00
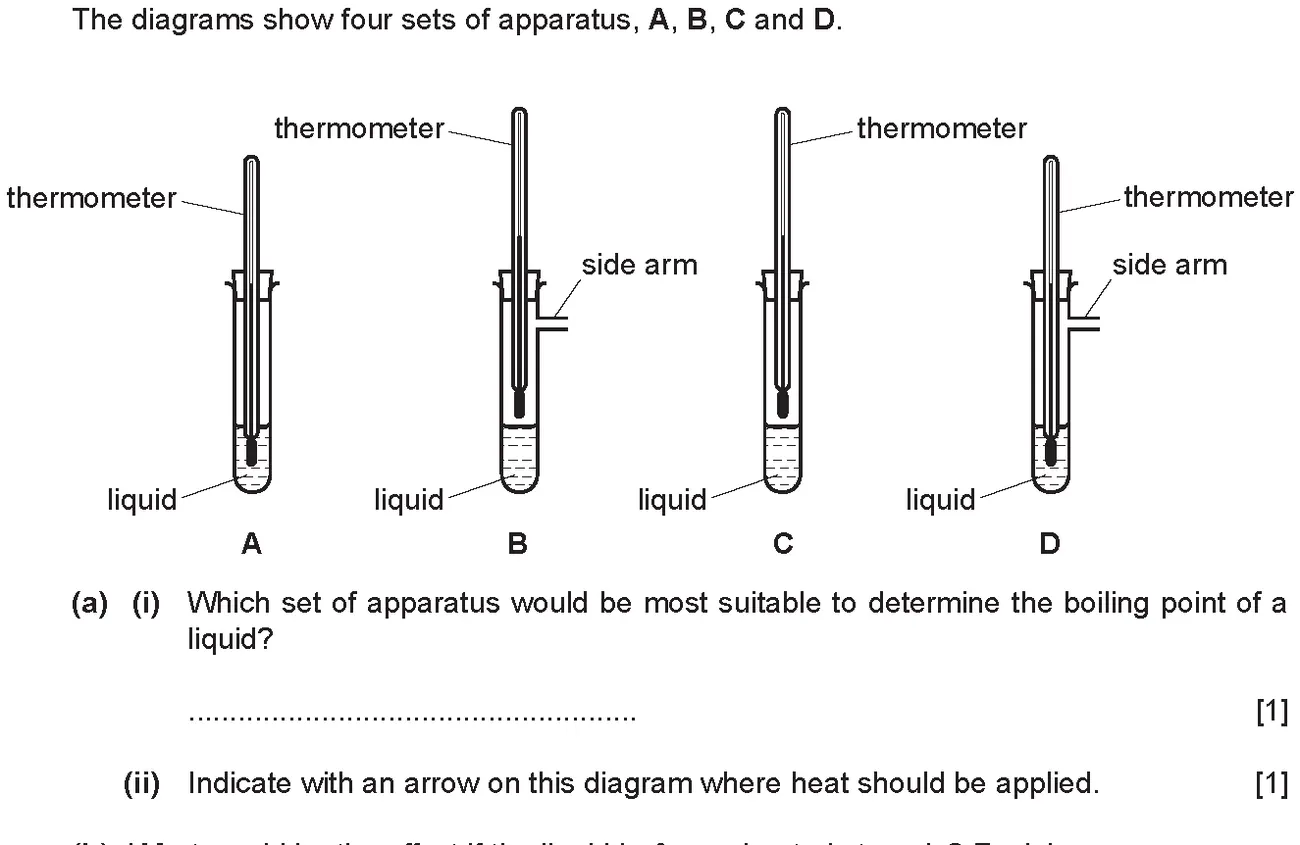
Show the answer
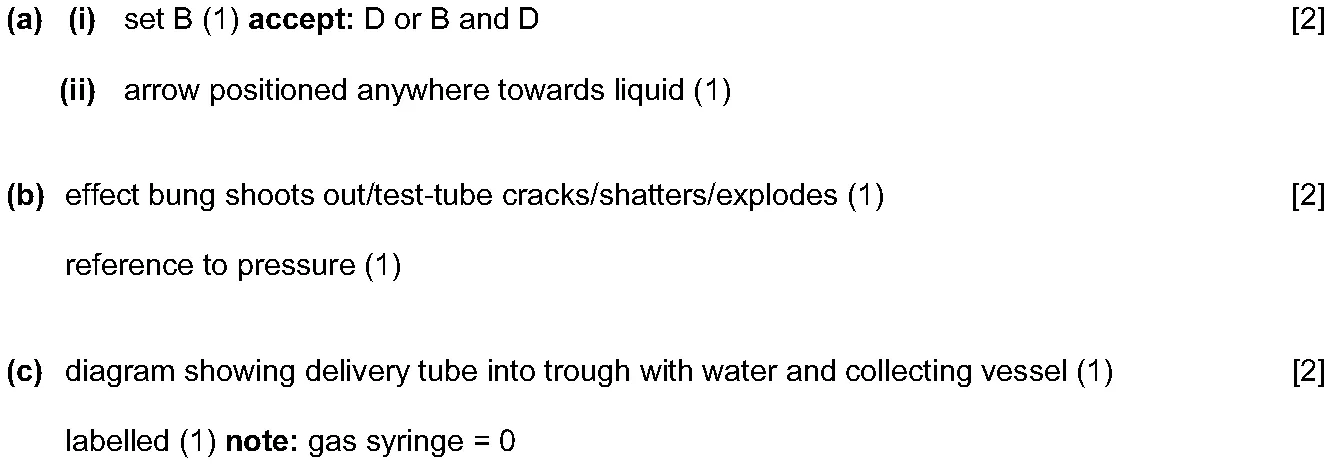
Written question 1 of 1 · part (b) (2 / 3) 3:00
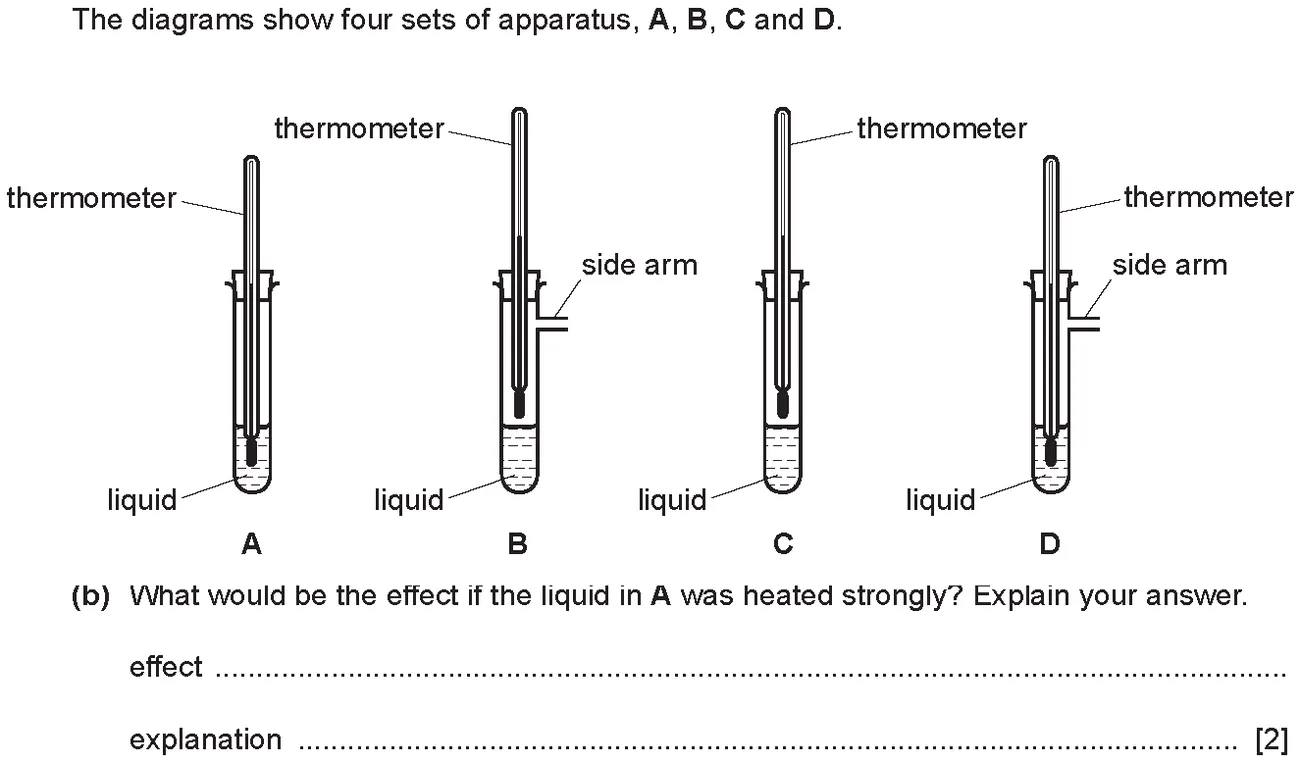
Show the answer
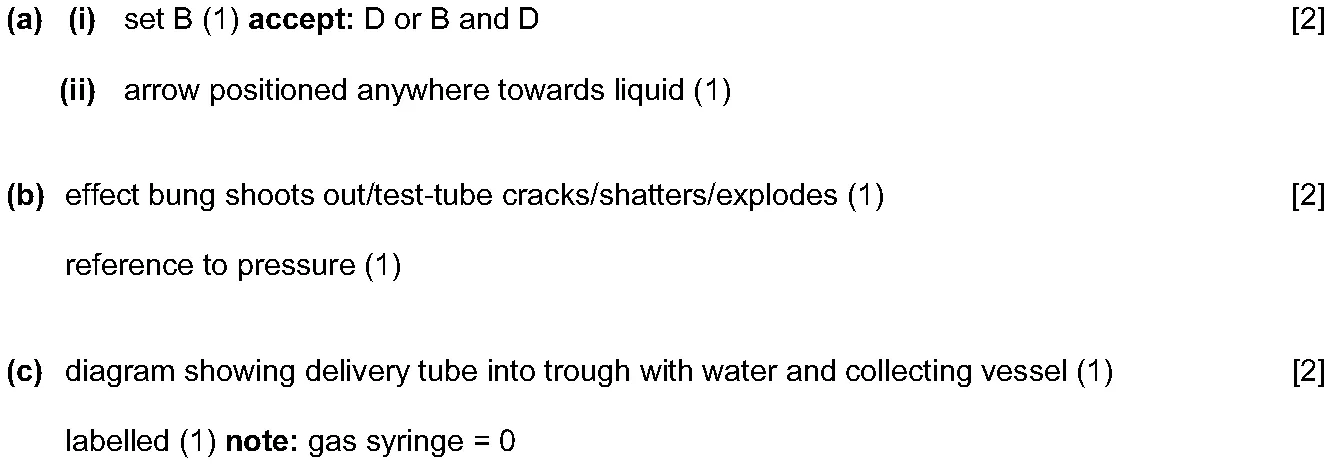
Written question 1 of 1 · part (c) (3 / 3) 3:00
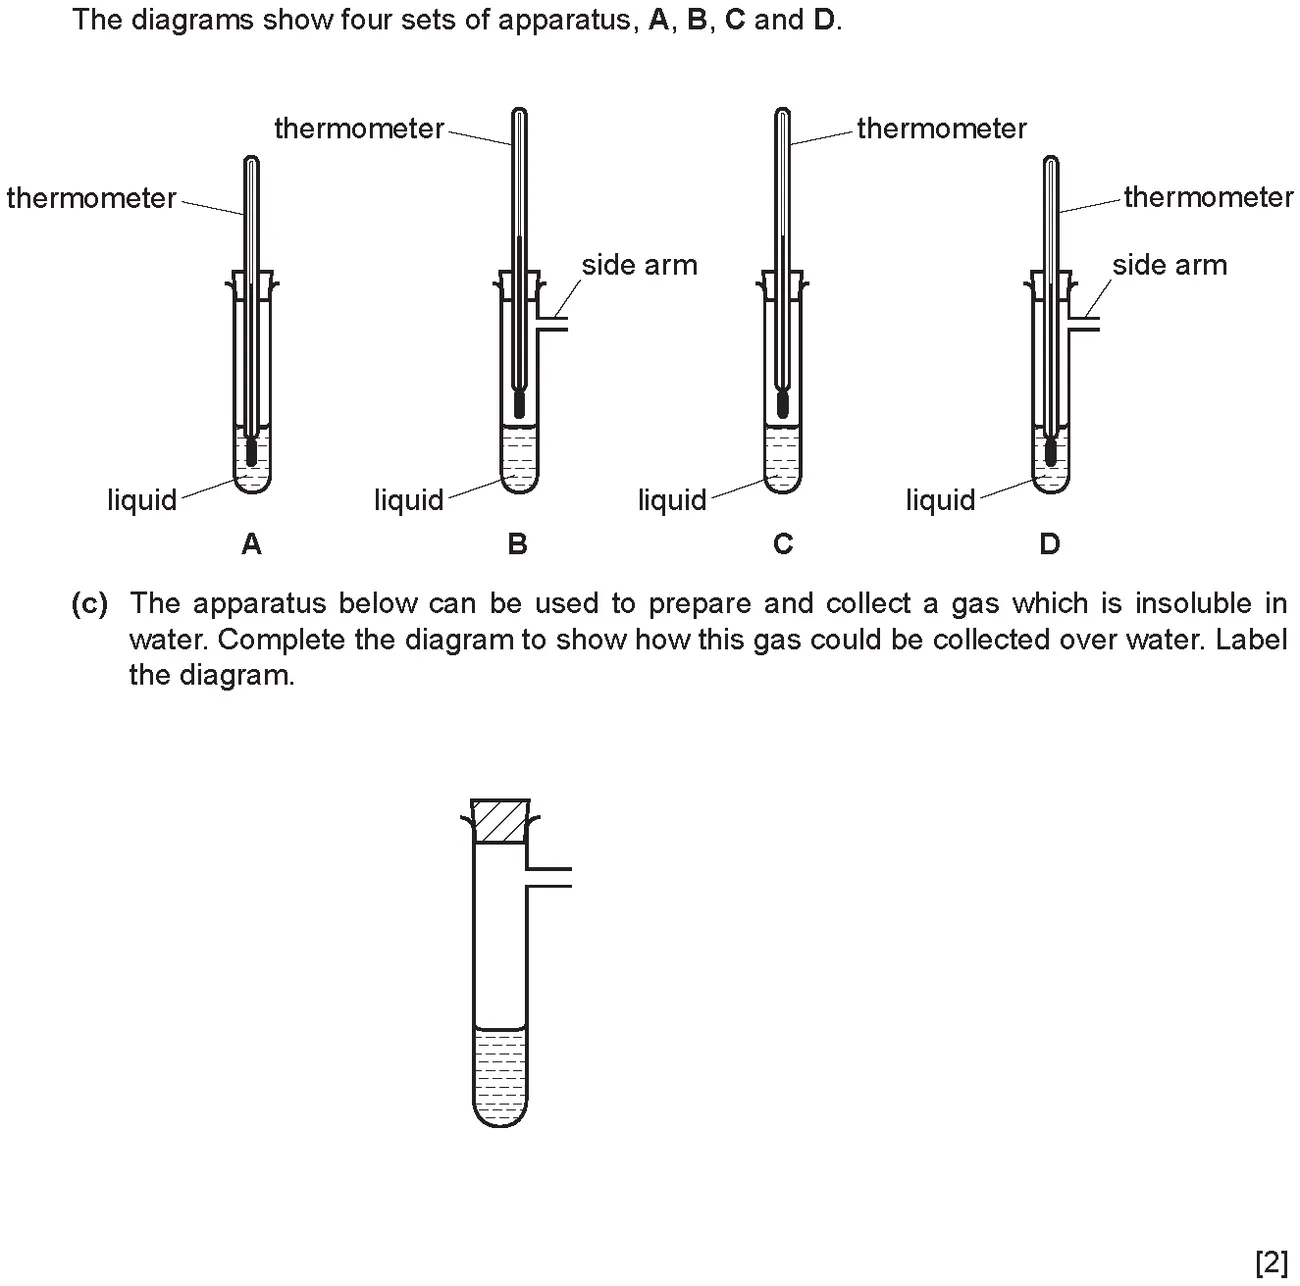
Show the answer
Each part of a written question is on its own screen. Write your answer first, then open "Show the answer" to check it against the mark scheme.
Last updated: