Physical Chemistry and Transition Elements
OCR A Level Chemistry A — 5.3 Acids, Bases and Buffers — OCR A Level Chemistry A H432 Revision Notes & Topical Questions
5 min read 6 parts Lesson 23 of 40
Curriculum Equation Key pH & Acid-Base Equilibrium FormulasFast Exam Solution
pH = -log[H⁺] | pOH = -log[OH⁻] | pH + pOH = 14 | [H⁺][OH⁻] = 10⁻¹⁴
Word Equation & Conditions: pH + pOH = 14
Lesson summary
5.3 Acids, Bases and Buffers — choosing titration indicators: link an indicator's colour-change range to the steep pH change near the equivalence point. An acid–base indicator is often a weak acid whose acid form and conjugate base have different colours.
- Decision method
Part 1 of 6Why an indicator changes colour
Why an indicator changes colour
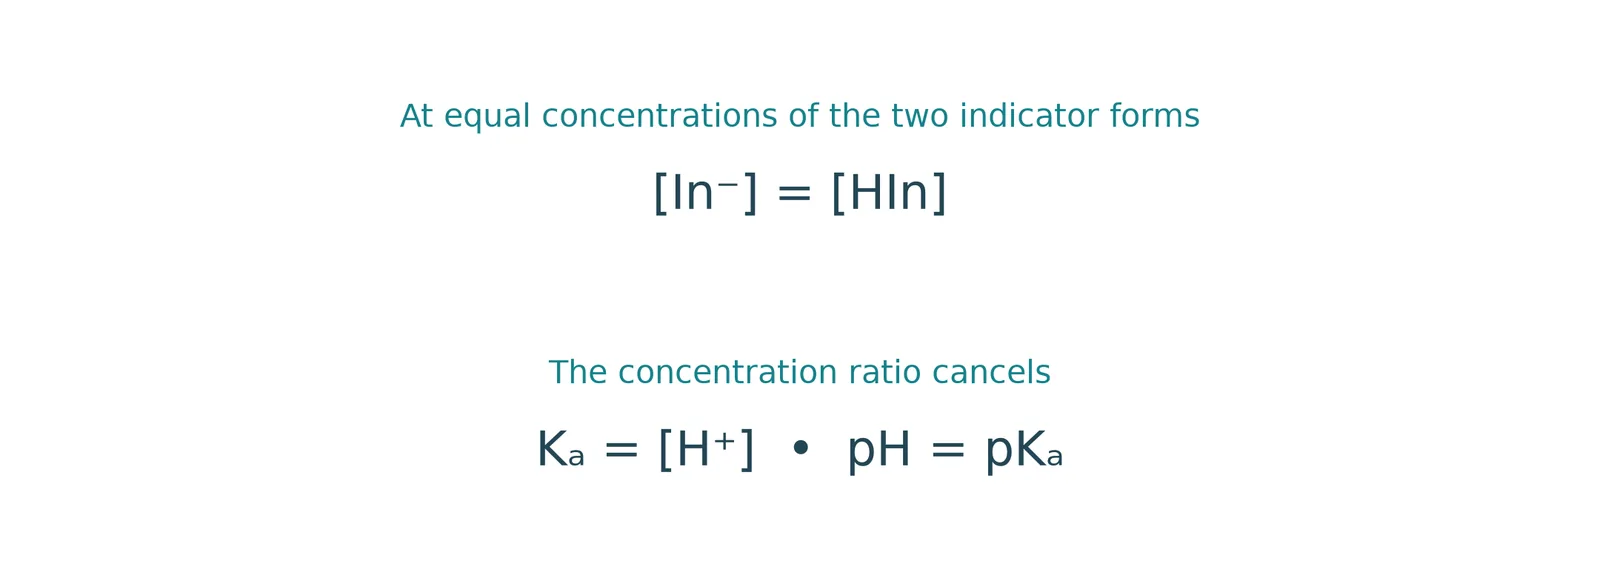
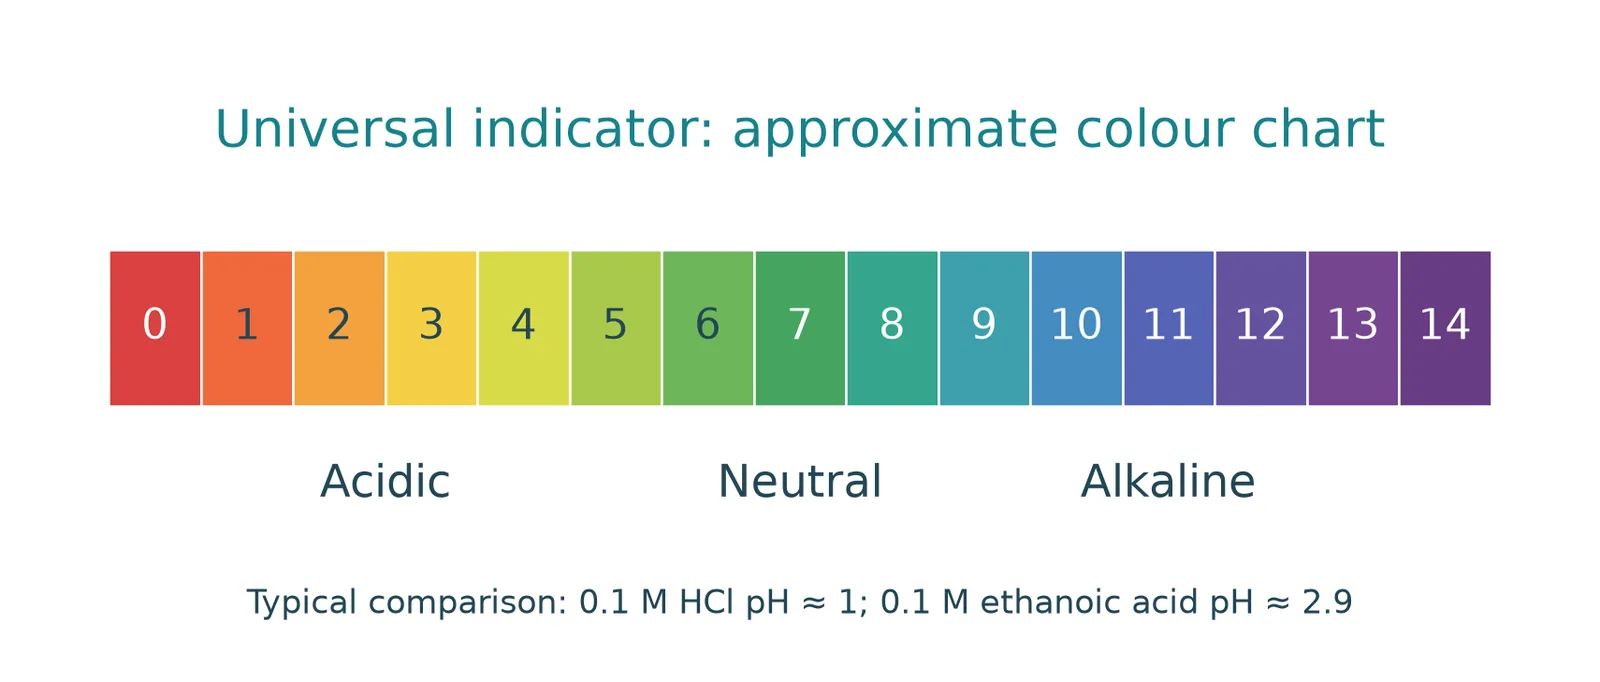
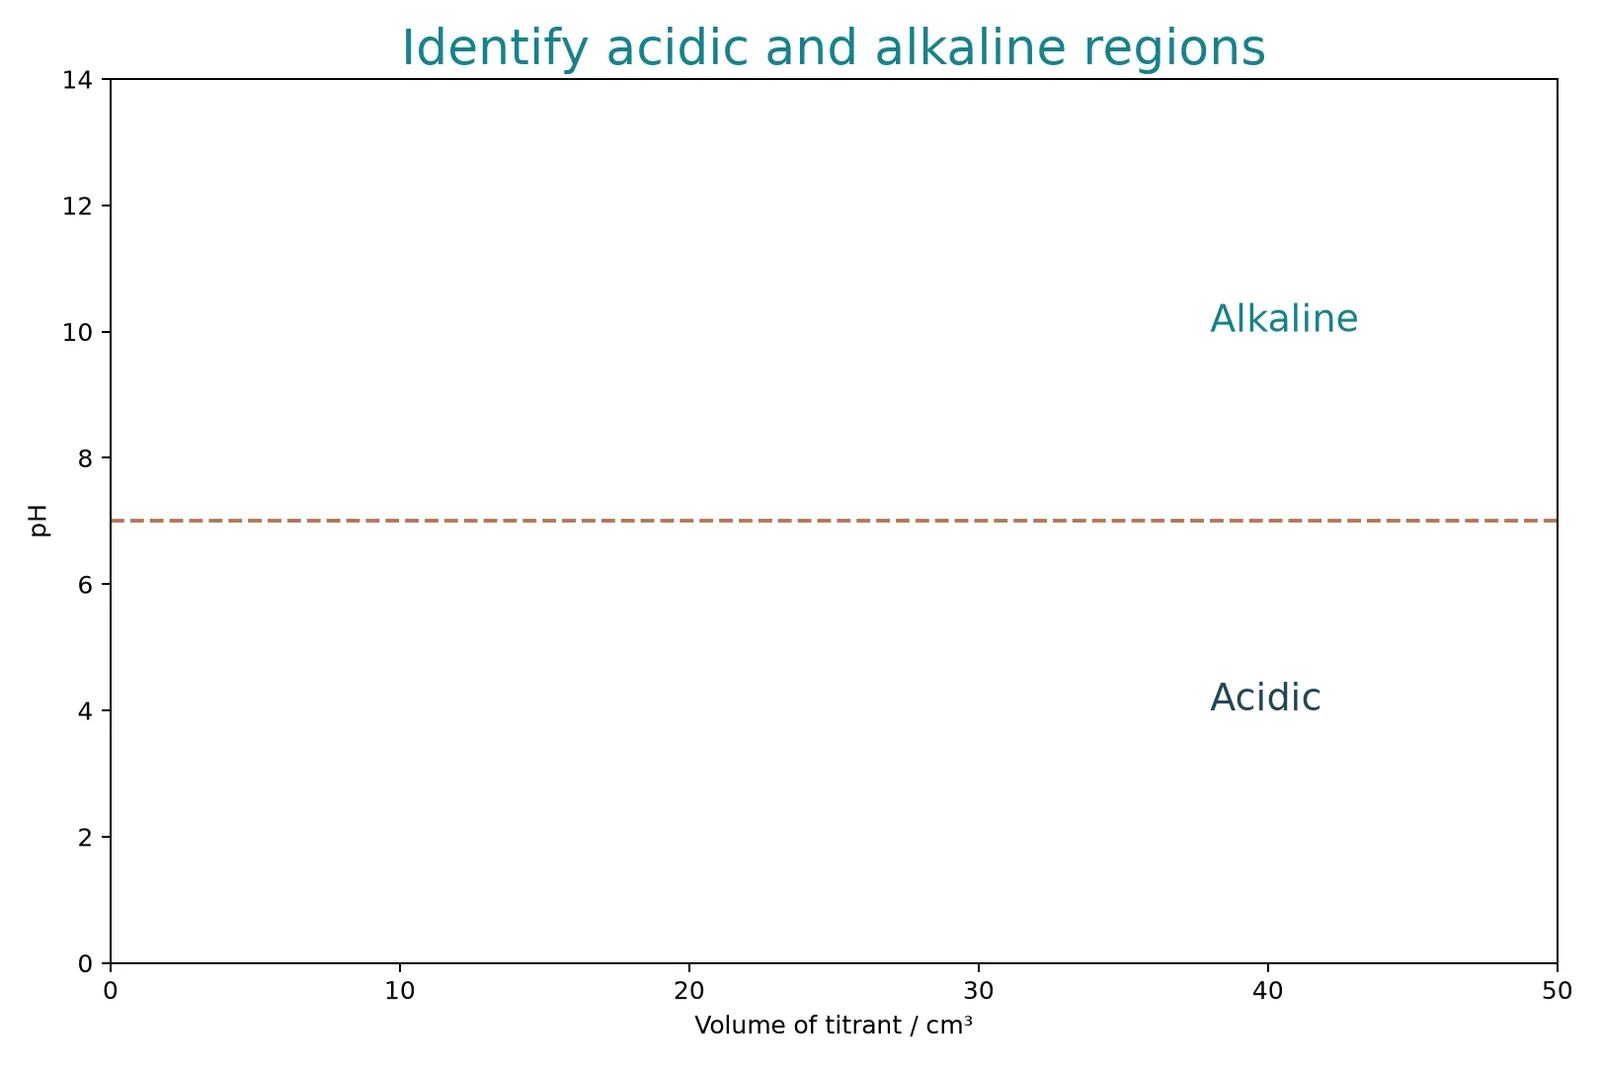
An acid–base indicator is often a weak acid whose acid form and conjugate base have different colours. Write HIn ⇌ H+ + In−. In an acidic solution, the equilibrium favours HIn; in an alkaline solution, it favours In−.
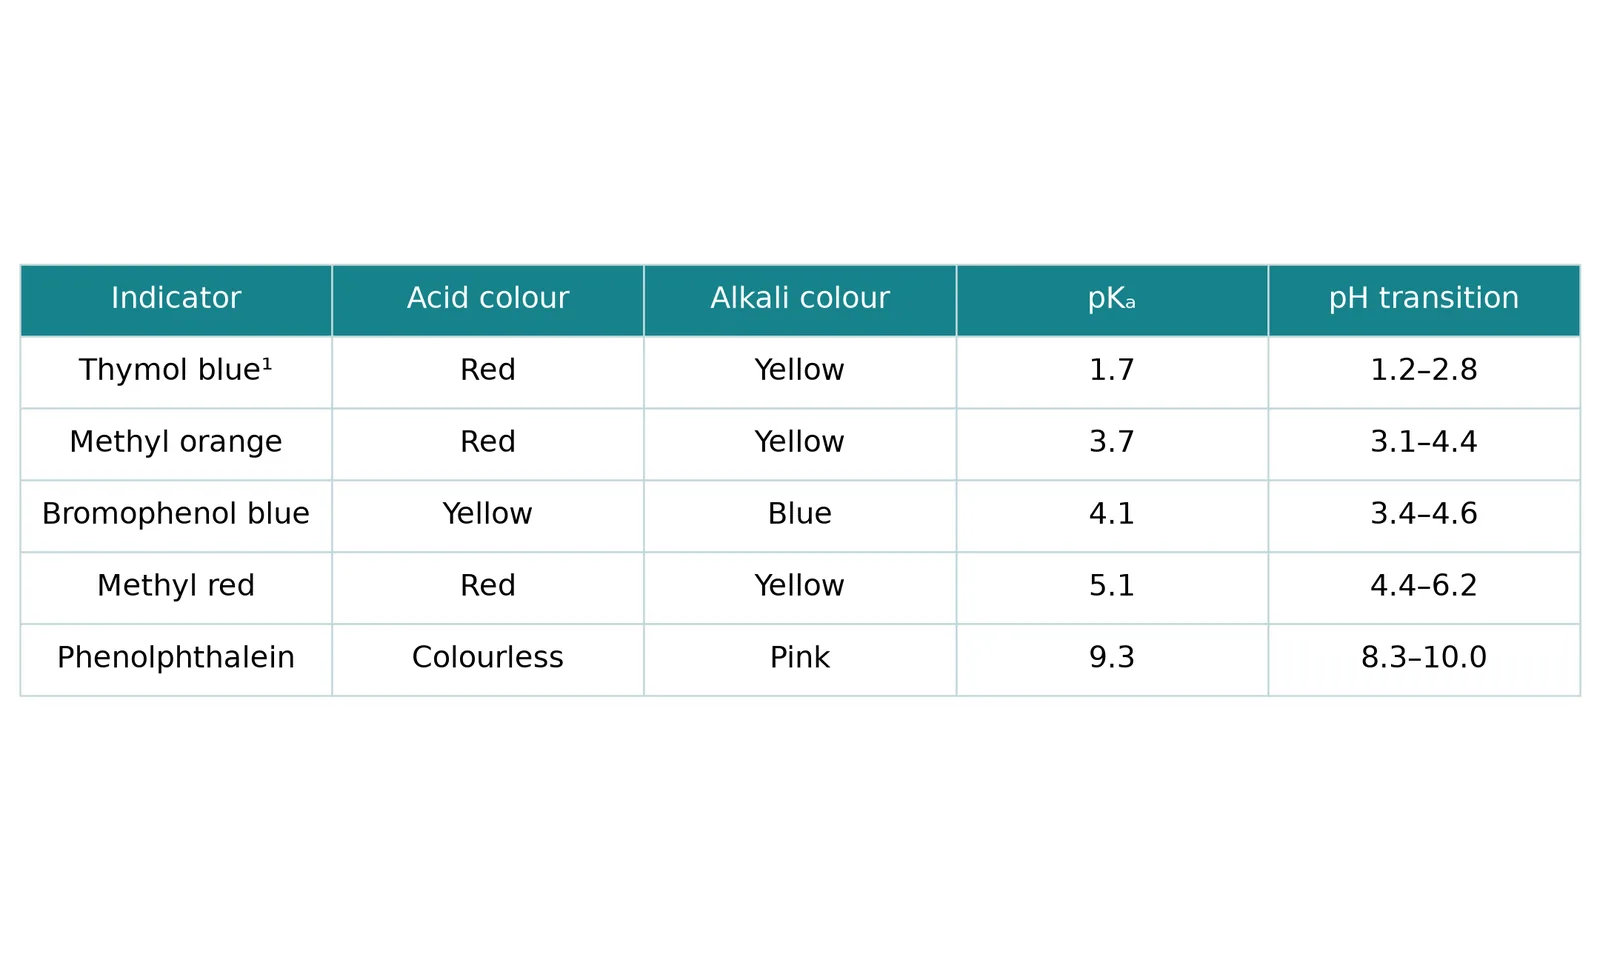
The colour changes over a pH range, rather than at one exact pH. Near the point where the two forms have comparable concentrations, pH is close to the indicator's pKa. This explains why different indicators change colour in different pH ranges.
Part 2 of 6Choose from the pH curve
Choose from the pH curve
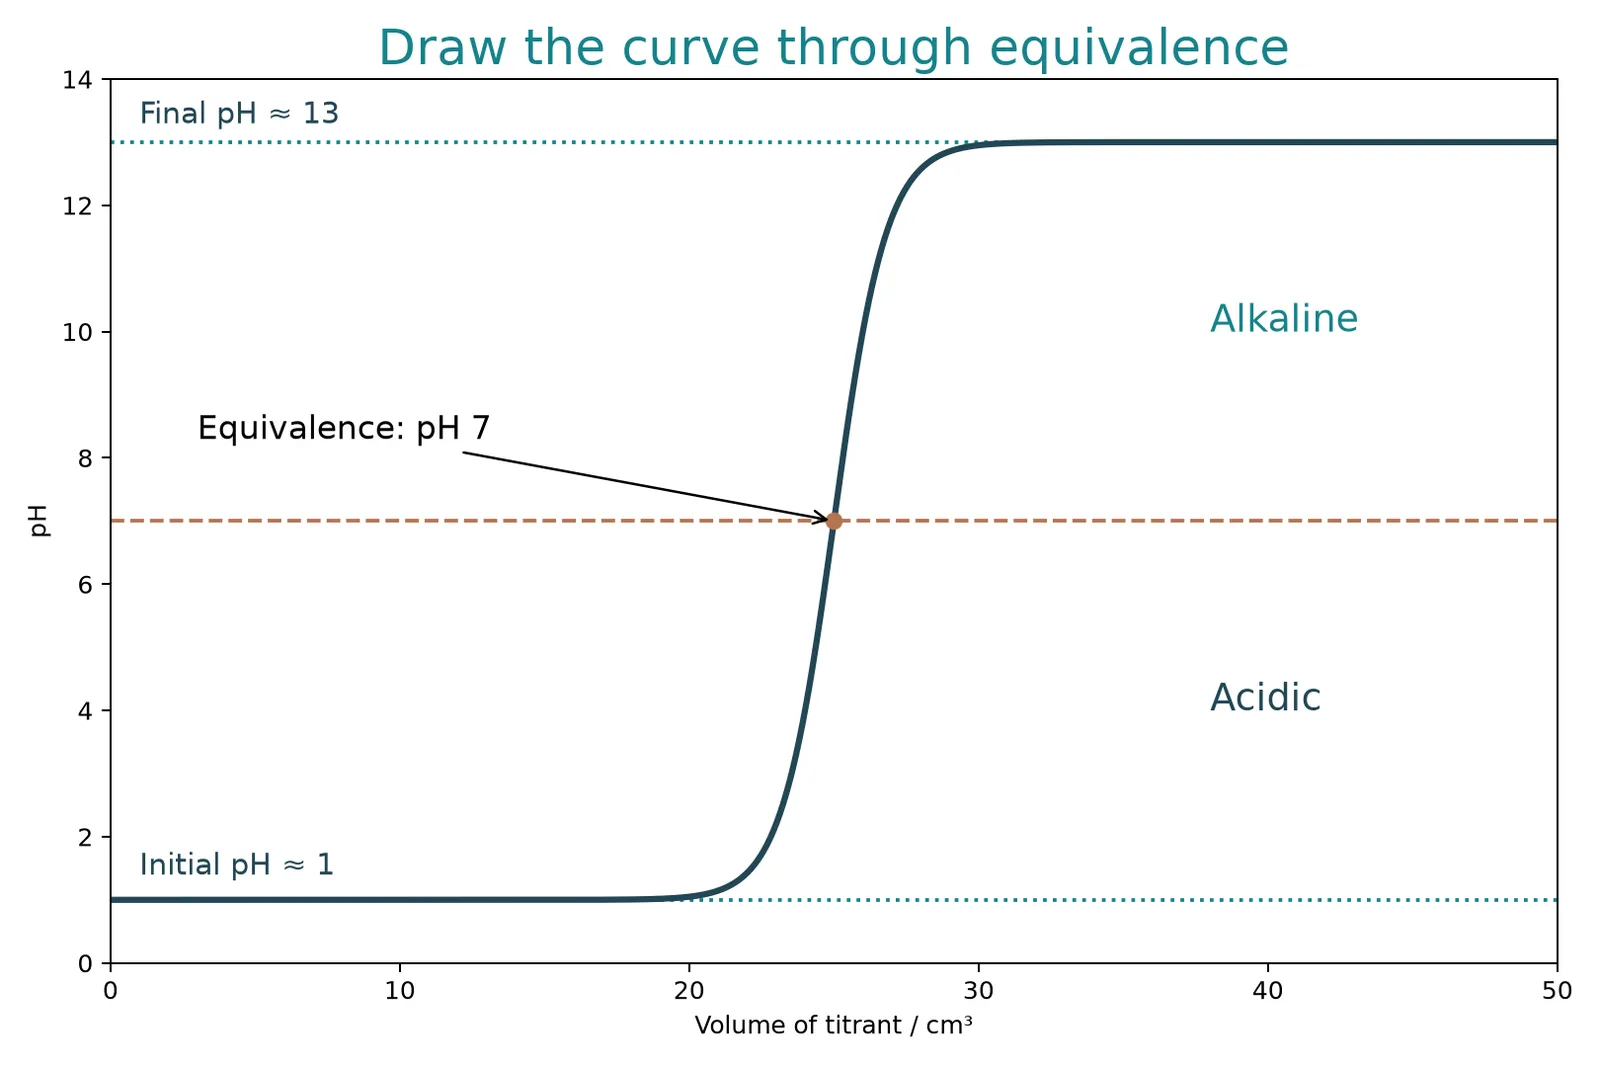
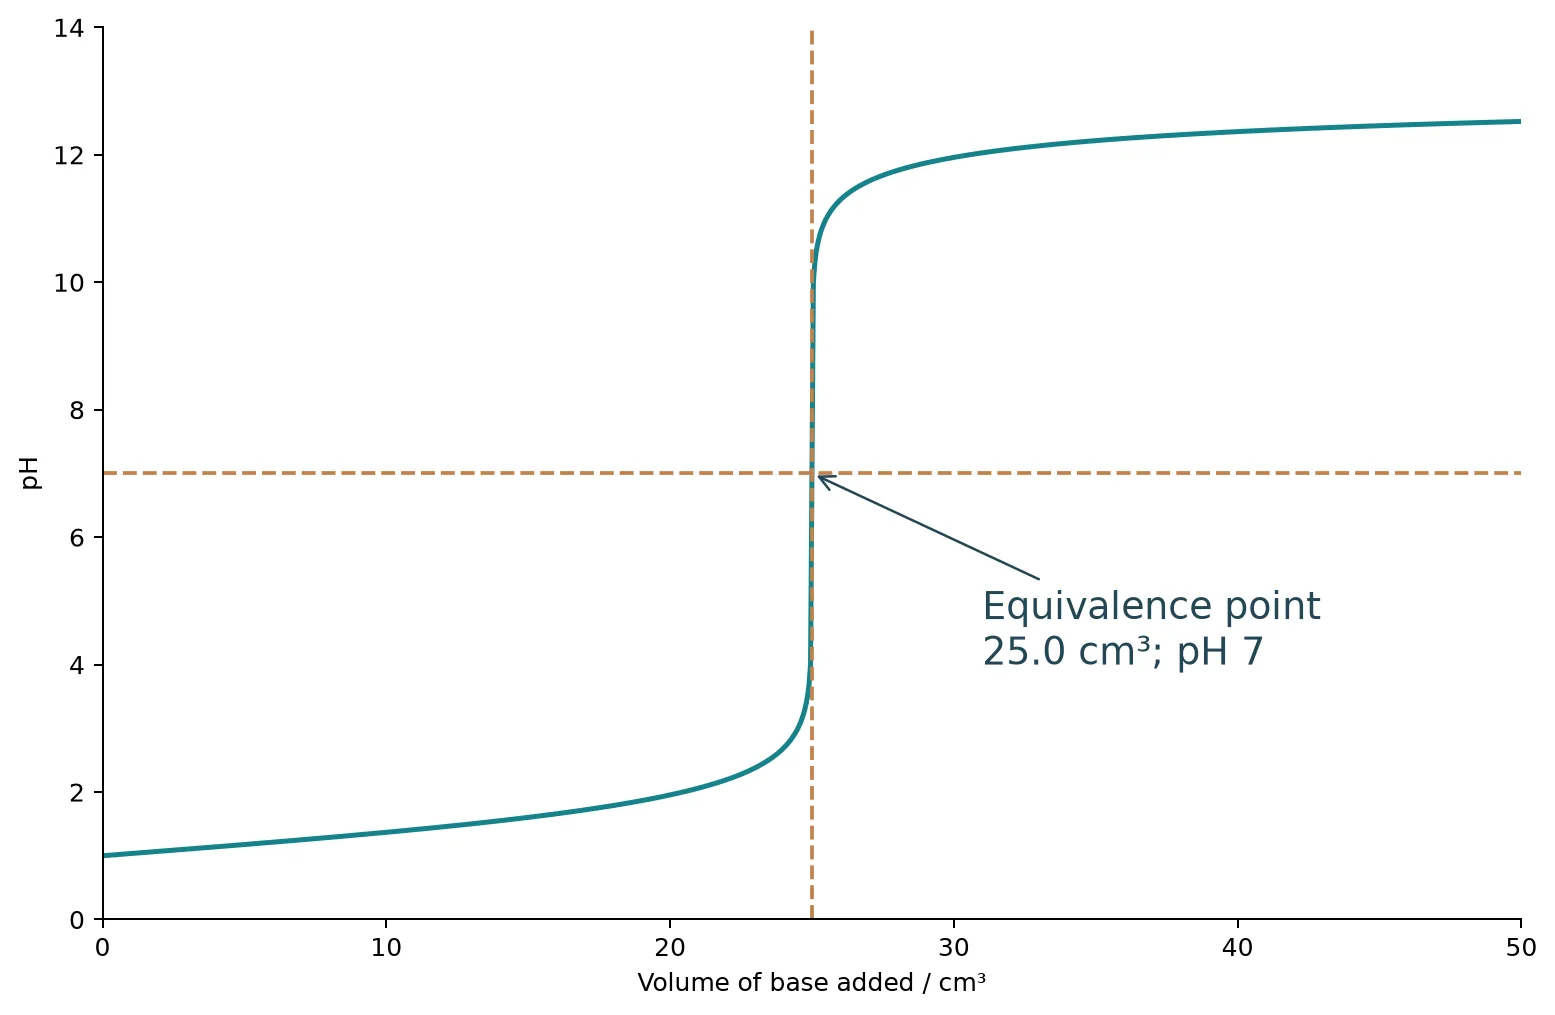
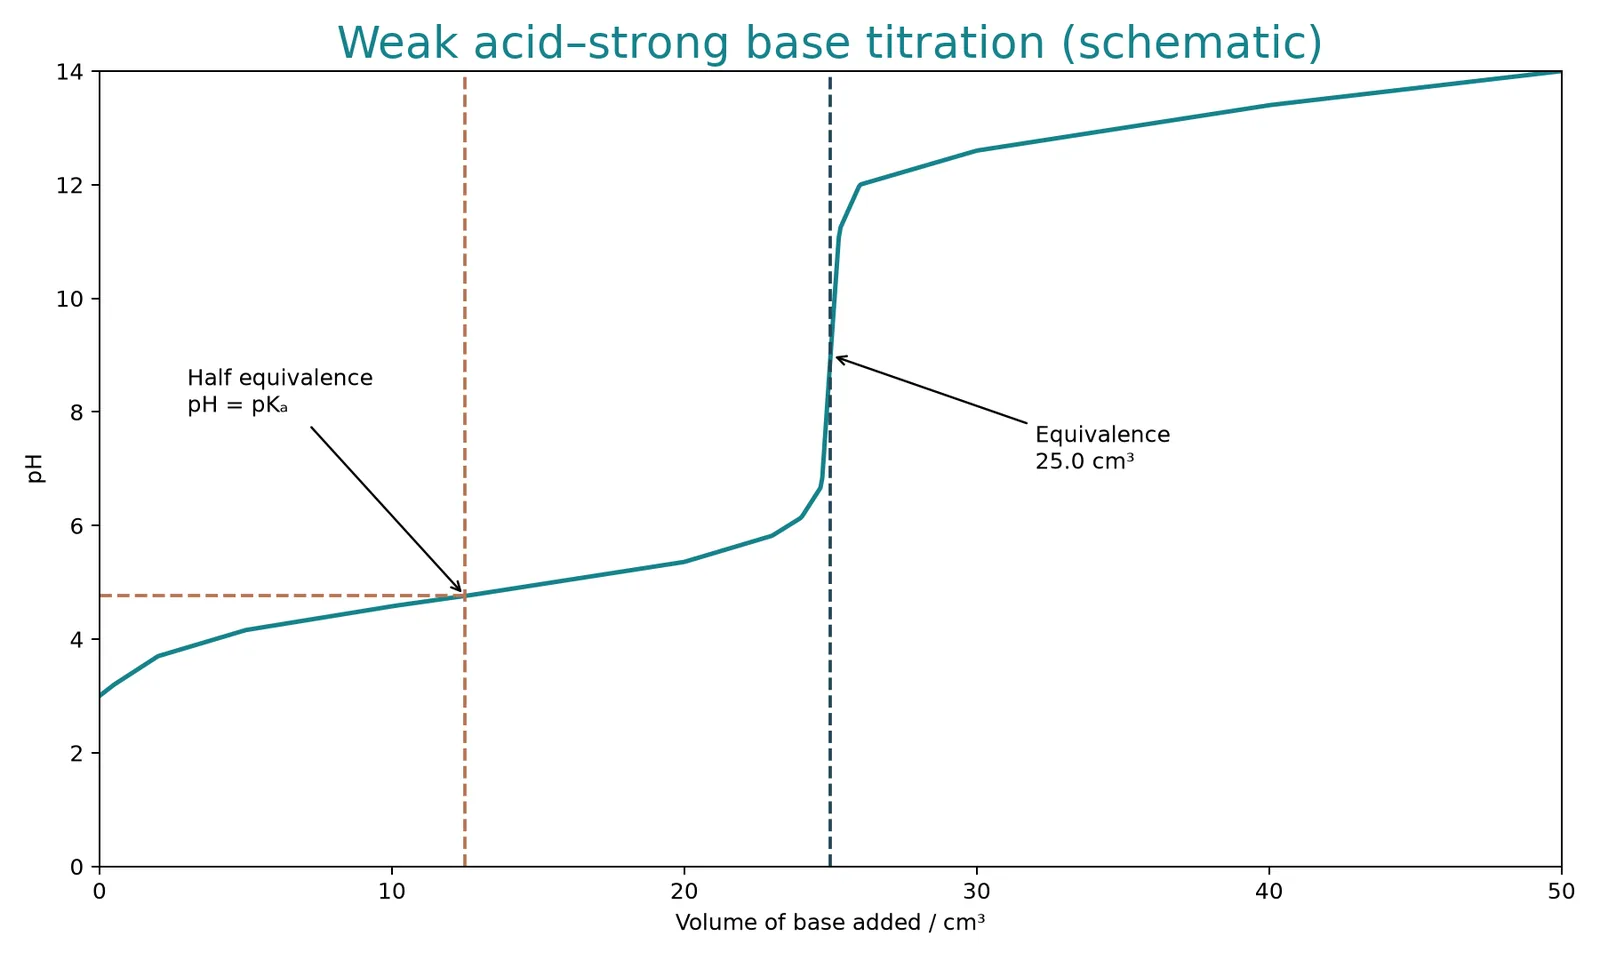
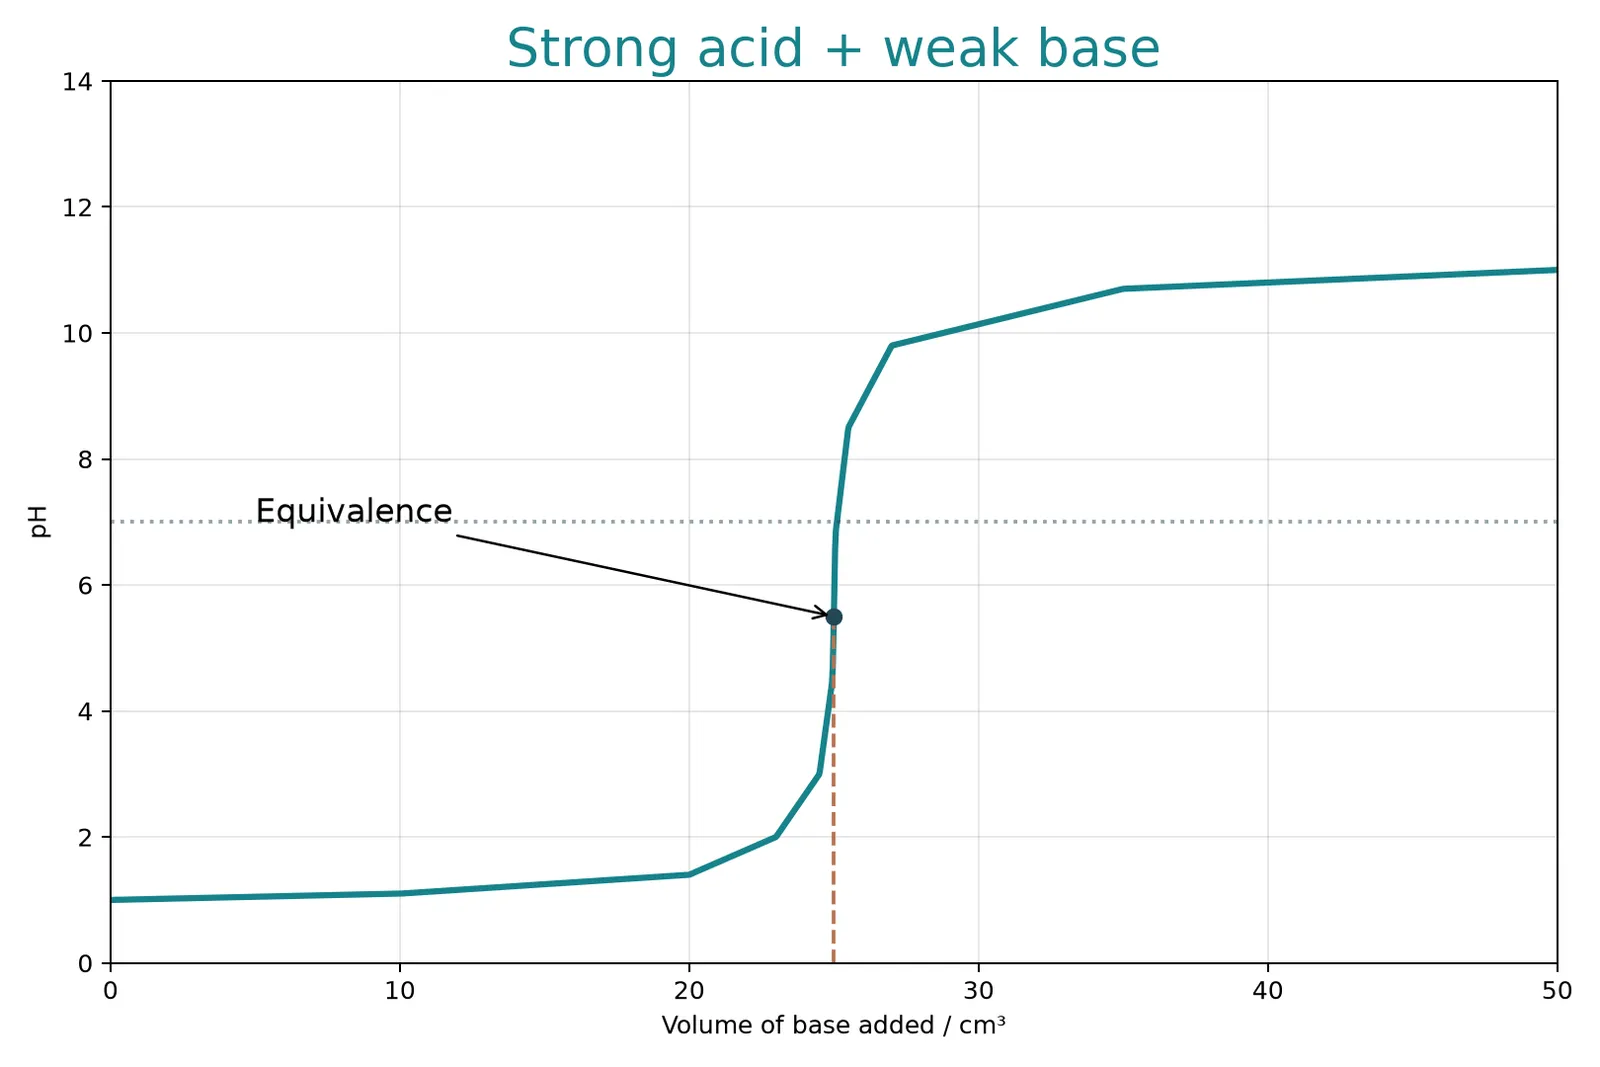
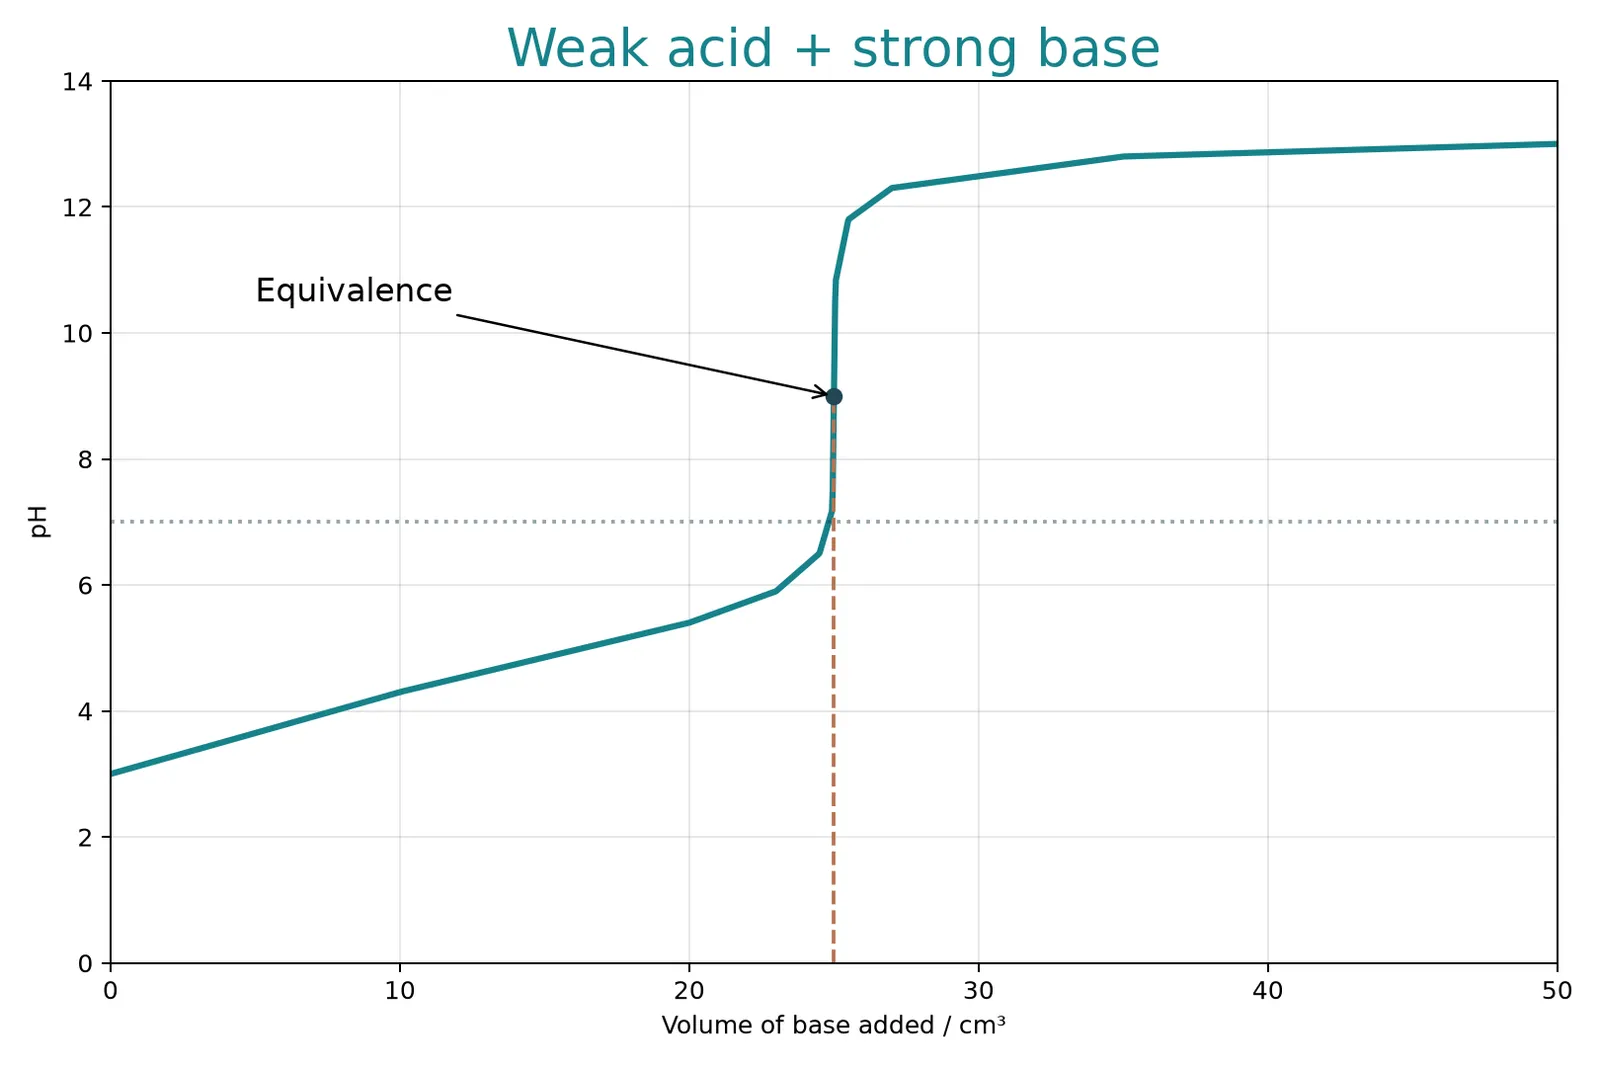
The equivalence point is reached when the reacting acid and base have combined in the required mole ratio. A suitable indicator has its transition range within the steep, nearly vertical section of the titration curve, so a small added volume gives a clear colour change close to equivalence.
An unsuitable indicator changes colour while the curve is still flat, making the observed end point too early or too late. Select from the actual pH range around equivalence, not from a rule that every titration ends at pH 7.
Part 3 of 6Strong acid and strong base

Strong acid and strong base
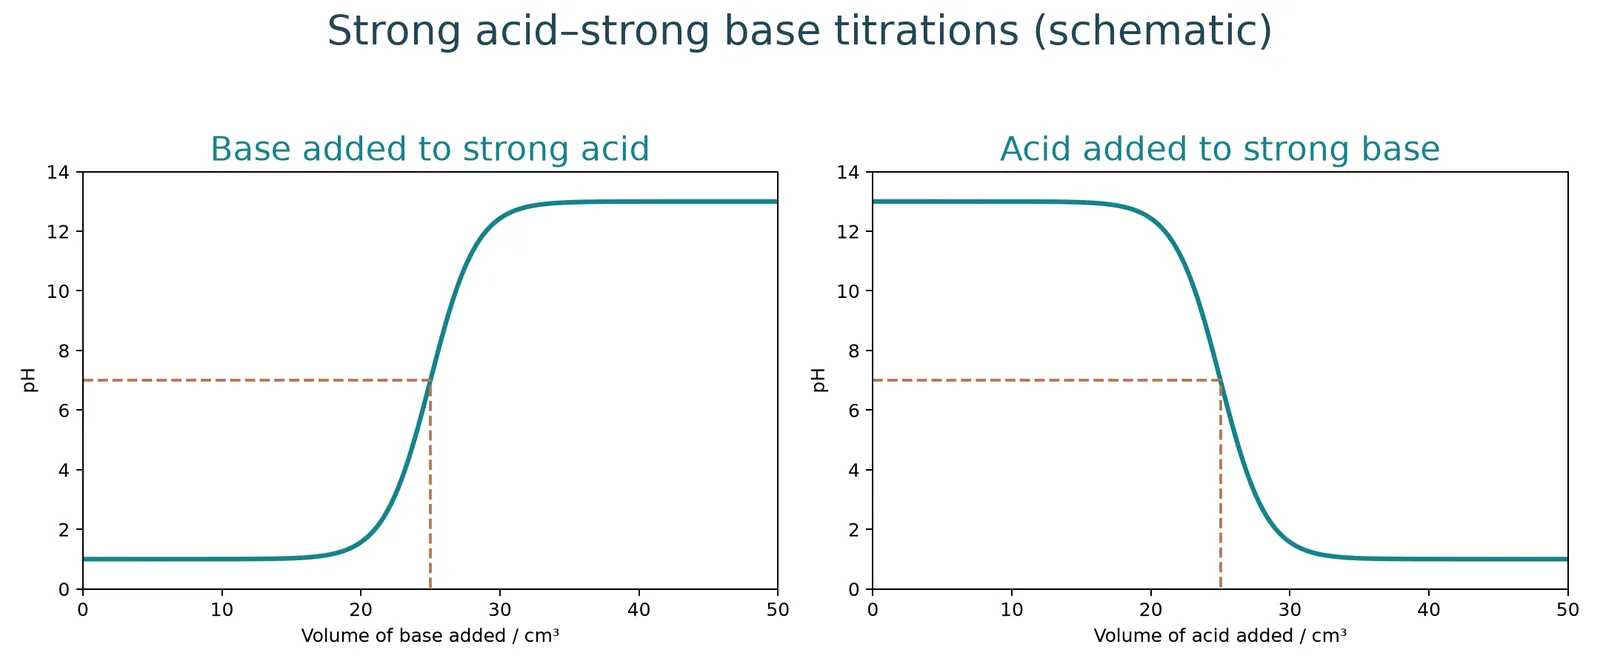
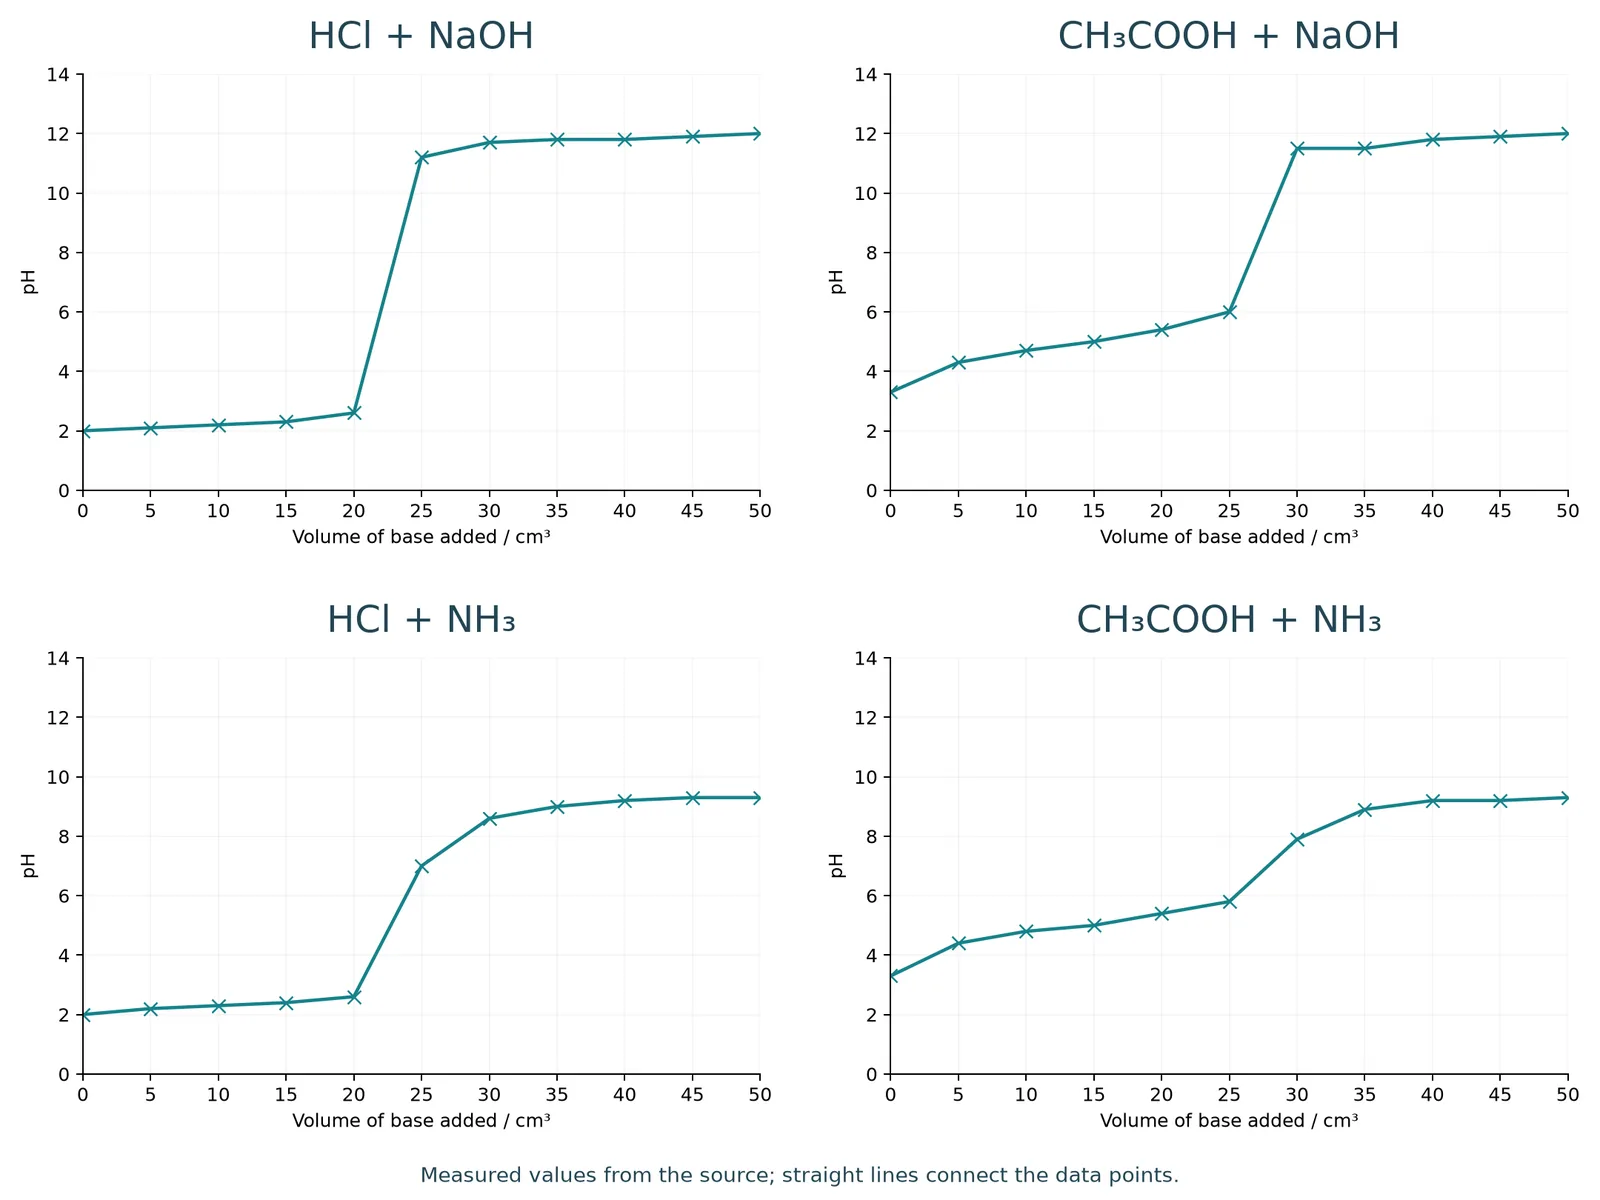
In a strong acid–strong base titration, the pH changes sharply over a broad range around equivalence, roughly pH 4–10 in a typical curve. Several indicators have transition ranges inside this steep section.
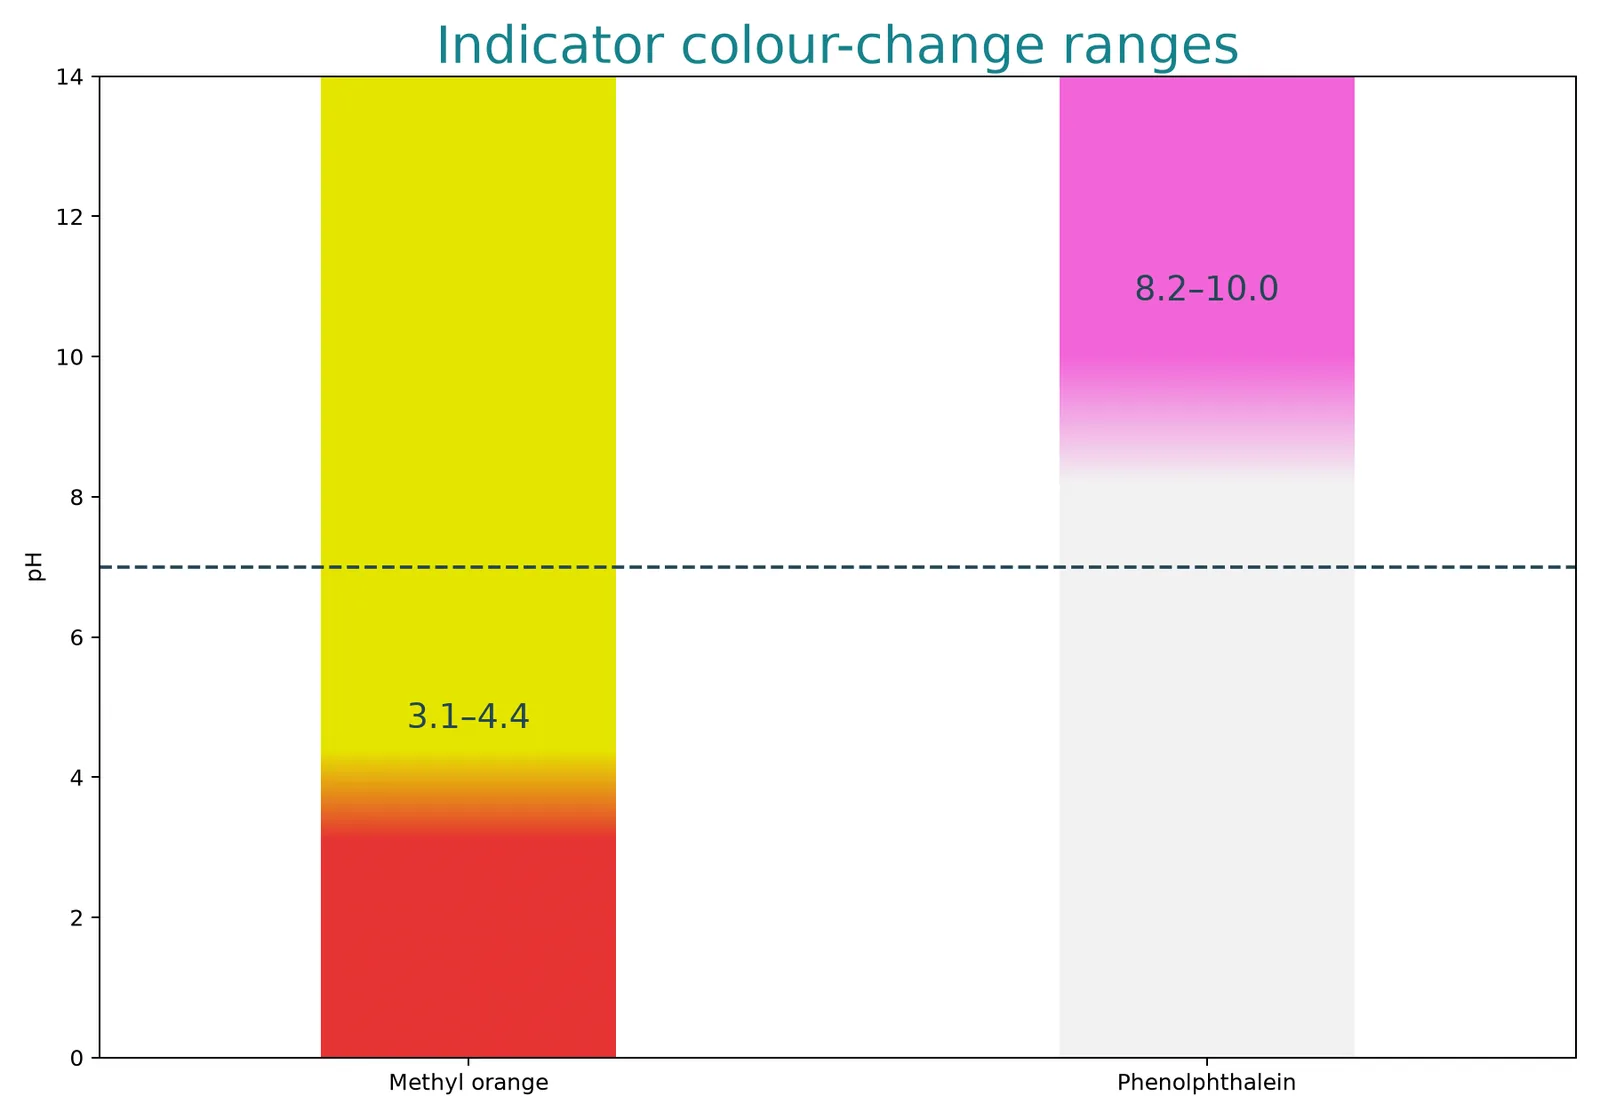
Phenolphthalein and methyl red can both give clear end points. Methyl orange is also often used because its colour changes sufficiently close to the steep region, even though it may be less ideal for a particular curve.
Part 4 of 6A weak reactant changes the choice
A weak reactant changes the choice
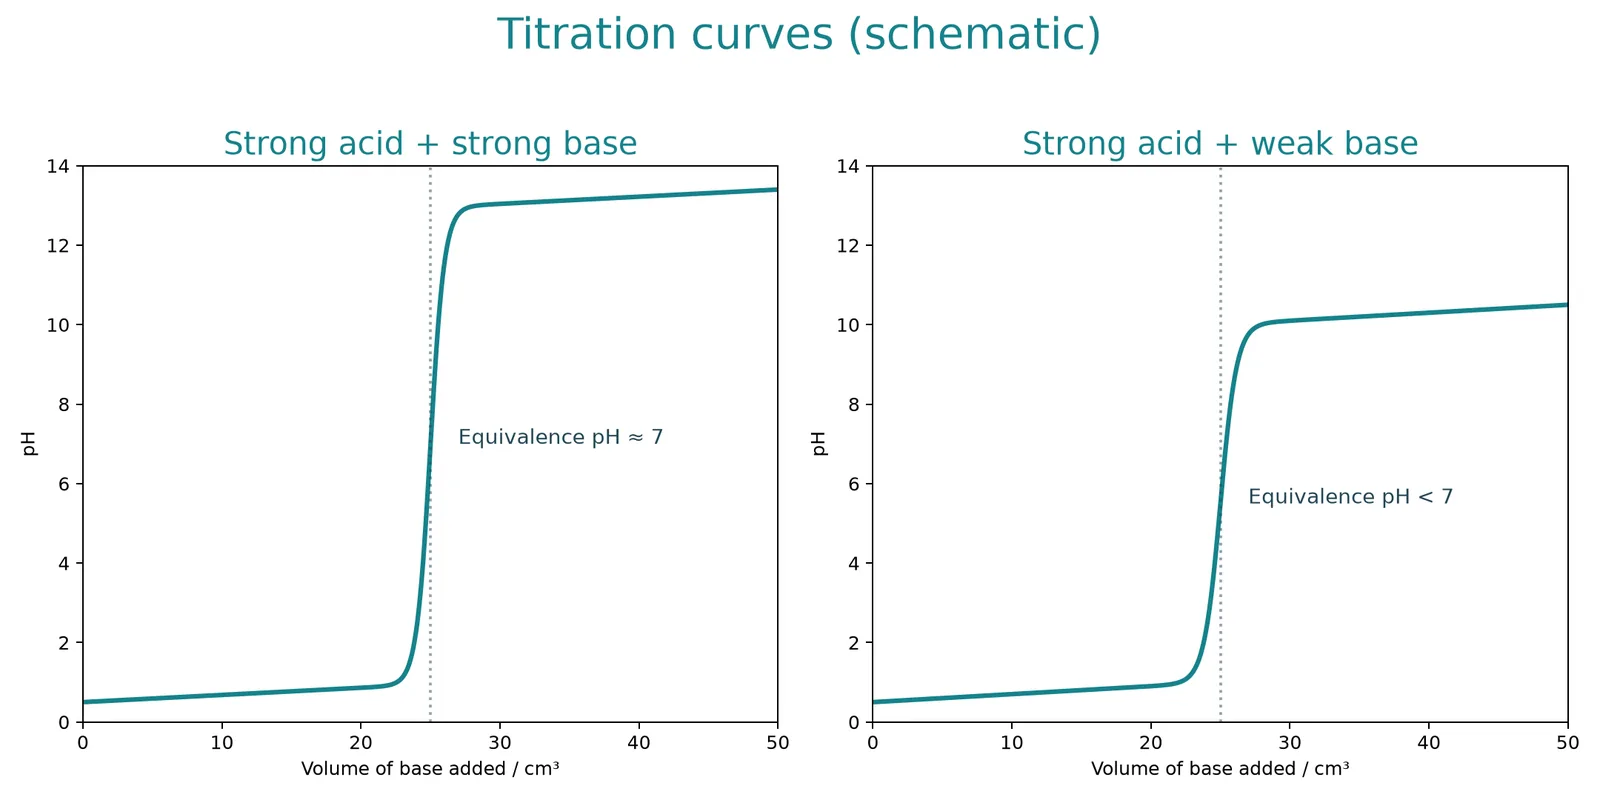
For a weak acid titrated with a strong base, equivalence occurs above pH 7 and the steep section is toward the alkaline range. Phenolphthalein is generally suitable. An indicator that changes at a low pH would turn before equivalence.
For a strong acid titrated with a weak base, equivalence is below pH 7. Methyl red is suitable; methyl orange is also commonly used if its colour change lies within the usable steep region. Phenolphthalein would change too far into the alkaline range.
Part 5 of 6Weak acid and weak base
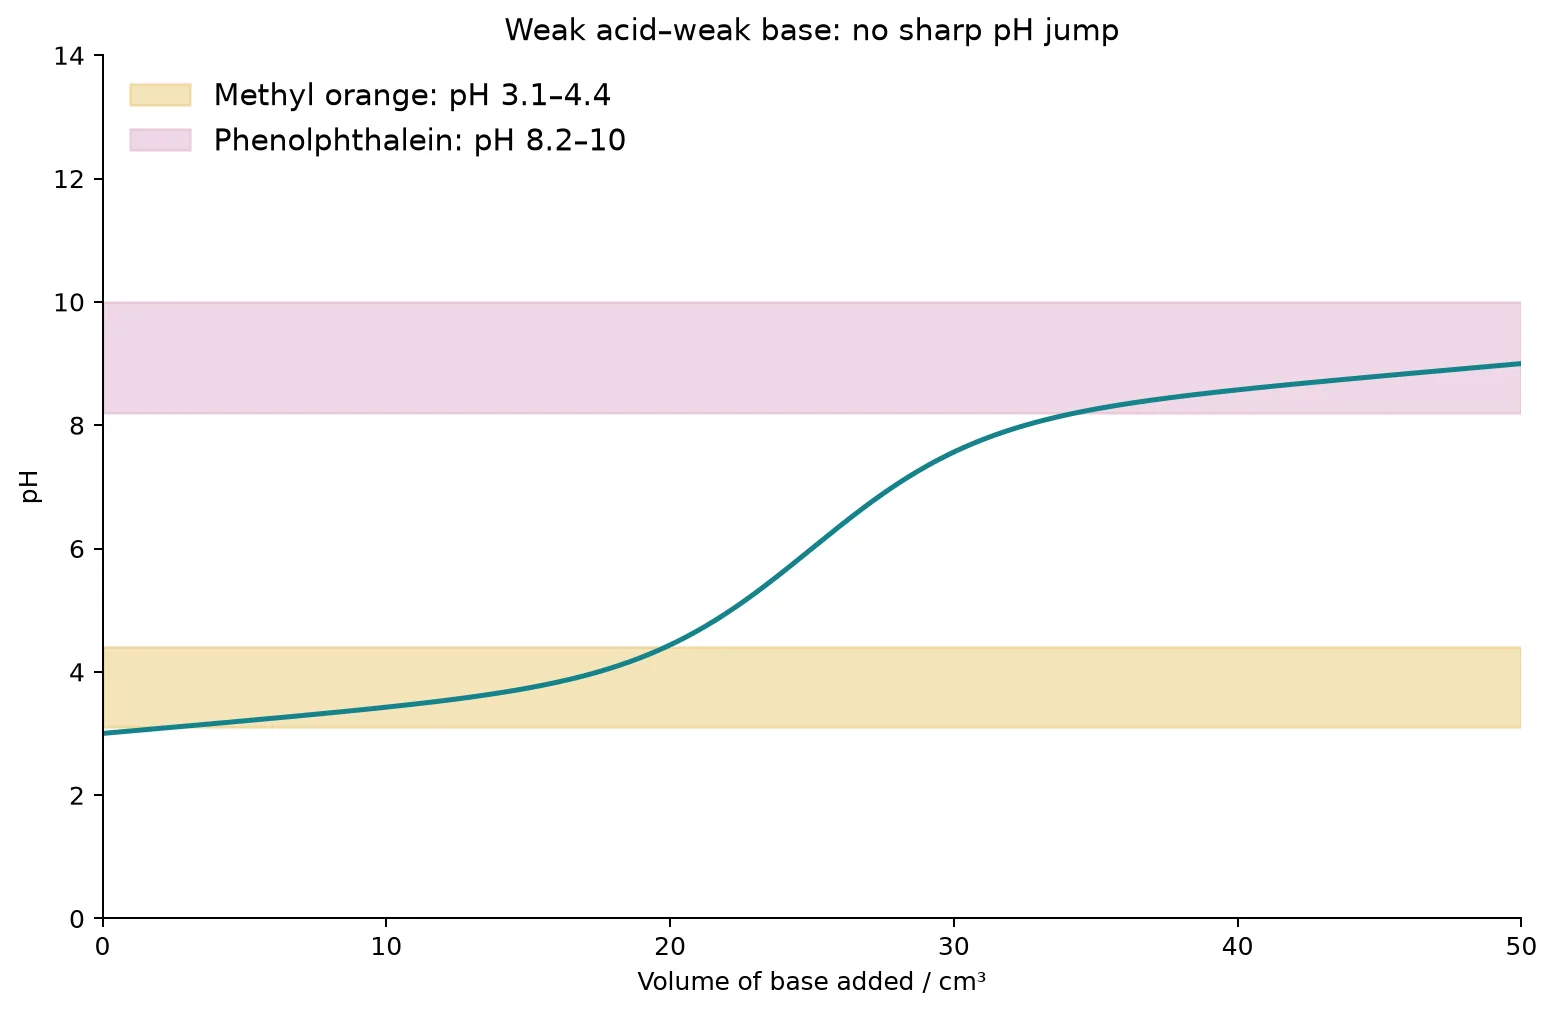
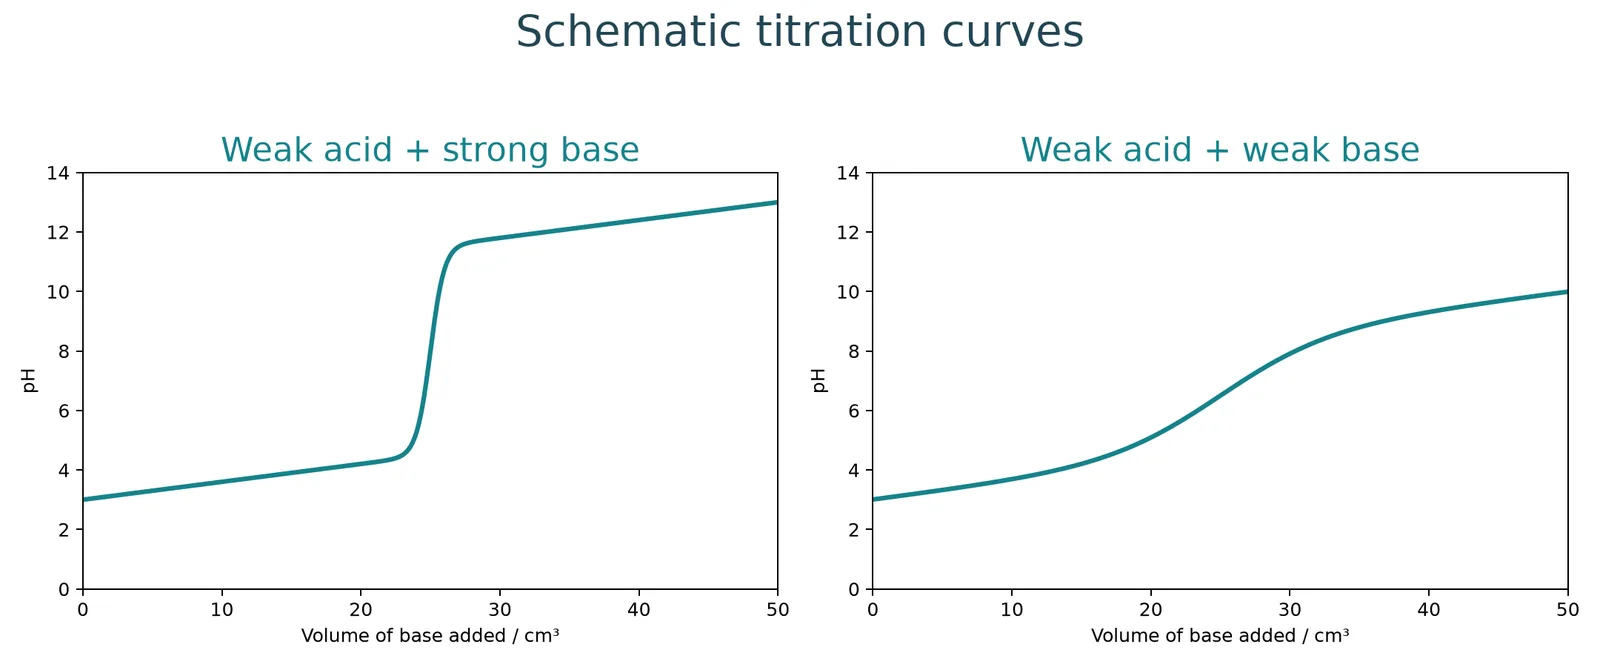


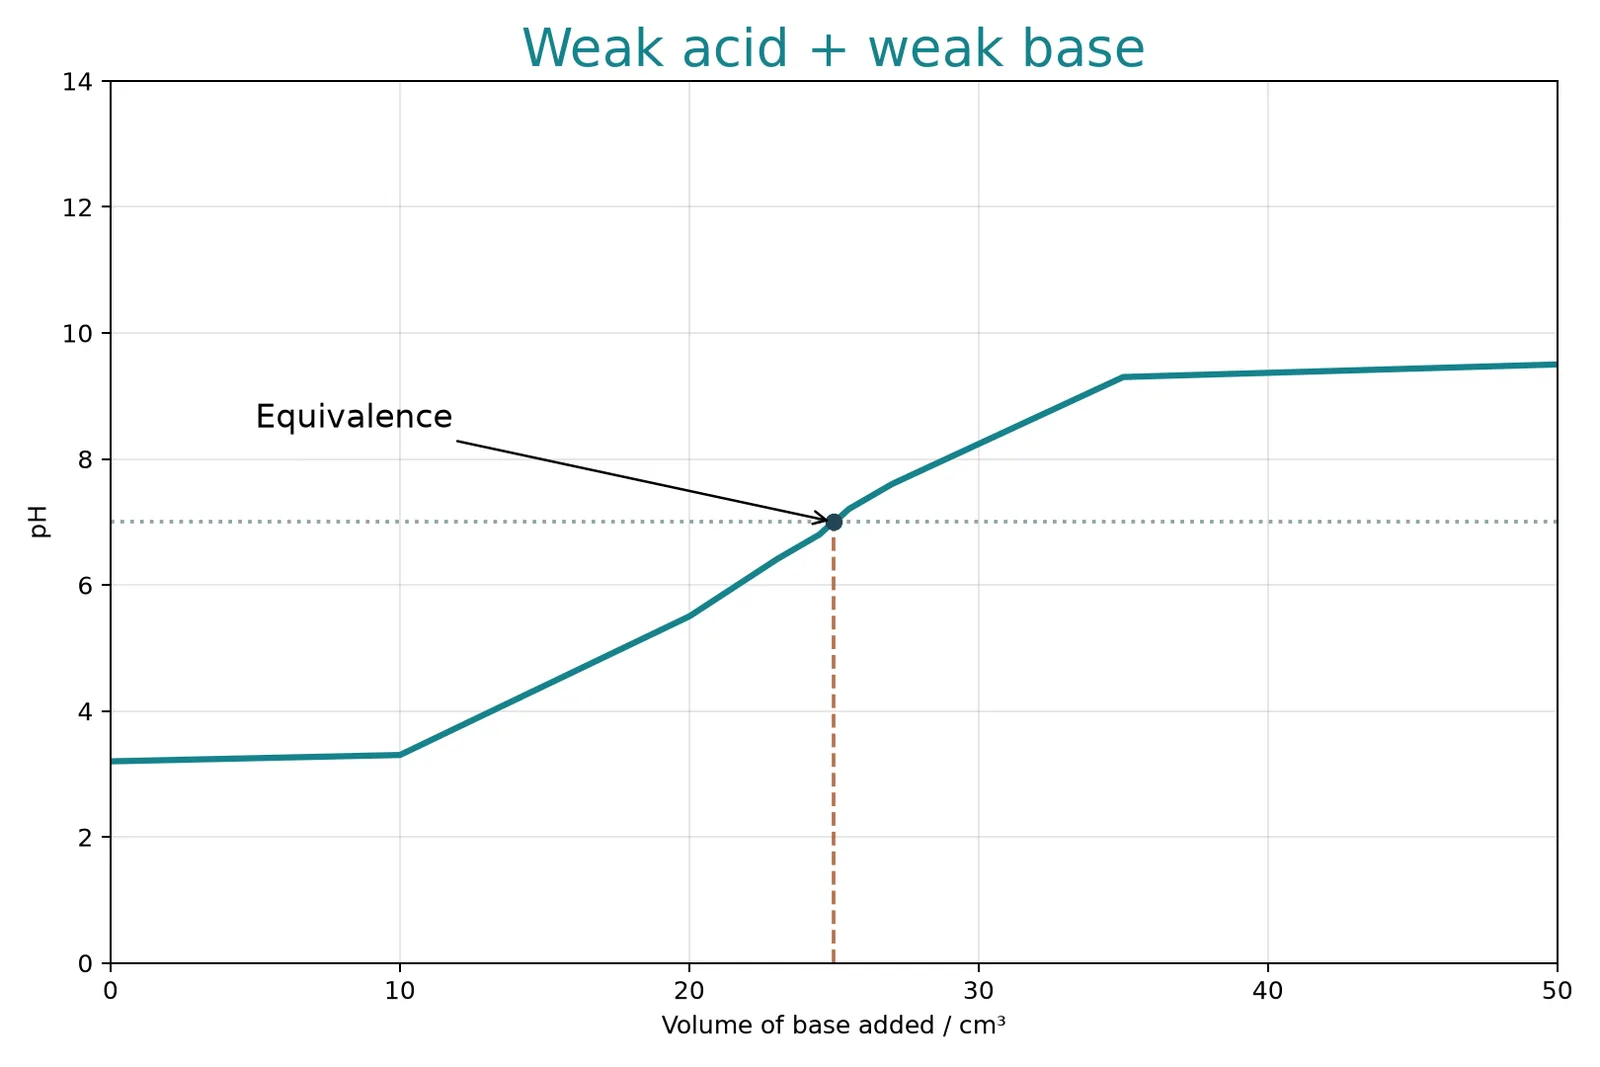
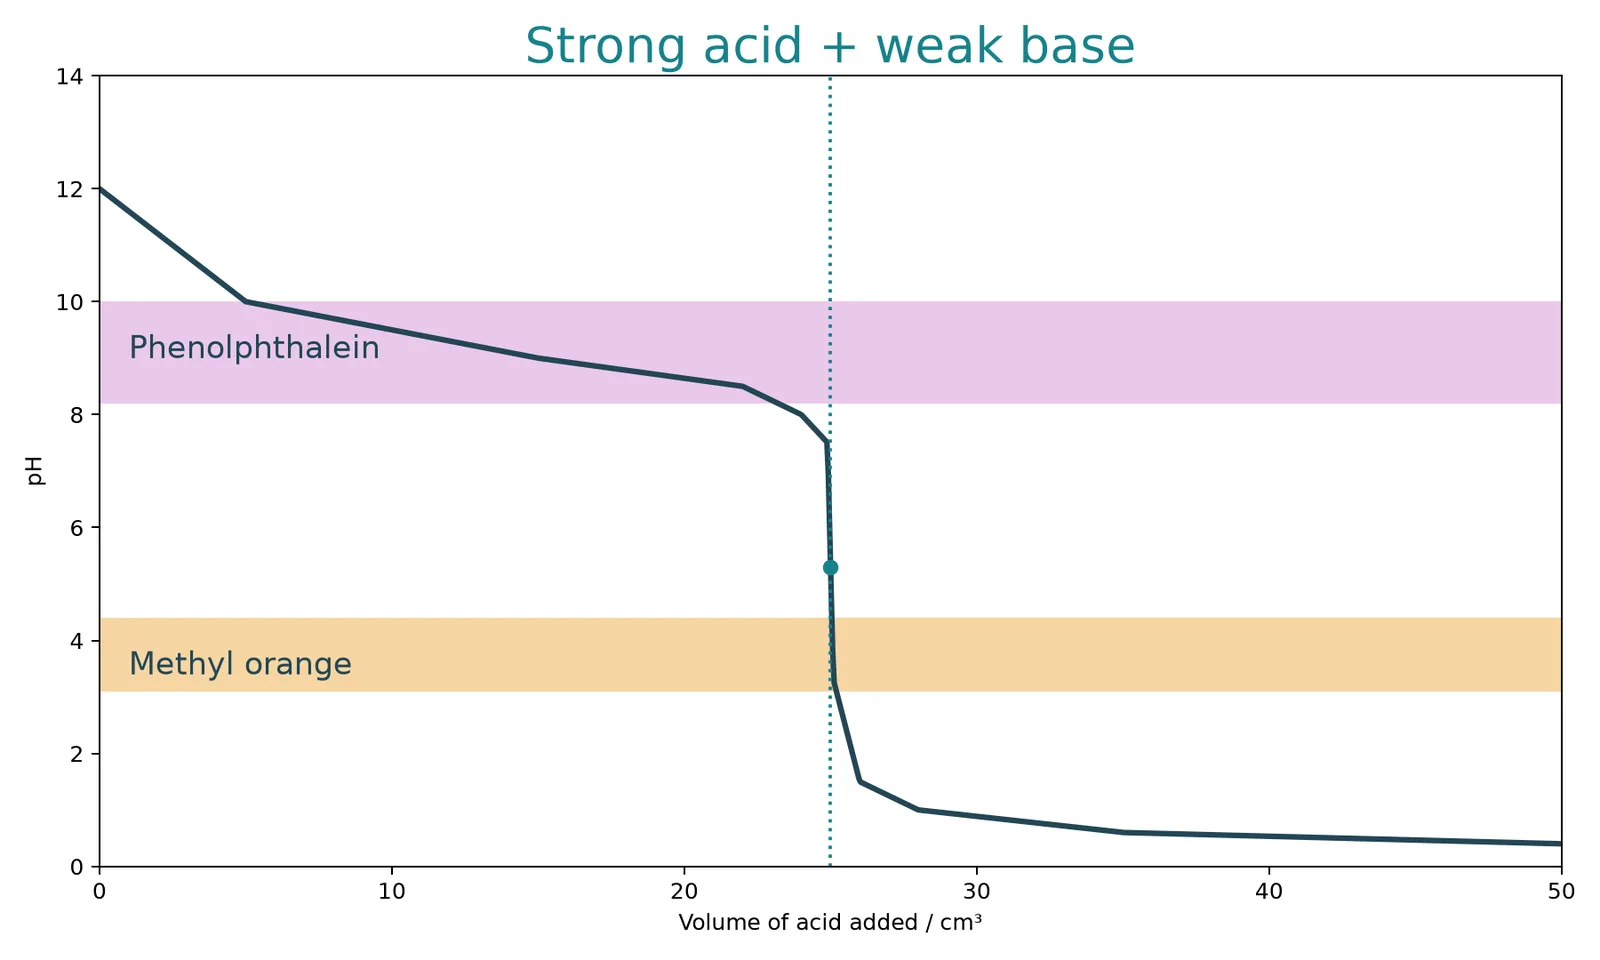
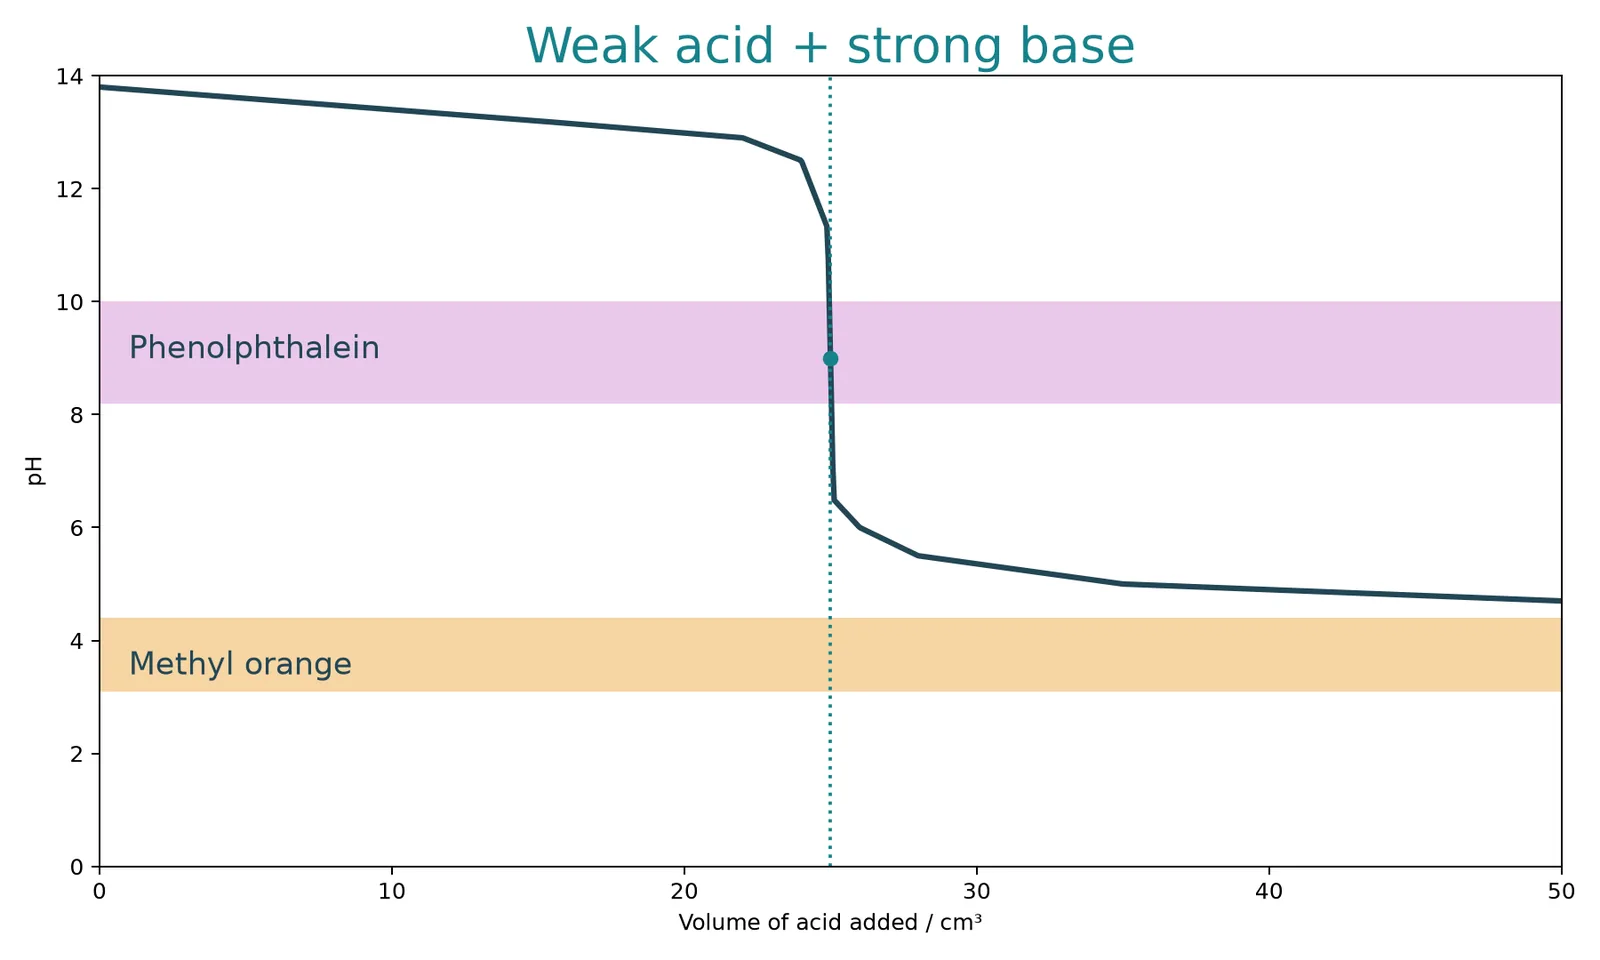
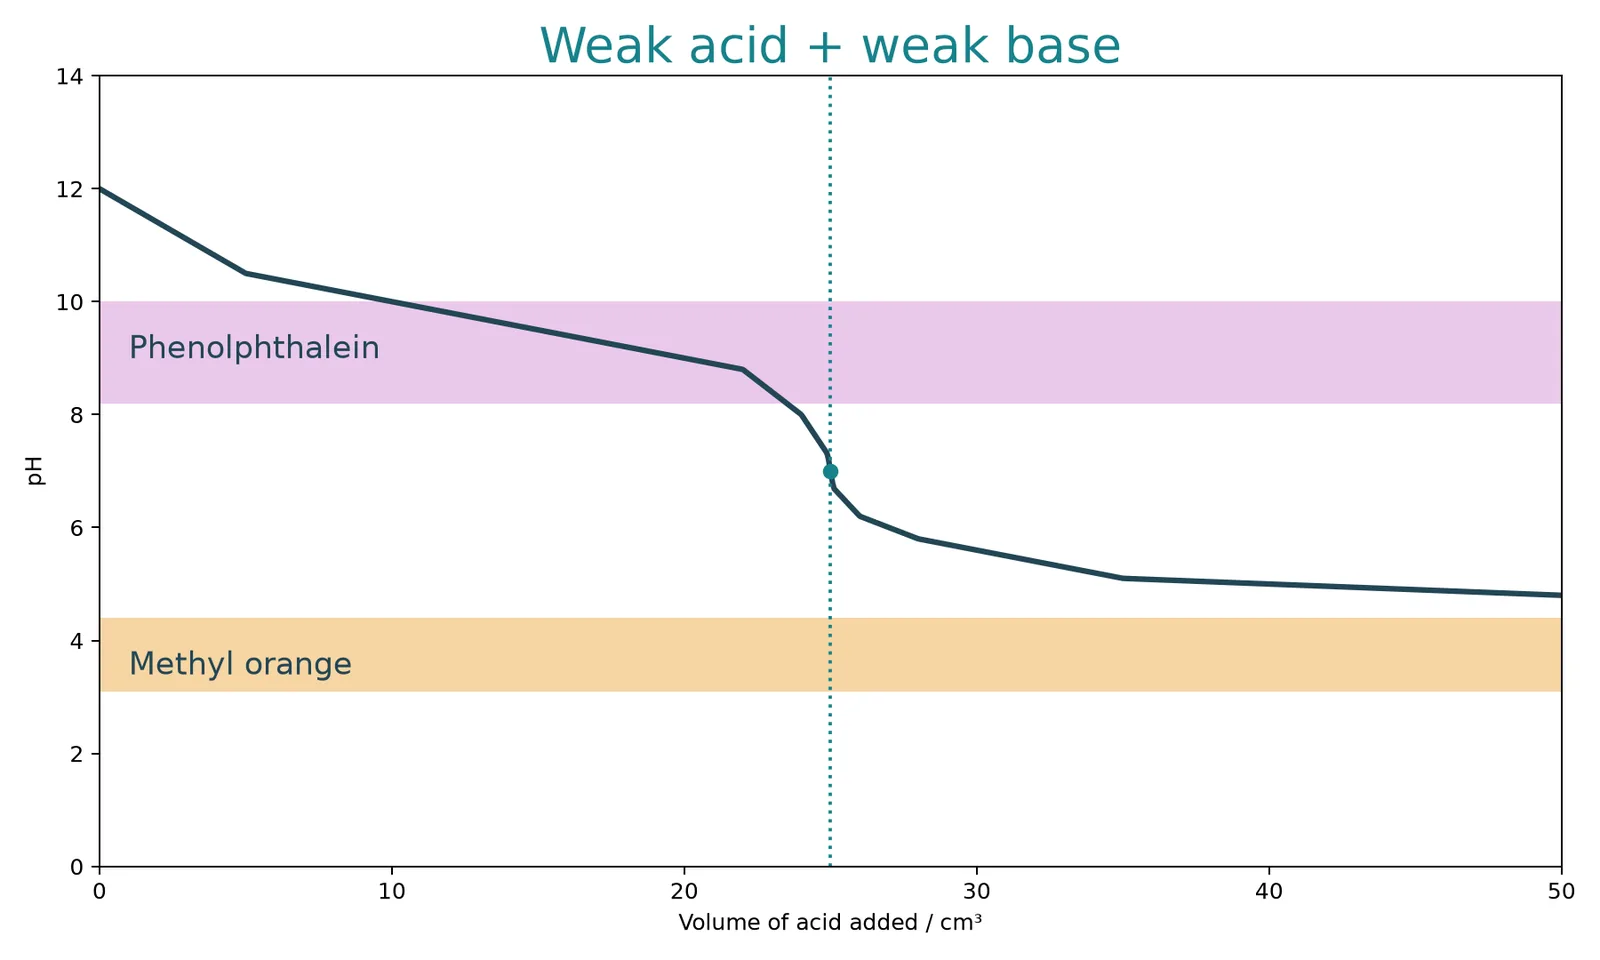
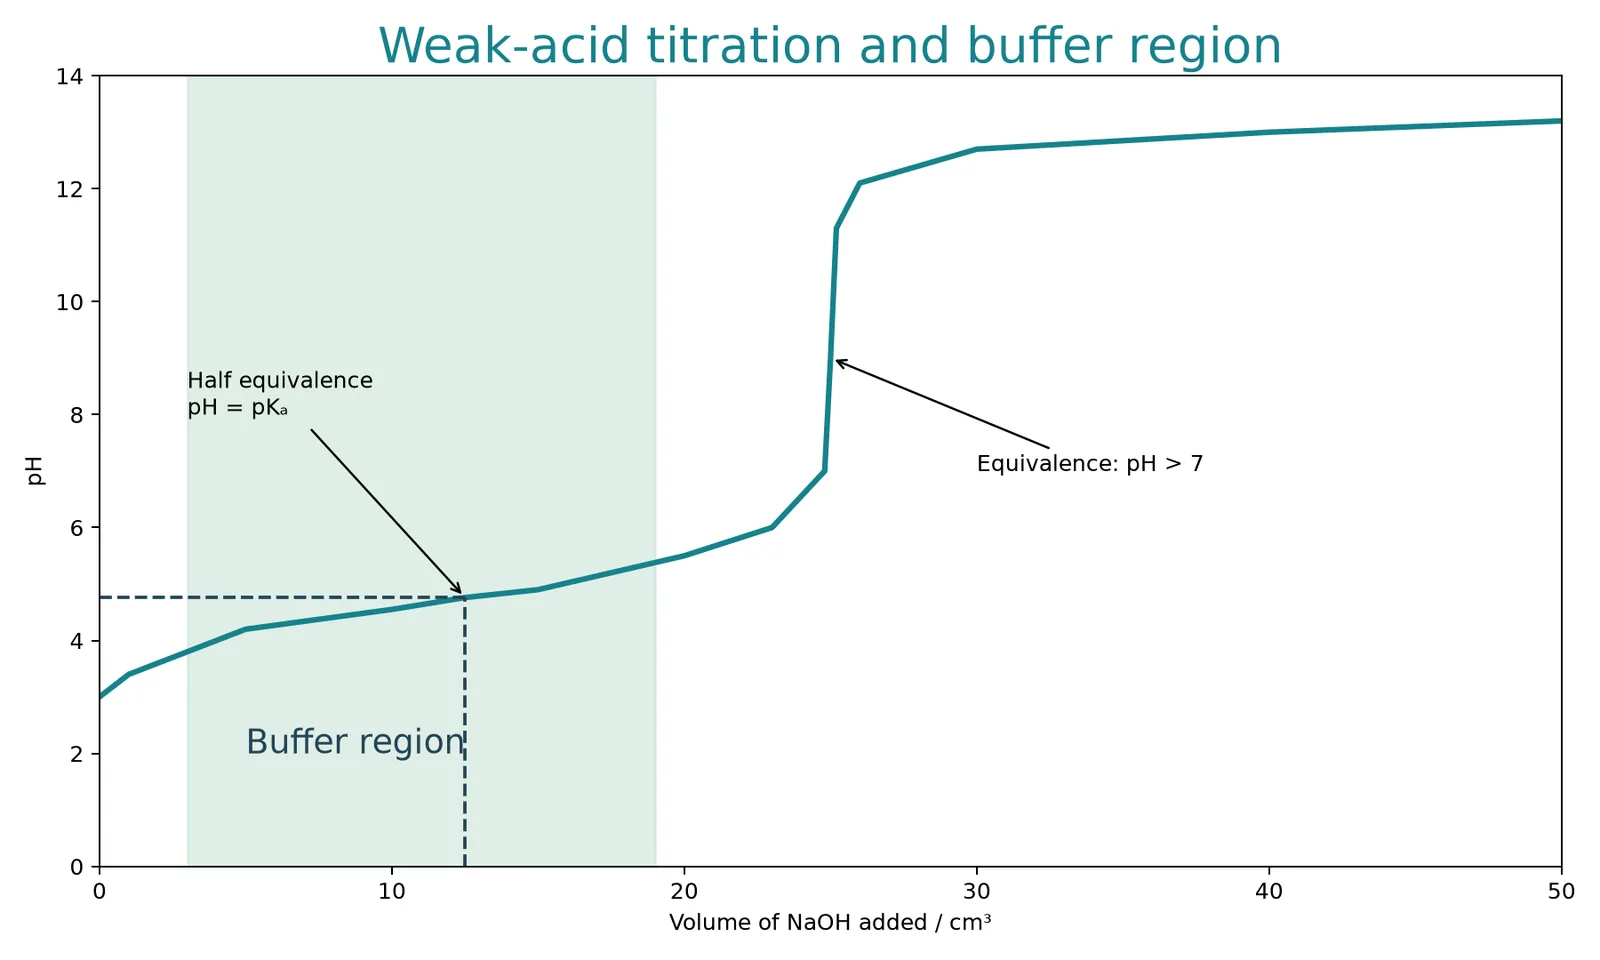
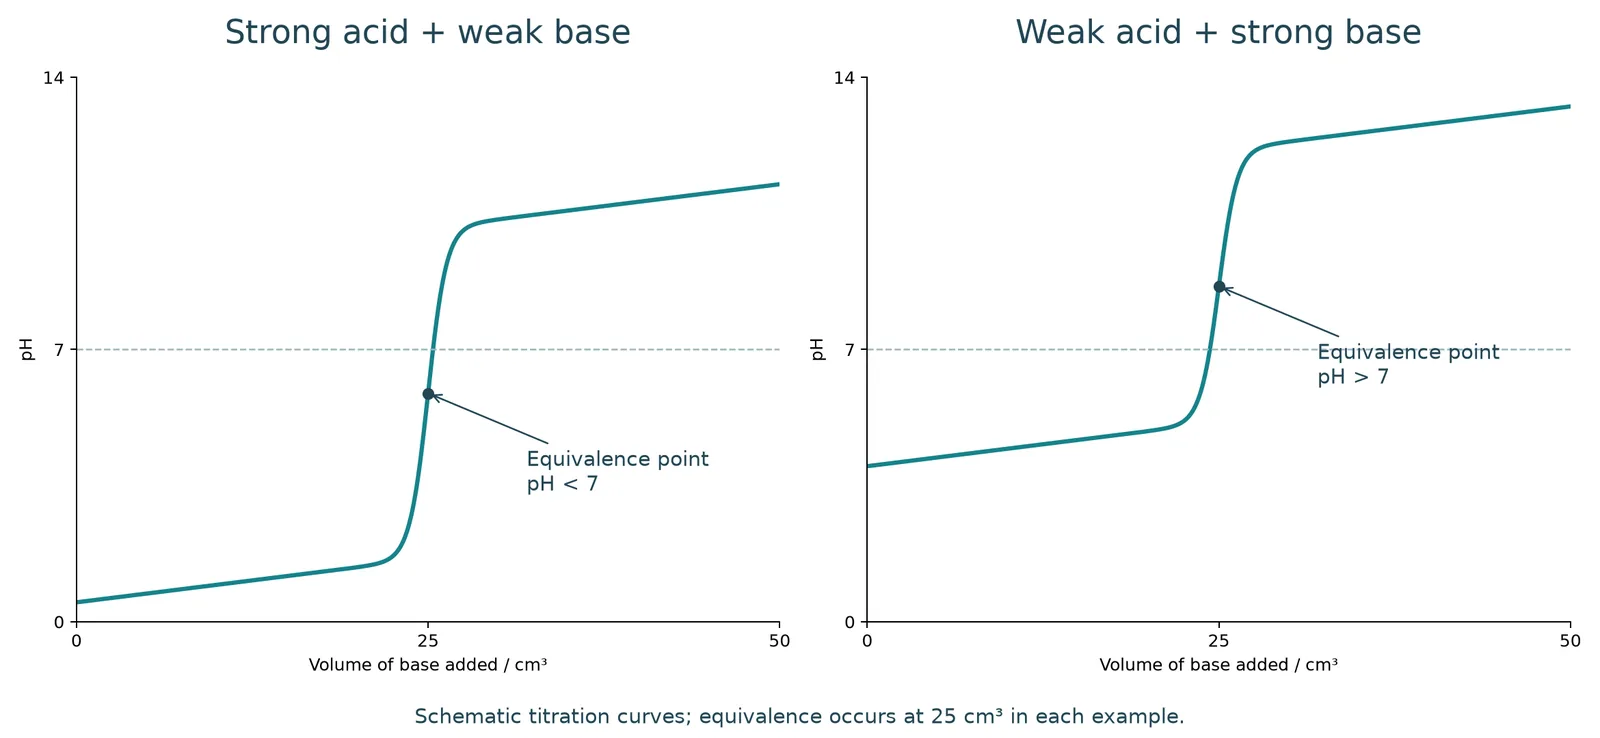
A weak acid–weak base titration has no sharp vertical pH jump. A visual indicator therefore cannot usually locate the equivalence point reliably. The colour transition extends over too much added volume.
Decision method
Inspect the curve, mark the steep region near equivalence, then compare the indicator's transition range with it. If there is no steep region, explain why a visual indicator is unsuitable rather than naming one by habit.
Part 6 of 6Check your understanding
- 1.
- Why do the two forms of an indicator show different colours?
- 2.
- What feature of a titration curve must contain the indicator's transition range?
- 3.
- Choose an indicator for a weak acid–strong base titration and justify it.
- 4.
- Why is there no reliable visual indicator for a weak acid–weak base titration?
Last updated:
\n