Curriculum
Mathematics — Third Preparatory
Unit 1
0/20
Unit 2
0/12Unit 3
0/12Unit 4
0/131.14-1 Measures of central tendency: recap1.24-2 Why do we need measures of dispersion?1.34-3 The range1.44-4 The median recap, quartiles and the interquartile range1.54-5 The box plot (box-and-whisker)1.64-6 Deviation, variance and standard deviation of a set of values1.74-7 Standard deviation of a simple frequency distribution1.84-8 Standard deviation of a grouped (class) distribution1.94-9 Using the scientific calculator1.104-10 Comparing two data sets1.114-11 Effect of adding or multiplying every value1.124-12 Outliers and choosing the right measure1.13Exam traps and key takeaways
Text lesson
Unit 4: Statistics — Measures of Dispersion
Unit 4: Statistics — Measures of Dispersion
Overview
Overview
- Explain why measures of central tendency alone are not enough and what a measure of dispersion adds.
- Compute the range, the quartiles, the interquartile range and represent them in a box plot.
- Compute the variance and the standard deviation for raw data, a simple frequency table and a grouped distribution.
- Compare two data sets, predict the effect of adding or multiplying every value, and choose the suitable measure in the presence of outliers.
Measures of Dispersion
├── 4-1 Recap of central tendency (mean, median, mode)
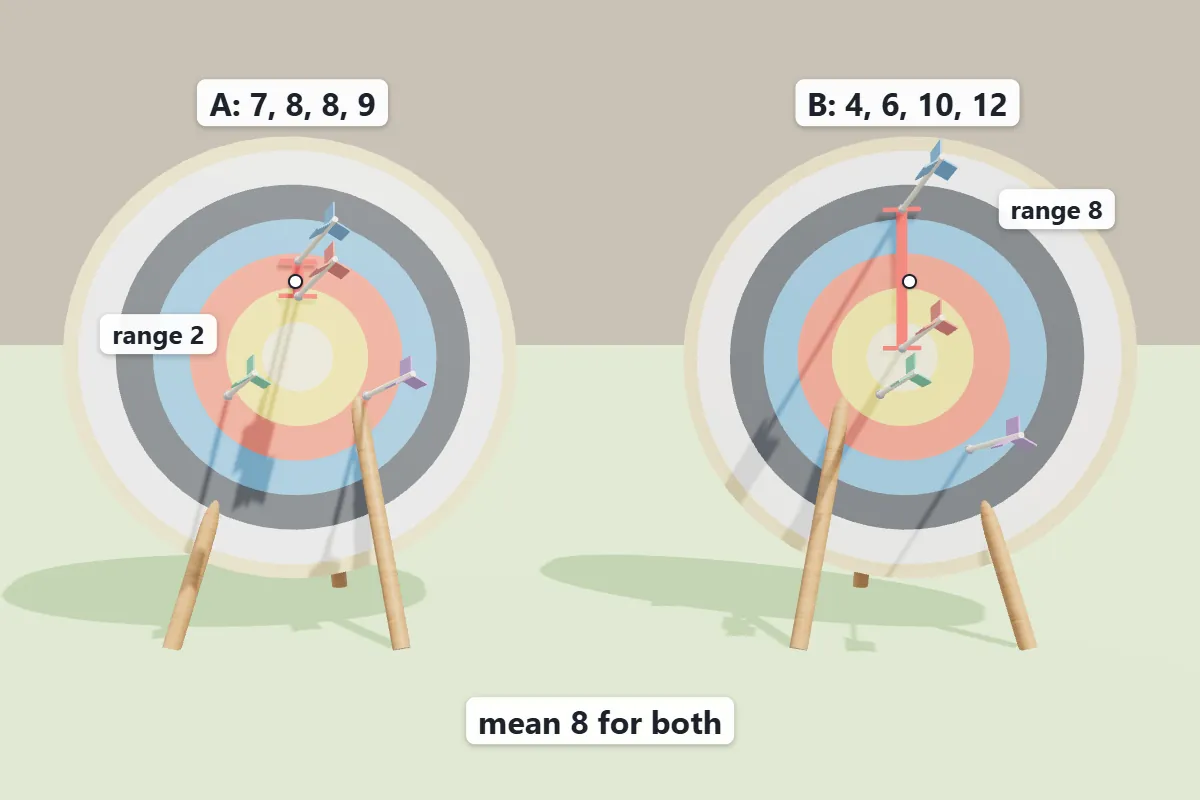
├── 4-2 The need for dispersion
├── 4-3 The range (raw data, frequency table, stem-and-leaf)
├── 4-4 Quartiles and the interquartile range
├── 4-5 The box plot
├── 4-6 Deviation, variance and standard deviation
│   ├── raw values
│   ├── simple frequency distribution
│   └── grouped classes with midpoints
├── 4-7 Using the scientific calculator
├── 4-8 Comparing two data sets
├── 4-9 Effect of adding or multiplying on the measures
└── 4-10 Outliers and choosing a measure
Unit 4: Statistics — Measures of Dispersion · 1 / 14
Well done! You finished this lesson
What would you like to do next?