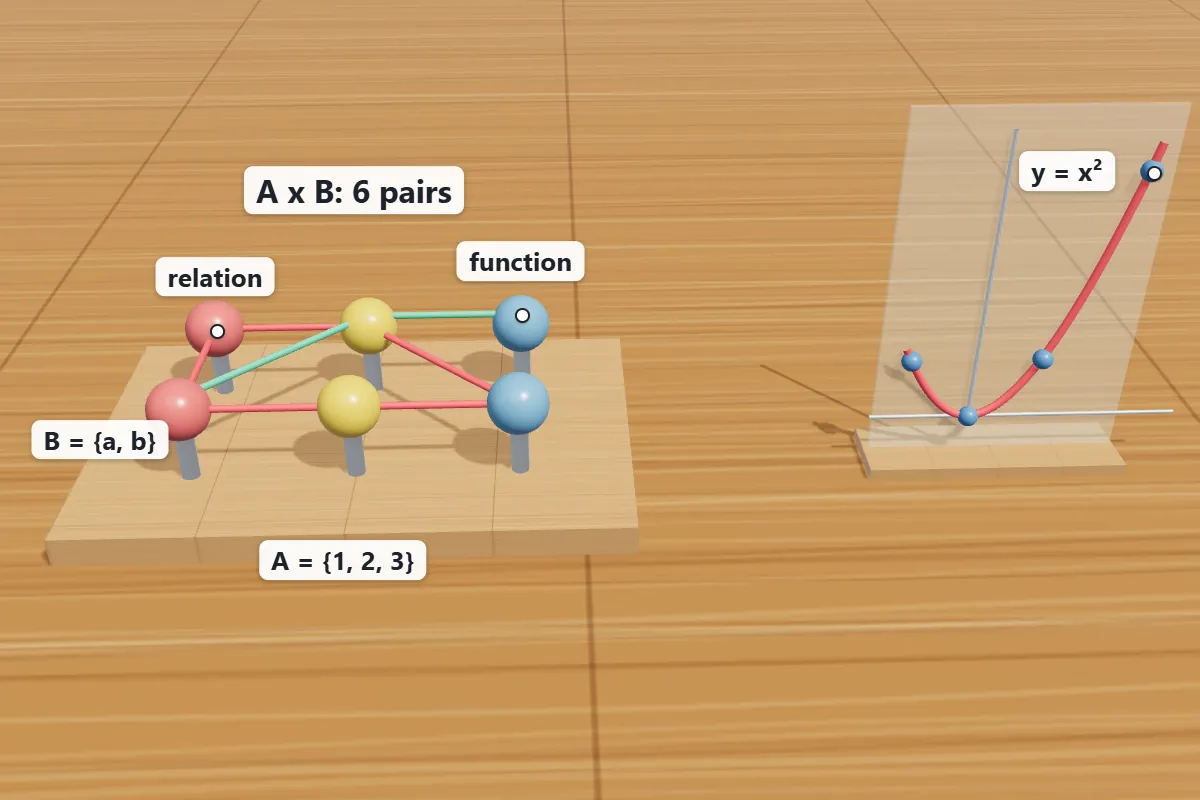
A relation from X to Y is a function (also called a mapping) when every element of X is the first element of exactly one ordered pair.
In the arrow diagram, this means that each element of X has exactly one outgoing arrow.
Important the test checks only the set X. Elements of Y may receive several arrows, or none, and the relation is still a function. Only an element of X with two outputs, or with no output at all, breaks the rule.
A function is usually written as y = f(x). The value f(x) is the image of x, and the set of all images is the range.
Linear and quadratic functions
A linear function f(x) = mx + c graphs as a straight line.
A quadratic function f(x) = ax2 + bx + c, where a is not zero, graphs as a parabola.
The main facts about a parabola are:
Comparison aspect
Main idea
Keywords
Vertex
the point (−b ÷ 2a
f(−b ÷ 2a))
point
Axis of symmetry
the vertical line x = −b ÷ 2a through the vertex
verticallinethroughvertex
Direction
if a > 0 the parabola opens upward and the vertex is the minimum point
if a < 0 it opens downward and the vertex is the maximum point
Equal ordered pairs have equal first elements and equal second elements. So x + 2 = 5 gives x = 3
and 3y − 1 = 11 gives y = 4
Equalorderedpairsfirst
Example 3 (a function).
X = {1
4} and Y = {1
6}. The relation R is defined by y = x + 2. Write R
decide whether it is a function
and state the domain and range
relationdefinedWritedecide
Comparison aspect
Main idea
Keywords
Solution
R = {(1
6)}. Each element of X appears exactly once as a first element
so R is a function. The domain is {1
and the range is {3
elementappearsexactlyonce
Example 4 (not a function).
S = {(−1
2)} is a relation from X = {−1
1} to Y = {0
2}. Decide whether S is a function
relationDecidewhether
Solution
The element 1 of X is the first element of two pairs
0) and (1
2). One input has two outputs
so S is not a function. It does not matter that the output 0 comes from two different inputs
because the test looks only at the inputs
elementfirstpairsinput
Example 5 (vertex and axis).
Find the vertex and axis of symmetry of f(x) = x2 − 6x + 8
then sketch the table of values for 0 ≤ x ≤ 6
Findsymmetrythensketch
Comparison aspect
Main idea
Keywords
Solution
a = 1 and b = −6
so the axis is x = −(−6) ÷ 2 = 3. Then f(3) = 9 − 18 + 8 = −1. The vertex is (3
−1). The table is: x = 0
6 gives f = 8
8. The parabola opens upward because a = 1 > 0
so the minimum value is −1
axisThenvertextable
Example 6 (maximum value).
Find the maximum value of f(x) = −2x2 + 8x − 3 and the value of x where it occurs
Findoccurs
Solution
a = −2 is negative
so the parabola opens downward and the vertex is the maximum point. The axis is x = −8 ÷ (2 × (−2)) = 2. Then f(2) = −8 + 16 − 3 = 5. The maximum value is 5
at x = 2
negativeparabolaopensdownward
Example 7 (range on an interval).
For f(x) = 2x2 − 4x + 5
find the range of f when −1 ≤ x ≤ 3
find
Solution→The vertex is at x = 4 ÷ 4 = 1, which lies inside the interval. f(1) = 2 − 4 + 5 = 3, and this is the minimum. At the endpoints, f(−1) = 2 + 4 + 5 = 11 and f(3) = 18 − 12 + 5 = 11. So the range is all values from 3 to 11, written [3, 11].