Curriculum
Mathematics — Third Preparatory
Unit 1
0/20
1.11-1 The base, the exponent, and the product and quotient of powers1.21-2 The zero exponent and the negative exponent1.31-3 Power of a power, of a product and of a quotient1.41-4 Sign of a power: even and odd exponents1.51-5 Powers, square roots and fractional exponents1.61-6 Simplifying expressions that combine several laws1.71-7 Exponential equations by equalising the base1.81-8 Equations with negative exponents and fractions1.91-9 Equations solved by taking out a common factor1.101-10 Equations in which the unknown is the base1.111-11 Real-life applications1.121-12 Summary of the laws of this unit1.13Exam traps and key takeaways
Unit 2
0/121.12-1 The quadratic function: definition, values and points1.22-2 The vertex form y = a(x − h)2 + k1.32-3 The vertex from the general form1.42-4 Sketching the parabola1.52-5 Maximum and minimum applications1.62-6 Polynomial functions and their degree1.72-7 Zeros of a polynomial function1.82-8 The rational algebraic function, its domain and simplifying1.92-9 Common domain of two functions and equality of functions1.102-10 Addition, subtraction, multiplication and division1.112-11 Additive and multiplicative inverses, and properties1.12Exam traps and key takeaways
Unit 3
0/121.13-1 The two conditions of similarity and the ratio of perimeters and areas1.23-2 Cases of similarity of triangles and the parallel line1.33-3 Real-life applications of similarity1.43-4 The dilation and its properties1.53-5 Dilation on the coordinate plane1.63-6 Sides relative to an angle, and the definitions of sin, cos and tan1.73-7 Finding side lengths and complementary angles1.83-8 Exact ratios of 30°, 45° and 60°1.93-9 Using the calculator and applications of trigonometry1.103-10 The slope of a line, parallel and perpendicular lines1.113-11 Equations of a line and the intercepts1.12Exam traps and key takeaways
Unit 4
0/131.14-1 Measures of central tendency: recap1.24-2 Why do we need measures of dispersion?1.34-3 The range1.44-4 The median recap, quartiles and the interquartile range1.54-5 The box plot (box-and-whisker)1.64-6 Deviation, variance and standard deviation of a set of values1.74-7 Standard deviation of a simple frequency distribution1.84-8 Standard deviation of a grouped (class) distribution1.94-9 Using the scientific calculator1.104-10 Comparing two data sets1.114-11 Effect of adding or multiplying every value1.124-12 Outliers and choosing the right measure1.13Exam traps and key takeaways
Text lesson
Unit 4: Statistics — Measures of Dispersion
Unit 4: Statistics — Measures of Dispersion
Overview
Overview
- Explain why measures of central tendency alone are not enough and what a measure of dispersion adds.
- Compute the range, the quartiles, the interquartile range and represent them in a box plot.
- Compute the variance and the standard deviation for raw data, a simple frequency table and a grouped distribution.
- Compare two data sets, predict the effect of adding or multiplying every value, and choose the suitable measure in the presence of outliers.
Measures of Dispersion
├── 4-1 Recap of central tendency (mean, median, mode)
├── 4-2 The need for dispersion
├── 4-3 The range (raw data, frequency table, stem-and-leaf)
├── 4-4 Quartiles and the interquartile range
├── 4-5 The box plot
├── 4-6 Deviation, variance and standard deviation
│   ├── raw values
│   ├── simple frequency distribution
│   └── grouped classes with midpoints
├── 4-7 Using the scientific calculator
├── 4-8 Comparing two data sets
├── 4-9 Effect of adding or multiplying on the measures
└── 4-10 Outliers and choosing a measure
Unit 4: Statistics — Measures of Dispersion · 1 / 14
4-1 Measures of central tendency: recap
4-1 Measures of central tendency: recap
| Comparison aspect | Main idea | Keywords |
|---|---|---|
| Mean |
| valuesnumberfrequencytable |
| Median |
| middlevalueaftersorting |
| Mode |
| mostfrequentvalue |
| • | All three describe the centre only — they say nothing about how the values are spread | threedescribecentrenothing |
Unit 4: Statistics — Measures of Dispersion · 2 / 14
4-2 Why do we need measures of dispersion?
4-2 Why do we need measures of dispersion?
- Two data sets can share the same mean and still behave very differently: {10, 10, 10} and {1, 10, 19} both have mean 10, but the second is far more spread out.
- A measure of dispersion quantifies how scattered the values are around the centre, which is what consistency, risk and stability mean in real decisions.
- Examples of decisions that need dispersion choosing the more consistent player, the machine with steadier output, or the investment with less variability.
Unit 4: Statistics — Measures of Dispersion · 3 / 14
4-3 The range
4-3 The range
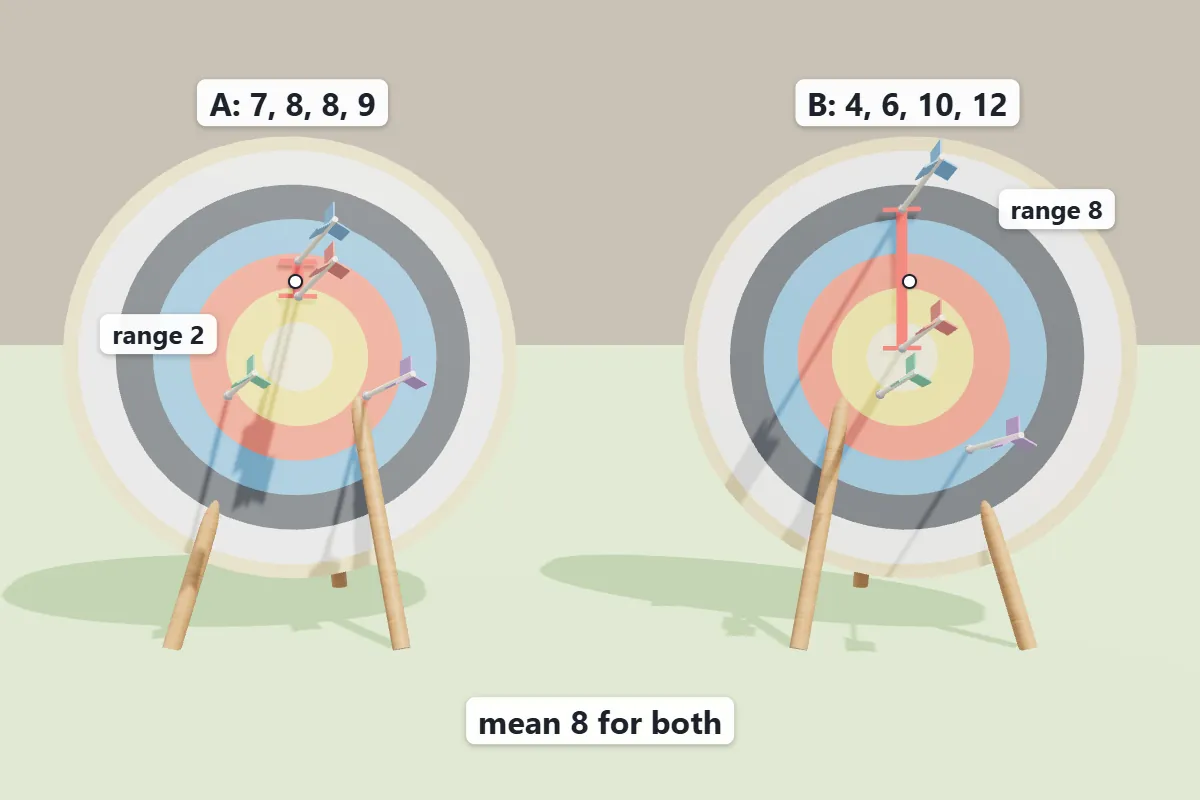
- Range = greatest value − least value ; it uses only two numbers, so it is easy but sensitive to extreme values.
- From a frequency table read the largest and smallest value with a non-zero frequency, not the largest frequency.
- From a stem-and-leaf plot the extremes are the first and last leaves with their stems.
- For a continuous class interval, the range is usually taken as the difference between the upper boundary of the last class and the lower boundary of the first class.
- The range carries the same unit as the data (it is not squared).
Unit 4: Statistics — Measures of Dispersion · 4 / 14
4-4 The median recap, quartiles and the interquartile range
4-4 The median recap, quartiles and the interquartile range
- Sort the data, then split it Q1 is the median of the lower half, Q2 is the median of the whole set, Q3 the median of the upper half.
- Interquartile range (IQR) = Q3 − Q1 the spread of the middle 50% of the data, and unlike the range it is not distorted by extreme values.
- When the count is odd, the common school convention excludes the middle value from both halves.
- Half of the data always lies inside the interval [Q1, Q3], which is why the IQR is used to judge consistency of the bulk of the observations.
Data 4, 6, 7, 9, 14 sorted→median Q2 = 7, lower half {4, 6} → Q1 = 5, upper half {9, 14} → Q3 = 11.5, so IQR = 6.5 and range = 10.
Unit 4: Statistics — Measures of Dispersion · 5 / 14
4-5 The box plot (box-and-whisker)
4-5 The box plot (box-and-whisker)
- A box plot is drawn from exactly five numbers the minimum, Q1, the median, Q3 and the maximum.
- The box spans Q1 to Q3 (so its length is the IQR), the line inside the box is the median, and the whiskers reach the least and greatest values.
- Reading it a longer box means more spread in the middle 50%; a whisker much longer than the other signals a possible outlier; the side on which the median line sits shows where the data concentrate.
- Two box plots on the same axis compare the two distributions at a glance — position (median) and spread (box length) together.
Unit 4: Statistics — Measures of Dispersion · 6 / 14
4-6 Deviation, variance and standard deviation of a set of values
4-6 Deviation, variance and standard deviation of a set of values
- The deviation of a value is x − x̄; the deviations always sum to zero, which is why they are squared.
- Variance σ2 = Σ(x − x̄)2 / n and standard deviation σ = √σ2 — the SD returns to the original unit of the data, so it is the more usable number.
- σ = 0 only when all the values are equal; the larger σ, the more scattered the data.
- Shortcut formula σ2 = (Σx2/n) − (x̄)2 — often faster and less rounded.
For 4, 6, 7, 9, 14→x̄ = 8; the squared deviations are 16, 4, 1, 1, 36 with sum 58, so σ2 = 58/5 = 11.6 and σ ≈ 3.41.
Unit 4: Statistics — Measures of Dispersion · 7 / 14
4-7 Standard deviation of a simple frequency distribution
4-7 Standard deviation of a simple frequency distribution
| Comparison aspect | Main idea | Keywords |
|---|---|---|
| Work with columns x, f, fx and fx2 |
| Σfx2 |
| Each squared deviation is weighted by its frequency | σ2 = Σf(x − x̄)2 / Σf — the two forms give the same result | formsgivesameresult |
| • |
| Buildtablefullybefore |
Unit 4: Statistics — Measures of Dispersion · 8 / 14
4-8 Standard deviation of a grouped (class) distribution
4-8 Standard deviation of a grouped (class) distribution
- Replace each class by its midpoint x = (lower + upper)/2 and treat the table as a frequency distribution with those midpoints.
- Then apply σ2 = Σfx2/Σf − (Σfx/Σf)2; the answer is an estimate because the real values inside a class are unknown.
- Use class boundaries, not the printed limits, when computing midpoints of continuous classes such as 10–19, 20–29.
- Quartiles of grouped data are read from the cumulative-frequency curve or located in the class containing the required position.
Unit 4: Statistics — Measures of Dispersion · 9 / 14
4-9 Using the scientific calculator
4-9 Using the scientific calculator
- Enter statistics mode (usually MODE → STAT → 1-VAR), type each value with its frequency, then read x̄, σn (population SD) and σn−1 (sample SD) from the menu.
- The syllabus uses σn (divide by n); do not copy σn−1 (divide by n − 1) by mistake.
- Frequencies are entered through the frequency column; forgetting it treats each value as appearing once.
- Keep the unrounded calculator value until the final step, then round to the required number of decimal places.
Unit 4: Statistics — Measures of Dispersion · 10 / 14
4-10 Comparing two data sets
4-10 Comparing two data sets
- Compare centre with the mean (or median) and consistency with the standard deviation or the IQR: the smaller the dispersion, the more consistent the performance.
- Standard deviation is in the data’s unit, so it is directly comparable only when the two means are close; otherwise use the coefficient of variation CV = (σ / x̄) × 100% and pick the smaller percentage.
- Typical wording “which player is more consistent?” — the answer is the one with the smaller SD/IQR, even if his mean score is lower.
- Justify with numbers in the answer sentence; a bare name earns no mark.
Unit 4: Statistics — Measures of Dispersion · 11 / 14
4-11 Effect of adding or multiplying every value
4-11 Effect of adding or multiplying every value
| Comparison aspect | Main idea | Example | Keywords |
|---|---|---|---|
| Adding a constant c to every value |
| — | meanmedianincreasequartiles |
| Multiplying every value by k |
| — | meanmedianquartilesrange |
| • | Change of unit ( |
| Changeunitmetrescentimetres |
Unit 4: Statistics — Measures of Dispersion · 12 / 14
4-12 Outliers and choosing the right measure
4-12 Outliers and choosing the right measure
- An outlier is a value far removed from the rest; it drags the mean and inflates the standard deviation and the range, but barely affects the median and the IQR.
- A common test flags a value as an outlier if it lies below Q1 − 1.5 × IQR or above Q3 + 1.5 × IQR.
- When an outlier is present (or the distribution is heavily skewed), report the median with the IQR; otherwise the mean with the standard deviation is the better pair.
- Never delete an outlier silently either justify its removal (measurement error) or keep it and switch to the robust measures.
Unit 4: Statistics — Measures of Dispersion · 13 / 14
Exam traps and key takeaways
Exam traps and key takeaways
💡 High-yield traps
- Equal means do not mean equal data — dispersion is the missing information.
- Deviations sum to zero; that is exactly why we square them.
- Variance is in squared units; the standard deviation restores the original unit.
- Range uses extremes only, so one outlier changes it completely; the IQR does not.
- For an even number of values the median is the mean of the two middle values — not their sum, and not the value between them in position only.
- In a frequency table the range uses the smallest and largest values with non-zero frequency.
- σ2 = Σfx2/Σf − (x̄)2 subtract the square of the mean, not the square of Σfx.
- For grouped data use midpoints and call the result an estimate.
- Calculator choose σn, not σn−1.
- Adding a constant leaves SD unchanged; multiplying scales SD by |k| and variance by k2.
- More consistent = smaller SD / smaller IQR, not the larger mean.
- Compare different-scaled data with the coefficient of variation, not with raw SD.
Unit 4: Statistics — Measures of Dispersion · 14 / 14
Well done! You finished this lesson
What would you like to do next?