Curriculum
Login

Curriculum

Mathematics — Third Preparatory

Text lesson

Lesson 1 – Cartesian Product, Relations, Functions and Quadratic Graphing
Mathematics — Third Preparatory

Lesson 1 – Cartesian Product, Relations, Functions and Quadratic Graphing

Ordered pairs and the Cartesian product

Ordered pairs and the Cartesian product

  • An ordered pair (a, b) is a pair of elements in which the order matters.
  • The first element is a and the second element is b.
  • So (2, 5) and (5, 2) are different points, and (a, b) = (c, d) only when a = c and b = d.
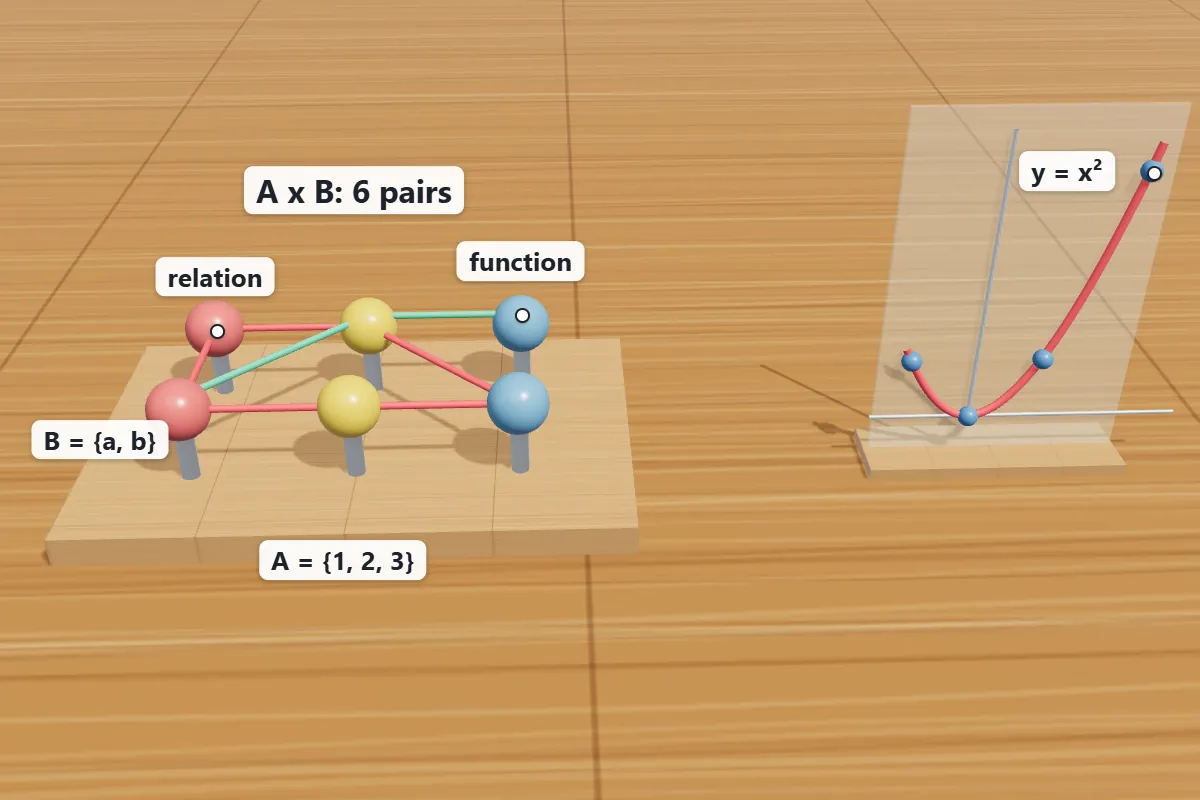
A pegboard shows the Cartesian product of sets A and B with 3 x 2 = 6 ordered pairs, as relations and functions.
  • The Cartesian product of two sets X and Y is the set of all ordered pairs whose first element comes from X and whose second element comes from Y:
  • X × Y = {(x, y) x in X and y in Y}
  • If X has 3 elements and Y has 4 elements, then X × Y has 3 × 4 = 12 ordered pairs.
  • In general, n(X × Y) = n(X) × n(Y).
  • The product is not commutative.
  • X × Y and Y × X contain pairs with the coordinates swapped, so they are equal only when X = Y or one of the sets is empty.
Three ways to show a Cartesian product
Listwrite all the pairs inside braces.
Tableput the elements of X down the side and the elements of Y across the top, then fill each cell with the pair.
Griddraw the elements of X on the horizontal axis and the elements of Y on the vertical axis, then mark a point at every pair.
Lesson 1 – Cartesian Product, Relations, Functions and Quadratic Graphing · 1 / 7
Relations, domain, codomain and range

Relations, domain, codomain and range

  1. A relation R from a set X to a set Y is any subset of X × Y.
  2. It connects some elements of X with some elements of Y.
  3. The three important sets for a relation are:
  • Domain the set of all first elements of the pairs in R. It is a subset of X.
  • Codomain the set Y that the relation maps into.
  • Range the set of all second elements of the pairs in R. It is a subset of Y.
  • A relation can be shown as a set of pairs, as an arrow diagram, or as points on a grid.
  • In an arrow diagram, each arrow goes from an element of X to an element of Y.
  • Some elements of Y may receive no arrow, and an element of X may send more than one arrow.
Lesson 1 – Cartesian Product, Relations, Functions and Quadratic Graphing · 2 / 7
Functions and the function test

Functions and the function test

  • A relation from X to Y is a function (also called a mapping) when every element of X is the first element of exactly one ordered pair.
  • In the arrow diagram, this means that each element of X has exactly one outgoing arrow.
  • Important the test checks only the set X. Elements of Y may receive several arrows, or none, and the relation is still a function. Only an element of X with two outputs, or with no output at all, breaks the rule.
  • A function is usually written as y = f(x). The value f(x) is the image of x, and the set of all images is the range.

Linear and quadratic functions

  • A linear function f(x) = mx + c graphs as a straight line.
  • A quadratic function f(x) = ax2 + bx + c, where a is not zero, graphs as a parabola.
  • The main facts about a parabola are:
Comparison aspectMain ideaKeywords
Vertex
  • the point (−b ÷ 2a
  • f(−b ÷ 2a))
point
Axis of symmetrythe vertical line x = −b ÷ 2a through the vertexverticallinethroughvertex
Direction
  • if a > 0 the parabola opens upward and the vertex is the minimum point
  • if a < 0 it opens downward and the vertex is the maximum point
parabolaopensupwardvertex
Lesson 1 – Cartesian Product, Relations, Functions and Quadratic Graphing · 3 / 7
Graphing quadratic functions with a table

Graphing quadratic functions with a table

  • To draw a quadratic graph, find the vertex first and then choose x-values on both sides of it.
  • Include the endpoints when the question gives an interval.
  • A small table is the most reliable method:
x −1 0 1 2 3
f(x) = x2 − 2x 3 0 −1 0 3
  • The values are symmetric around x = 1, which is the axis of symmetry.
  • The lowest value, −1, is the minimum, and it occurs at the vertex (1, −1).
  • Two checks help you avoid mistakes.
  • First, the values should be symmetric around the axis.
  • Second, the vertex value must be the smallest value in the table when a is positive, or the largest when a is negative.
  • The x-intercepts, where f(x) = 0, appear on either side of the axis when the vertex is below the x-axis.
Lesson 1 – Cartesian Product, Relations, Functions and Quadratic Graphing · 4 / 7
Worked examples

Worked examples

Comparison aspectMain ideaKeywords
Example 1 (Cartesian product).
  • X = {a
  • b} and Y = {1
  • 3}. Find X × Y and n(X × Y)
Find
Solution
  • X × Y = {(a
  • 3)}. Since n(X) = 2 and n(Y) = 3
  • n(X × Y) = 2 × 3 = 6
  • which agrees with the list
Sinceagreeslist
Example 2 (equal ordered pairs).
  • If (x + 2
  • 3y − 1) = (5
  • 11)
  • find x and y
find
Solution
  • Equal ordered pairs have equal first elements and equal second elements. So x + 2 = 5 gives x = 3
  • and 3y − 1 = 11 gives y = 4
Equalorderedpairsfirst
Example 3 (a function).
  • X = {1
  • 4} and Y = {1
  • 6}. The relation R is defined by y = x + 2. Write R
  • decide whether it is a function
  • and state the domain and range
relationdefinedWritedecide
Comparison aspectMain ideaKeywords
Solution
  • R = {(1
  • 6)}. Each element of X appears exactly once as a first element
  • so R is a function. The domain is {1
  • and the range is {3
elementappearsexactlyonce
Example 4 (not a function).
  • S = {(−1
  • 2)} is a relation from X = {−1
  • 1} to Y = {0
  • 2}. Decide whether S is a function
relationDecidewhether
Solution
  • The element 1 of X is the first element of two pairs
  • 0) and (1
  • 2). One input has two outputs
  • so S is not a function. It does not matter that the output 0 comes from two different inputs
  • because the test looks only at the inputs
elementfirstpairsinput
Example 5 (vertex and axis).
  • Find the vertex and axis of symmetry of f(x) = x2 − 6x + 8
  • then sketch the table of values for 0 ≤ x ≤ 6
Findsymmetrythensketch
Comparison aspectMain ideaKeywords
Solution
  • a = 1 and b = −6
  • so the axis is x = −(−6) ÷ 2 = 3. Then f(3) = 9 − 18 + 8 = −1. The vertex is (3
  • −1). The table is: x = 0
  • 6 gives f = 8
  • 8. The parabola opens upward because a = 1 > 0
  • so the minimum value is −1
axisThenvertextable
Example 6 (maximum value).Find the maximum value of f(x) = −2x2 + 8x − 3 and the value of x where it occursFindoccurs
Solution
  • a = −2 is negative
  • so the parabola opens downward and the vertex is the maximum point. The axis is x = −8 ÷ (2 × (−2)) = 2. Then f(2) = −8 + 16 − 3 = 5. The maximum value is 5
  • at x = 2
negativeparabolaopensdownward
Example 7 (range on an interval).
  • For f(x) = 2x2 − 4x + 5
  • find the range of f when −1 ≤ x ≤ 3
find
Solution→The vertex is at x = 4 ÷ 4 = 1, which lies inside the interval. f(1) = 2 − 4 + 5 = 3, and this is the minimum. At the endpoints, f(−1) = 2 + 4 + 5 = 11 and f(3) = 18 − 12 + 5 = 11. So the range is all values from 3 to 11, written [3, 11].
Lesson 1 – Cartesian Product, Relations, Functions and Quadratic Graphing · 5 / 7
Common mistakes

Common mistakes

  • Reversing the coordinates. The point (2, 5) is not the same as (5, 2), so write the first element from the first set.
  • Checking the codomain instead of the domain. The function test looks at each element of X, not at how often each element of Y is used.
  • Writing the axis as x = b ÷ 2a. The correct formula is x = −b ÷ 2a, so the sign of b changes.
  • Choosing the wrong extreme. When a is positive the vertex is a minimum, and when a is negative it is a maximum.
  • Leaving out the endpoints of an interval when building a table or finding a range.
Lesson 1 – Cartesian Product, Relations, Functions and Quadratic Graphing · 6 / 7
Lesson summary

Lesson summary

  • An ordered pair (a, b) has order; (a, b) = (c, d) means a = c and b = d.
  • X × Y is the set of all pairs with the first element from X and the second from Y, and n(X × Y) = n(X) × n(Y).
  • A relation is a subset of X × Y. Its domain is the set of first elements and its range is the set of second elements.
  • A relation is a function when each element of X appears exactly once as a first element.
  • The graph of f(x) = ax2 + bx + c is a parabola with vertex (−b ÷ 2a, f(−b ÷ 2a)) and axis of symmetry x = −b ÷ 2a.
  • If a is positive, the vertex is a minimum. If a is negative, the vertex is a maximum.
Lesson 1 – Cartesian Product, Relations, Functions and Quadratic Graphing · 7 / 7