2.0Representing Motion
Overview: Representing Motion: Diagrams, Position, Position–Time Graphs and Velocity — American System Physics Revision Notes & Topical Questions
5 min read 7 parts Lesson 2 of 5 Unit quiz
Lesson summary
Draw motion diagrams.Two lines crossing on a position–time graph means the objects are at the same place at the same time.Instantaneous velocity is the slope of the tangent at a point.Velocity can be negative; speed cannot.Displacement can be zero even if distance is not.Vectors …
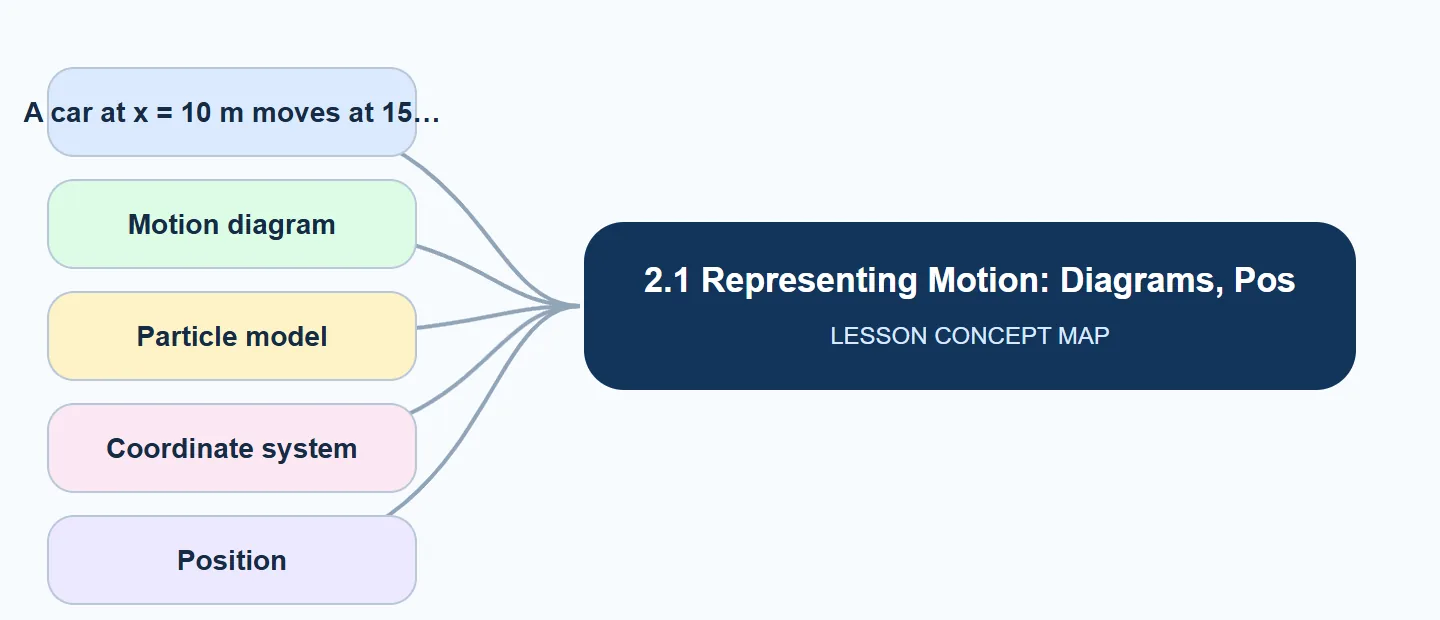
- A car at x = 10 m moves at 15 m/s. Position after 4 s?
- Particle model
- Coordinate system
- Average velocity
- Identify / Describe (FRQ)
- Explain / Justify (FRQ)
Section 1 of 7Overview: Representing Motion: Diagrams, Position, Position–Time Graphs and Velocity
1
2
Average speed = total distance ÷ total time.
3
A motion diagram with equally spaced dots shows constant velocity.
4
Increasing spacing shows speeding up.
5
Time interval Δt = tf − ti.
6
Always include direction for vectors.
Section 2 of 7Process & sequence
1
Choose an origin and positive direction.
2
Record positions at each time.
3
Plot position (y-axis) vs time (x-axis).
4
Slope of the line = velocity.
5
Use x = xi + vt for constant velocity.
From motion to graphwrite these steps in this order; each step is a marking point.
- Choose origin
- Measure positions
- Plot x vs t
- Find slope
- State velocity
Section 3 of 7Compare
| Scalar | Vector |
|---|---|
| Distance | Displacement |
| Speed | Velocity |
| Time | Acceleration |
| Mass | Force |
| Graph | Meaning |
|---|---|
| Horizontal line | At rest |
| Straight line, positive slope | Constant positive velocity |
| Straight line, negative slope | Constant velocity toward origin |
| Steeper line | Faster |
| Curve | Changing velocity |
Section 4 of 7Worked examples
A runner goes 400 m around a track and returns to the start in 80 s. Find average speed and average velocity.
- Speed = 5.0 m/s; velocity = 0 (zero displacement).
A car at x
10 m moves at 15 m/s. Position after 4 s?
- x = 10 + 15 × 4 = 70 m.
Section 5 of 7Key terms
Section 6 of 7Command terms
Command terms
Identify / Describe (FRQ)
A short, specific statement; describing requires relevant characteristics, not a single word.
Explain / Justify (FRQ)
Give the cause-and-effect reasoning or evidence; a restated fact does not score.
Calculate
Show setup, substitution and the answer with units.
Predict
State the expected outcome; add a reason only if asked to justify.
MCQ technique
Read every option; eliminate distractors that are true statements but do not answer the question; watch for NOT/EXCEPT.
Section 7 of 7Exam technique
Keywords the mark scheme looks for in this lesson
Keywords the mark scheme looks for in this lesson
Motion diagram · Particle model · Coordinate system · Position · Distance · Displacement · Average velocity · Speed
Learn each definition in the Key words tab exactly; a missing keyword in a definition usually loses the mark.
How to get full marks (examiner guidance)
1
Answer exactly what is asked; extra correct material does not earn credit, and contradictory statements can cancel credit (AP FRQ).
2
Use precise vocabulary (e.g. “active site”, “concentration gradient”, “allele”), never “it/stuff/things”.
3
Show units and working in calculations.
4
In MCQs, predict the answer before reading the options, then eliminate.
Instant feedbackCheck yourself
Q1. Slope of a position–time graph is
- A. acceleration
- B. velocity
- C. distance
- D. force
Show answer
B. Δx/Δt.
Q2. Which is a vector?
- A. speed
- B. distance
- C. displacement
- D. time
Show answer
C. Has direction.
Q3. A horizontal x–t line means
- A. constant velocity
- B. at rest
- C. accelerating
- D. moving backward
Show answer
B. Position constant.
Q4. xi = 0, v = −3 m/s, t = 5 s. Final position
- A. 15 m
- B. −15 m
- C. −3 m
- D. 8 m
Show answer
B. x = vt.
Last updated: