Skip to content
Dabour HubLEARN · PRACTICE · EXPLORESign inStudent

2.2Representing Motion

Position-Time Graphs — American System Physics Revision Notes & Topical Questions

5 min read 7 parts Lesson 4 of 5 1 quiz

🩺
100% Curriculum Specification Match Lesson Doctor Verified
The only platform with 100% curriculum specification match and verified interactive question banks.
0%read
Lesson summary

Plot and interpret position–time and distance–time graphs.Velocity = slope of position–time graph = Δx/Δt (m/s).Position equation for constant velocityx = vt + xi (x in m, v in m/s, t in s).Speed = slope of distance–time graph = distance ÷ time (m/s).Horizontal line → slope 0 → v…

  • Slope of a position–time graph
  • Instantaneous position
  • Uniform motion
  • Intersection of two lines
  • Equivalent representations
  • Initial position

Part 1 of 7Key ideas

Key ideas
Velocity = slope of position–time graph = Δx/Δt (m/s).
Position equation for constant velocity
Position equation for constant velocity x = vt + xi (x in m, v in m/s, t in s).
Speed = slope of distance–time graph = distance ÷ time (m/s).
1Horizontal line2slope 03velocity 0 (at rest)
Negative slope → moving in the negative direction.
For a curved graph, instantaneous velocity = slope of the tangent at that point.
Two objects meet when xA = xB: vAt + xA,i = vBt + xB,i.

Part 2 of 7Learning objectives

1
Plot and interpret position–time and distance–time graphs.
2
Find velocity from the slope of a position–time graph.
3
Write and use the position equation x = vt + xi.
4
Determine when and where two objects meet.

Part 3 of 7Essential knowledge

1
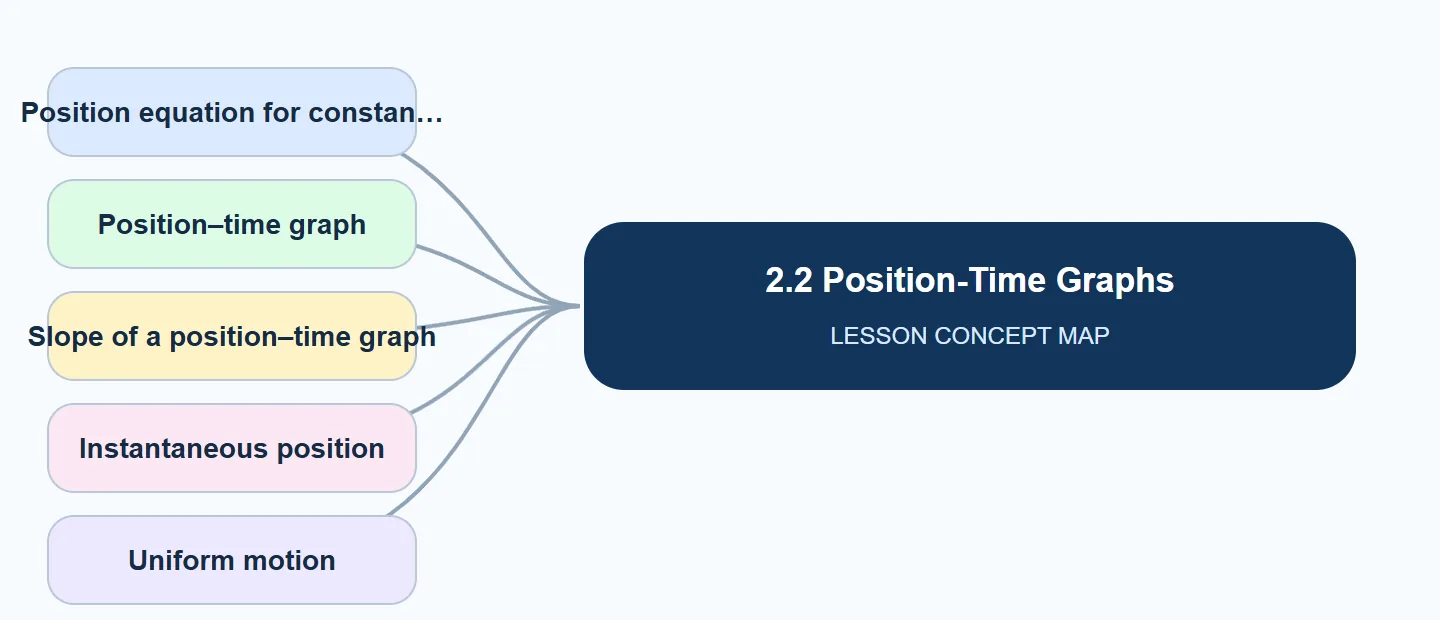
2.2 Position-Time Graphs concept map: Position equation for constan, Position–time graph, Slope of a position–time graph, Instantaneous position, Uniform motion
Visual guide to the key ideas explained in this lesson.
2
A position–time graph is built from a data table of times and positions; time is the independent variable.
3
The y-intercept gives the starting position; the slope gives velocity. A line that slopes upward means motion in the positive direction; downward means motion in the negative direction.
4
On a distance–time graph, the gradient is speed. The graph can only go up or stay level, because distance never decreases.
5
A horizontal section means the object is stationary for that time.
6
A steeper straight line represents a greater (constant) speed. Comparing gradients compares speeds.
7
If the graph is curved, the velocity is changing. Increasing gradient = accelerating; decreasing gradient = decelerating. The instantaneous velocity at a point equals the gradient of the tangent drawn there.
8
The same motion can be described with words, a motion diagram, a table, a graph and an equation. Being able to translate between them is a key skill.
9
When two objects are plotted on the same axes, the point where the lines intersect gives the time and position at which they meet or overtake.
10
Meeting problems can also be solved algebraically by setting the two position equations equal and solving for t.
11
Average speed from a distance–time graph = total distance ÷ total time, even when the graph has several sections.

Part 4 of 7Process & sequence

1
Record positions of the object at regular times (e.g. with a ticker timer, video or light gates) in a table.
2
Plot time on the x-axis and position on the y-axis with labelled axes and units.
3
Draw the best-fit line; decide whether it is straight (uniform motion) or curved (changing velocity).
4
Read the initial position from the y-intercept.
5
Calculate the slope using a large triangle to obtain the velocity with sign.
6
Write the position equation x = vt + xi and use it to predict positions.
7
For two objects, find where the lines cross, or set their equations equal, to find when and where they meet.

From a table to velocitywrite these steps in this order; each step is a marking point.

1
Tabulate position against time from the experiment.
2
Plot the points with time on the x-axis.
3
Draw the best-fit straight line.
4
Pick two well-separated points on the line and compute Δx/Δt.
5
State velocity with sign and unit, and the intercept as initial position.

Part 5 of 7Worked examples

5.0 m/s
A cyclist's position–time graph is a straight line from x = 20 m at t = 0 to x = 80 m at t = 12 s. Find the velocity and write the position equation.
  • v = Δx/Δt = (80 − 20)/(12 − 0) = 60/12 = 5.0 m/s. xi = 20 m, so x = (5.0 m/s)t + 20 m.
18 s
Car A starts at x = 0 with v = 15 m/s. Car B starts at x = 90 m with v = 10 m/s in the same direction. When and where does A catch B?
  • Set xA = xB: 15t = 10t + 90 → 5t = 90 → t = 18 s. x = 15 × 18 = 270 m.
1.5 m/s
A walker covers 1200 m in 10 min, rests for 5 min, then covers 600 m in 5 min. Find the average speed.
  • Total distance = 1800 m. Total time = 20 min = 1200 s. Average speed = 1800/1200 = 1.5 m/s.

Part 6 of 7Summary

1
A position–time graph shows where an object is at each time.
2
The slope equals velocity; steeper means faster.
3
A horizontal line means at rest.
4
Crossing lines show where and when objects meet.
5
Constant velocity: x = vt + xi.

Part 7 of 7Compare: Compare

Reading position–time graphs
Shape of graphMeaning
Horizontal lineAt rest (velocity 0)
Straight line sloping upConstant velocity in + direction
Straight line sloping downConstant velocity in − direction
Steeper straight lineGreater speed
Curve getting steeperSpeeding up (accelerating)
Curve getting less steepSlowing down (decelerating)
Two lines crossingObjects at same position at that time

Key terms

Command terms

Command terms
Identify / Describe (FRQ)
A short, specific statement; describing requires relevant characteristics, not a single word.
Explain / Justify (FRQ)
Give the cause-and-effect reasoning or evidence; a restated fact does not score.
Calculate
Show setup, substitution and the answer with units.
Predict
State the expected outcome; add a reason only if asked to justify.
MCQ technique
Read every option; eliminate distractors that are true statements but do not answer the question; watch for NOT/EXCEPT.

Exam technique

Keywords the mark scheme looks for in this lesson

Keywords the mark scheme looks for in this lesson
Position–time graph · Slope of a position–time graph · Instantaneous position · Uniform motion · At rest · Intersection of two lines · Equivalent representations · Position equation · Initial position · Curved position–time graph · Distance–time graph
Learn each definition in the Key words tab exactly; a missing keyword in a definition usually loses the mark.

How to get full marks (examiner guidance)

1
Answer exactly what is asked; extra correct material does not earn credit, and contradictory statements can cancel credit (AP FRQ).
2
Use precise vocabulary, never “it/stuff/things”.
3
Show units and working in calculations.
4
In MCQs, predict the answer before reading the options, then eliminate.

Words to avoid

1
the line is flat so the object moves at constant speeda horizontal line on a position–time graph means the object is at rest.
2
the object goes downhilla negative slope means the object moves in the negative direction.
3
the lines cross so the objects have the same speedthey are at the same position at that time.
4
gradient = time/distancegradient = change in position ÷ change in time = velocity.

Last updated: