Theme D — Continuity and change
7. Natural Selection — IB Biology HL Revision Notes & Topical Questions
15 min read 26 parts Lesson 12 of 18 Unit quiz
Lesson summary
Natural Selection, Population Genetics and Evolution — notes: Explain natural and artificial selection, how allele frequencies change, how to use Hardy-Weinberg, and the evidence, mechanisms and diversity effects of evolution and speciation.Phenotypic variation exists between in…
- Changing environments
- Misconception
- Level of action
- Source of variation
- Molecular variation
- Alternative name
Part 1 of 24Process of natural selection
1
Phenotypic variation exists between individuals in a population.
2
Competition for limited resources leads to different survival rates; individuals with advantageous phenotypes compete better.
3
Selective pressures mean individuals with favourable phenotypes are more likely to survive and reproduce (high reproductive fitness, the ability to survive and pass on alleles).
4
Alleles for favourable phenotypes are passed to the next generation.
5
Beneficial alleles become more frequent in the population over time.
Factors
- Factors biotic and abiotic (temperature, water availability) factors influence the rate and direction of evolution.
- (predators, competition)
Changing environments
- Changing environments selection can favour different variants in different generations.
Example
- Example the peppered moth evolved during the industrial revolution.
Misconception
- Misconception environmental change does not immediately change organisms;
- selection acts on existing variation over several generations.
Level of action
- Level of action selection acts on individuals but populations evolve.
Part 2 of 24Variation and fitness
Source of variation
- Source of variation genetic differences; mutations can add new alleles to the gene pool.
Populations with greater variation adapt better to change.
- Some traits raise fitness and others lower it in particular environments.
Molecular variation
- Molecular variation mutations can change the structure, abundance or efficiency of proteins, pigments and enzymes, adding to phenotypic variation on which selection acts.
Traits that increase fitness:
DDT resistance: DDT kills non-resistant insects, resistant ones survive and reproduce, and the resistance allele rises; DDT is the selective pressure.
- Sickle cell traitheterozygotes resist malaria, survive and reproduce in malaria-prevalent areas.
Traits that decrease fitness:
Flowering time under climate change: shifted blooming can miss pollinators,
- so fewer plants are pollinated, seed production falls, populations decline and extinction risk rises.
Part 3 of 24Artificial selection
Method
- Method humans choose individuals with desirable traits, breed them, choose the best offspring and repeat over many generations until the trait frequency rises.
Alternative name
- Alternative name selective breeding.
Examples
- Examples higher milk yield in cattle, faster racehorses, disease-resistant crops.
Use
- Use strengthens one trait or combines several, e.g. high yield, disease resistance and tolerance of poor soil.
Part 4 of 24Changing allele frequencies and mutation
Allele frequency
- Allele frequency how common an allele is in the gene pool;
- a change between generations means evolution is occurring.
Causes
- Causes natural selection, mutation, genetic drift and migration (gene flow).
Mutation
- Mutation a random process that adds new alleles; it is the only source of variation in asexual species.
Advantageous alleles are more likely to be passed on, disadvantageous alleles less likely.
- A mutation in a somatic cell is not inherited, so it cannot affect natural selection.
Part 5 of 24Genetic drift
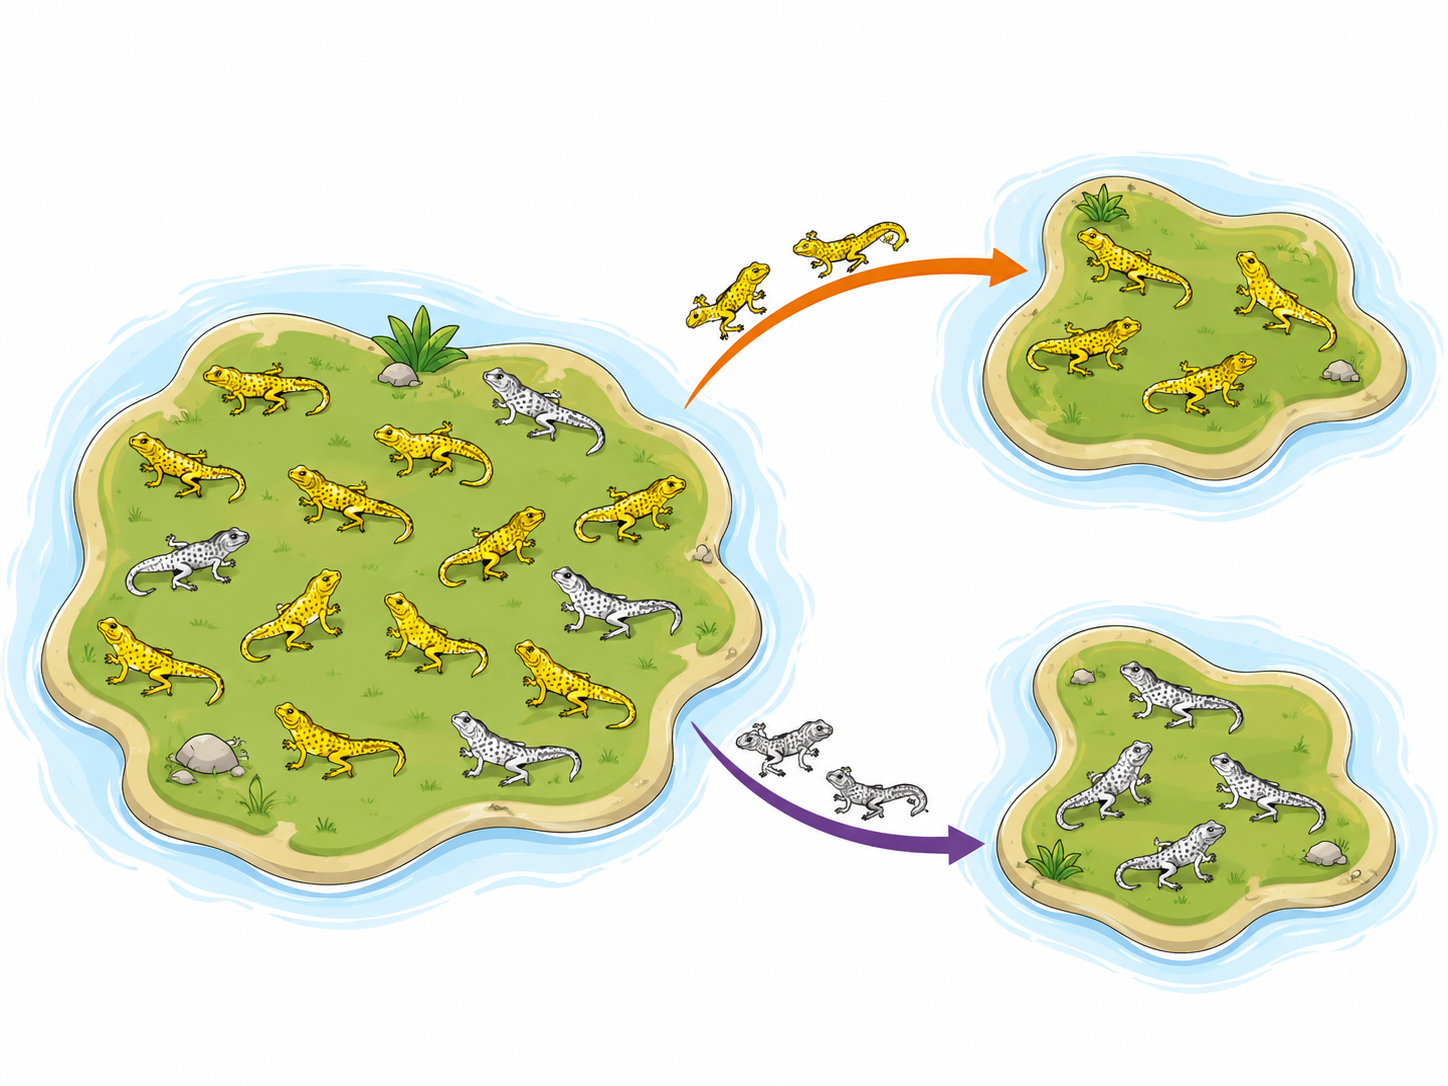
Definition
- Definition a non-selective process where chance events affect which alleles pass to the next generation.
Only half of a parent’s alleles go into gametes, so random events in meiosis and fertilization can lose alleles.
- Alleles may disappear purely by chance.
Population size
- Population size small populations are more susceptible because chance changes are proportionally larger.
With 10 individuals (20 alleles, 10 of allele A, frequency 0.5), the next generation could easily have 8 or 12 copies, i.e. frequency 0.4 or 0.6.
- With 1000 individuals (2000 alleles, 1000 of A), the chance of 800 or 1200 copies is extremely low, so the frequency stays near 0.50.
Result
- Result small populations can diverge from others of the same species without any selection.
Part 6 of 24Bottleneck and founder effects
| Effect | What happens | Example |
|---|---|---|
| Bottleneck | A large population shrinks dramatically for at least one generation (e.g. natural disaster); survivors are often closely related, so genetic diversity falls | Cheetahs had a bottleneck about 10,000 years ago in a climate shift; isolation and inbreeding left modern cheetahs with limited diversity |
| Founder | A small group leaves a larger population to found a new one with only a subset of the alleles, so variation is low and allele frequencies shift | A few white-scaled lizards reach an island on floating debris from a population of white and yellow lizards, founding a population with only white scales |
Part 7 of 24Migration and gene flow
1Migration
- Migration movement of individuals into or out of a population.
2Gene flow
- Gene flow the addition or removal of alleles through migration.
3
It mixes gene pools and can counteract natural selection and drift, preventing accumulation of genetic differences.
- It stops populations diverging into separate species.
Part 8 of 24Hardy-Weinberg conditions
Principle
- Principle if conditions are met, allele frequencies do not change from one generation to the next.
Uses
- Uses the equation calculates allele and genotype frequencies and predicts how they change.
Conditions
- Conditions large population, no migration, no new mutations, random mating and no natural selection.
These are rarely all met in nature, but the principle gives a useful null hypothesis for evaluating genetic change.
Part 9 of 24Hardy-Weinberg equations
Hardy-Weinberg equations
Genotypes
- Genotypes for alleles B and b: homozygous dominant BB, heterozygous Bb, homozygous recessive bb; frequencies are proportions.
- (all BB = 1, half = 0.5)
Allele frequencies
- Allele frequencies p is the dominant allele (B) and q is the recessive (b), so p + q = 1.
Example: 100 individuals have 200 alleles; 120 are B, so p = 120 ÷ 200 = 0.6 and q = 0.4.
Genotype frequencies
- BB = p2, Bb = 2pq and bb = q2, so p2 + 2pq + q2 = 1.
Starting point
- Starting point always begin with the recessive phenotype, the only one whose genotype is certain.
- (homozygous recessive)
Part 10 of 24Worked Hardy-Weinberg examples
1
Birds: 10% have white feathers (recessive ff), so q2 = 0.1.
2
q = √0.1 = 0.32 and p = 1 − 0.32 = 0.68.
3
p2 (FF) = 0.682 = 0.46.
4
2pq (Ff) = 2 × 0.68 × 0.32 = 0.44.
5
Check: 0.46 + 0.44 + 0.10 = 1.
Interpreting data
- Interpreting data in a beetle figure, population X shows A (p) rising and a (q) falling,
- so evolution is occurring and it is not in Hardy-Weinberg equilibrium.
Population Y
- Population Y allele frequencies stay constant, so evolution is not occurring.
- (p = 0.6, q = 0.4)
Part 11 of 24Evidence for evolution
Sources
- Sources living species, fossils, and molecular, morphological and genetic comparisons.
Geological evidence
- Geological evidence fossil distribution and rock strata trace change over time.
Geographical evidence
- Geographical evidence species distribution links to shared ancestry; Galapagos finches and Hawaiian honeycreepers show adaptive radiation,
- and honeycreepers show continuous variation across their range, suggesting gradual divergence.
Physical evidence
- Physical evidence fossils and homologous structures;
- transitional fossils such as Archaeopteryx bridge dinosaurs and birds.
Biochemical evidence
- DNA and protein sequence comparisons.
Mathematical models
- Mathematical models molecular clocks use mutation rates to estimate divergence times.
More differences between nucleotide sequences means an older common ancestor.
Part 12 of 24Dating fossils and morphological evidence
Dating fossils and morphological evidence
Radiometric dating
- Radiometric dating carbon-14 in an organism decays at a known rate (half-life), so its remaining level shows how long ago it died.
The layers where fossils lie can also be dated.
- Combining fossil dating with geographical data builds timelines of evolution and locates common ancestors.
Homologous structures
- Homologous structures similar structures with different functions through common ancestry, e.g. the pentadactyl limb,
- which has the same basic layout in different species.
Vestigial structures
- Vestigial structures evolutionary leftovers such as pelvic bones in whales and wings in flightless birds.
- (also the human appendix)
Part 13 of 24Molecular, cellular and structural evidence
1Sequence similarity
- DNA (e.g. Hox genes) and protein sequences show relationships; higher similarity means closer relationship and more recent divergence.
- (e.g. haemoglobin)
2
Sequencing results are used to build evolutionary trees.
3Conserved processes
- DNA replication, cellular respiration and protein synthesis show shared ancestry.
4Shared structures
- Shared structures ribosomes in all cells make proteins;
- shared genetic code and phospholipid bilayers indicate a common origin.
5Eukaryote evidence
- Eukaryote evidence membrane-bound organelles, linear chromosomes and introns support a common eukaryotic lineage; endosymbiosis explains the origin of mitochondria and chloroplasts.
- (versus circular in prokaryotes)
Part 14 of 24Continuing evolution
Genomic changes
- Genomic changes mutations and drift drive divergence; bigger differences mean a more distant ancestor.
Fossil record
- Fossil record continuous change in traits.
Resistance
- Resistance antibiotic-resistant bacteria such as MRSA, pesticide (DDT) and herbicide resistance,
- and cancer cells resistant to chemotherapy show natural selection acting.
Emerging pathogens
- Emerging pathogens seasonal flu changes antigens by mutation so vaccines lose effect,
- and COVID-19 shows rapid pathogen evolution under environmental pressure.
Part 15 of 24Cladograms and phylogenetic trees
Purpose
- Purpose diagrams of hypothetical evolutionary relationships;
- they are testable and revised as evidence emerges.
Cladogram
- Cladogram shows branching pattern only, with no time scale or amount of change.
Phylogenetic tree
- Phylogenetic tree also shows amount of change or time, calibrated with fossils or a molecular clock.
Building
- Building use gained or lost traits from morphology of living species, fossils and molecular data.
Molecular data are usually more reliable because morphology can mislead through convergent evolution (e.g. wings in bats, birds and insects).
- Shared characteristics indicate shared history;
- shared derived characteristics (synapomorphies) define a clade.
- Nodes are common ancestors and a split is a speciation event;
- a more recent common ancestor means closer relatives;
- the root is the ancestor of all members.
Part 16 of 24Reading a cladogram
1
Find the node for the common ancestor of the group of interest, e.g. all vertebrates.
2
Count the nodes back to the shared ancestor: more nodes (e.g. five between placental mammals and coelacanths) means a more distant relationship.
3
Three clades joined to one ancestor mean there was not enough data to decide which are closer.
4
Clades that share a recent node are more closely related to each other than to any other clade.
5
A group such as reptiles that omits birds (which share its ancestor) is not a true clade.
- Molecular clock
- DNA mutations occur at a fairly constant rate, so more sequence differences mean the species diverged longer ago.
Part 17 of 24Speciation and reproductive isolation
1Species (biological species concept)
- Species (biological species concept) a group able to interbreed and exchange genes to produce viable, fertile offspring.
2Speciation
- Speciation evolution of a new species.
Speciation and reproductive isolation
Gene flow between groups is restricted.
The groups evolve differently under different selection pressures.
Over time genetic differences stop them producing fertile offspring; they are reproductively isolated and now separate species.
Part 18 of 24Rate of speciation and patterns of evolution
| Pattern | Description | Evidence or example |
|---|---|---|
| Gradualism | Speciation by accumulation of small changes over time | Slow long-term fossil changes; Darwin cited vestigial structures (human appendix, flightless-bird wings) and descent through intermediate species |
| Punctuated equilibrium | Long stability then short bursts of rapid change, e.g. after volcanic eruptions or meteor strikes | Fossil breaks with no intermediates |
| Divergent evolution (adaptive radiation) | New habitats let groups evolve adaptations for different niches; different selection pressures build differences leading to speciation | Darwin’s finches |
| Convergent evolution | Similar selection pressures give similar traits in unrelated species | Dolphins (mammals) and sharks (fish) have separately evolved streamlined bodies |
Part 19 of 24Allopatric and sympatric speciation
Allopatric speciation
- Allopatric speciation geographical isolation by natural barriers or man-made ones (roads) stops gene flow.
- (mountains, rivers)
Selection and drift change allele frequencies and phenotypes, so populations become physiologically, behaviourally and morphologically distinct.
- Hawaiian Drosophila
- ancestors colonised the islands, new islands formed and isolated populations;
- climate, food and habitat differences and drift produced D. silvestris on Hawai’i and D. planitibia on Maui.
- ancestors colonised the islands, new islands formed and isolated populations;
- Caribbean Anolisone colonising species diverged into about 150 species on different islands.
Sympatric speciation
- Sympatric speciation no geographical barrier; groups in the same place diverge with no gene flow.
Ecological separation: groups live in different environments in the same area, e.g. different soil pH.
- Behavioural separation: different feeding, communication or social behaviour.
- Apple maggot fly (Rhagoletis pomonella): some flies moved from hawthorn to apples, preferred their host fruit and mated near it,
- so gene flow stopped and two populations arose.
Part 20 of 24Maintaining reproductive isolation
| Type | Barrier | Description |
|---|---|---|
| Pre-zygotic | Habitat | Different locations, so no mating |
| Pre-zygotic | Temporal | Different activity periods or breeding seasons |
| Pre-zygotic | Behavioural | Incompatible behaviours such as mating calls or dances |
| Pre-zygotic | Mechanical | Incompatible reproductive organs block gamete exchange |
| Pre-zygotic | Gametic | Gametes cannot fuse |
| Post-zygotic | Reduced hybrid viability | Hybrids die before reproducing, so allele mixing lasts one generation |
| Post-zygotic | Hybrid breakdown | Hybrids are viable and fertile but later generations weaken and disappear |
Part 21 of 24Genetic diversity and resilience
Genetic diversity
- Genetic diversity the variety of alleles in a population; it is crucial for long-term survival.
Alleles useful in one environment may become harmful under new pressures.
- High diversity makes it more likely that some individuals have adaptive traits;
- low diversity raises the risk of decline or extinction.
California condor
- California condor fell in the twentieth century from DDT, poaching and lead poisoning, and low numbers reduced diversity and resilience.
Black-footed ferret
- Black-footed ferret critically endangered, depends on prairie dogs,
- which declined from habitat loss and extermination; low diversity increases vulnerability.
Prairie chicken
- Prairie chicken habitat lost to agriculture caused severe loss of diversity linked to poor reproduction and higher extinction risk.
Part 22 of 24Diversity in crops and bacteria
Potato blight
- Phytophthora infestans spreads by spores, darkens leaves and ruins potato and tomato crops.
Different varieties carry different resistance alleles, so a diverse crop is less likely to be wiped out.
Corn rust
- Corn rust fungal disease; low genetic diversity in cultivated maize makes widespread infection more likely.
Antibiotic resistance
- Antibiotic resistance in a diverse bacterial population some carry resistance alleles.
When exposed, resistant bacteria survive and reproduce, passing on the alleles.
- Over generations the resistance allele frequency rises, producing a resistant strain.
Part 23 of 24Origins of life on Earth
Geological evidence
- Geological evidence fossils in rocks and rock composition show early conditions.
Earth formed about 4.6 billion years ago (bya) and stayed too hostile for life until about 3.9 bya.
- The earliest fossil evidence of life is 3.5 bya, so life arose between 3.9 and 3.5 bya.
RNA world hypothesis
- RNA world hypothesis early life was based mainly on RNA before DNA and proteins evolved.
Key assumptions —
RNA was the hereditary material, able to replicate and pass information on.
- Base pairing allows accurate RNA replication by building complementary copies;
- without it accurate copying would be impossible.
- Enzymes were not needed because RNA had both genetic and catalytic roles, supported by the discovery of ribozymes, RNA molecules that catalyse reactions.
Part 24 of 24Worked examples
In a population 16% show a recessive trait. Calculate the frequency of heterozygotes. [3]3 marks
Worked examplesq2 = 0.16 so q = 0.4.p = 1 − 0.4 = 0.6.2pq = 2 × 0.6 × 0.4 = 0.48 (48%).Describe how DDT resistance evolves in an insect population. [4]4 marks
1Variation exists; some insects carry resistance alleles from mutation.2DDT kills non-resistant insects (selective pressure).3Resistant insects survive and reproduce, passing on the alleles.4Resistance allele frequency rises over generations.Explain why genetic drift has a larger effect in small populations. [2]2 marks
Worked examplesChance events change allele numbers by a larger proportion when there are fewer copies.Alleles can be lost or fixed quickly, unlike in large populations where sampling error is tiny.Distinguish allopatric from sympatric speciation. [3]3 marks
Worked examplesAllopatric speciation needs geographical isolation by a barrier.Sympatric speciation happens in the same place through ecological or behavioural separation.Both stop gene flow so populations diverge.Explain why molecular data are more reliable than morphology for building trees. [2]2 marks
Worked examplesMorphological similarity can arise by convergent evolution (e.g. wings in bats, birds and insects).Sequence differences accumulate by mutation at a fairly constant rate and reflect actual relatedness.State the conditions required for Hardy-Weinberg equilibrium. [3]3 marks
Worked examplesLarge population and random mating.No migration and no new mutations.No natural selection.
Key terms
| Term | Meaning |
|---|---|
| Fitness | An organism’s ability to survive and pass on its alleles. |
| Genetic drift | Random, non-selective change in allele frequencies. |
| Gene flow | Movement of alleles between populations by migration. |
| Bottleneck effect | Loss of diversity after a sharp drop in population size. |
| Founder effect | Reduced diversity in a population started by a few individuals. |
| Hardy-Weinberg principle | Allele frequencies stay constant when no evolutionary forces act. |
| Allopatric speciation | New species from geographical isolation. |
| Sympatric speciation | New species in the same area without a barrier. |
| Molecular clock | Use of constant mutation rate to date divergence. |
| Reproductive isolation | Inability of populations to produce fertile offspring together. |
Avoid these mistakes
1
Saying individuals evolve — natural selection acts on individuals but populations evolve.
2
Saying organisms change because they need to — variation already exists and the environment selects.
3
Starting Hardy-Weinberg problems from the dominant phenotype — start from the recessive phenotype (q2).
4
Confusing homologous structures (common ancestry, different function) with convergent traits (no common ancestry, same function).
5
Thinking a cladogram shows time — only phylogenetic trees are calibrated for time.
Last updated:
\n