Curriculum
SAAT (Tahsili)
Mathematics · Unit 1: Logic and Geometry
0/25
-
1.1 Mathematical Logic and Proof
 15 minPreview
-
1.1.1 Conditionals, converse, inverse and contrapositive
15 minPreview
-
1.1.1 Conditionals, converse, inverse and contrapositive — Practice
 2 questionsPreview
-
1.1.2 Direct proof and proof by contradiction
15 minPreview
-
1.1.2 Direct proof and proof by contradiction — Practice
2 questionsPreview
-
1.2 Parallelism and Perpendicularity
15 minPreview
-
1.2.1 Angles formed by two parallel lines and a transversal
15 minPreview
-
1.2.1 Angles formed by two parallel lines and a transversal — Practice
1 questionsPreview
-
1.2.2 Slope, equation of a line and perpendicularity
15 minPreview
-
1.2.2 Slope, equation of a line and perpendicularity — Practice
3 questionsPreview
-
1.3 Triangles and Congruence
15 minPreview
-
1.3.1 Triangle angles, properties and triangle inequalities
15 minPreview
-
1.3.1 Triangle angles, properties and triangle inequalities — Practice
4 questionsPreview
-
1.3.2 Triangle congruence cases and justification
15 minPreview
-
1.3.2 Triangle congruence cases and justification — Practice
1 questionsPreview
-
1.4 Quadrilaterals, Similarity and Geometric Transformations
15 minPreview
-
1.4.1 Properties of quadrilaterals and parallelograms
15 minPreview
-
1.4.1 Properties of quadrilaterals and parallelograms — Practice
1 questionsPreview
-
1.4.2 Similarity, side ratios, transformations and coordinates
15 minPreview
-
1.4.2 Similarity, side ratios, transformations and coordinates — Practice
3 questionsPreview
-
1.5 Circles
15 minPreview
-
1.5.1 Chords, tangents and central angles
15 minPreview
-
1.5.1 Chords, tangents and central angles — Practice
3 questionsPreview
-
1.5.2 Power of a point, arcs and sector area
15 minPreview
-
1.5.2 Power of a point, arcs and sector area — Practice
12 questionsPreview
Mathematics · Unit 2: Functions and Matrices
0/19
-
2.1 Real Numbers, Relations and Functions
15 minPreview
-
2.1.1 Real numbers, absolute values and inequalities
15 minPreview
-
2.1.2 Relations, functions, domain and range
15 minPreview
-
2.1.2 Relations, functions, domain and range — Practice
3 questionsPreview
-
2.2 Matrices
15 minPreview
-
2.2.1 Matrix addition, multiplication and determinants
15 minPreview
-
2.2.1 Matrix addition, multiplication and determinants — Practice
2 questionsPreview
-
2.2.2 The inverse matrix and solving linear systems
15 minPreview
-
2.2.2 The inverse matrix and solving linear systems — Practice
1 questionsPreview
-
2.3 Polynomials and Complex Numbers
15 minPreview
-
2.3.1 Polynomial division and the remainder theorem
15 minPreview
-
2.3.1 Polynomial division and the remainder theorem — Practice
2 questionsPreview
-
2.3.2 Complex numbers and roots of equations
15 minPreview
-
2.3.2 Complex numbers and roots of equations — Practice
3 questionsPreview
-
2.4 Inverse, Radical and Rational Functions
15 minPreview
-
2.4.1 The inverse function and radical functions
15 minPreview
-
2.4.1 The inverse function and radical functions — Practice
3 questionsPreview
-
2.4.2 Rational functions and graphing
15 minPreview
-
2.4.2 Rational functions and graphing — Practice
1 questionsPreview
Mathematics · Unit 3: Sequences, Probability and Statistics
0/15
-
3.1 Sequences and Series
15 minPreview
-
3.1.1 Arithmetic sequences and their terms
15 minPreview
-
3.1.1 Arithmetic sequences and their terms — Practice
3 questionsPreview
-
3.1.2 Geometric sequences and infinite series
15 minPreview
-
3.1.2 Geometric sequences and infinite series — Practice
1 questionsPreview
-
3.2 Probability
15 minPreview
-
3.2.1 Counting principles, permutations and combinations
15 minPreview
-
3.2.1 Counting principles, permutations and combinations — Practice
3 questionsPreview
-
3.2.2 Probability, conditional probability and independent events
15 minPreview
-
3.2.2 Probability, conditional probability and independent events — Practice
3 questionsPreview
-
3.3 Statistics
15 minPreview
-
3.3.1 Measures of central tendency and measures of position
15 minPreview
-
3.3.1 Measures of central tendency and measures of position — Practice
2 questionsPreview
-
3.3.2 Dispersion and graphical representation of data
15 minPreview
-
3.3.2 Dispersion and graphical representation of data — Practice
2 questionsPreview
Mathematics · Unit 4: Trigonometry
0/10
-
4.1 Trigonometric Functions and Angle Measure
15 minPreview
-
4.1.1 Measuring angles in degrees, minutes, seconds and on the circle
15 minPreview
-
4.1.1 Measuring angles in degrees, minutes, seconds and on the circle — Practice
2 questionsPreview
-
4.1.2 Trigonometric functions on the unit circle
15 minPreview
-
4.1.2 Trigonometric functions on the unit circle — Practice
12 questionsPreview
-
4.2 Trigonometric Identities and Equations
15 minPreview
-
4.2.1 Trigonometric identities, sum and difference
15 minPreview
-
4.2.1 Trigonometric identities, sum and difference — Practice
19 questionsPreview
-
4.2.2 The laws of sines and cosines and solving triangles
15 minPreview
-
4.2.2 The laws of sines and cosines and solving triangles — Practice
11 questionsPreview
Mathematics · Unit 5: Advanced Functions and Analytic Geometry
0/20
-
5.1 Analyzing Functions and Transformations
15 minPreview
-
5.1.1 Polynomial functions, their zeros and behavior
15 minPreview
-
5.1.1 Polynomial functions, their zeros and behavior — Practice
1 questionsPreview
-
5.1.2 Graph transformations and composition
15 minPreview
-
5.1.2 Graph transformations and composition — Practice
5 questionsPreview
-
5.2 Exponential and Logarithmic Functions
15 minPreview
-
5.2.1 The exponential function, growth and decay
15 minPreview
-
5.2.1 The exponential function, growth and decay — Practice
2 questionsPreview
-
5.2.2 Logarithms, their properties and equations
15 minPreview
-
5.2.2 Logarithms, their properties and equations — Practice
3 questionsPreview
-
5.3 Conic Sections
15 minPreview
-
5.3.1 The circle and the parabola
15 minPreview
-
5.3.1 The circle and the parabola — Practice
2 questionsPreview
-
5.3.2 The hyperbola and the ellipse
15 minPreview
-
5.3.2 The hyperbola and the ellipse — Practice
3 questionsPreview
-
5.4 Vectors and Polar Coordinates
15 minPreview
-
5.4.1 Vectors and operations on them
15 minPreview
-
5.4.1 Vectors and operations on them — Practice
2 questionsPreview
-
5.4.2 Polar coordinates and converting them
15 minPreview
-
5.4.2 Polar coordinates and converting them — Practice
2 questionsPreview
Mathematics · Unit 6: Calculus
0/10
-
6.1 Limits
15 minPreview
-
6.1.1 Evaluating limits algebraically and graphically
15 minPreview
-
6.1.1 Evaluating limits algebraically and graphically — Practice
1 questionsPreview
-
6.1.2 Infinite limits and continuity
15 minPreview
-
6.1.2 Infinite limits and continuity — Practice
2 questionsPreview
-
6.2 Differentiation and Integration
15 minPreview
-
6.2.1 Differentiation rules and derivatives of composite functions
15 minPreview
-
6.2.1 Differentiation rules and derivatives of composite functions — Practice
2 questionsPreview
-
6.2.2 The definite integral and the fundamental theorem of calculus
15 minPreview
-
6.2.2 The definite integral and the fundamental theorem of calculus — Practice
1 questionsPreview
Mathematics · Unit 7: Mathematics question bank with original diagrams
0/1
Mathematics · Mock exams and full tests
0/1
Physics · Unit 1: Physics and Motion
0/20
-
9.1 Introduction to Physics and Measurement
15 minPreview
-
9.1.1 Physical quantities, units and dimensional analysis
15 minPreview
-
9.1.1 Physical quantities, units and dimensional analysis — Practice
3 questionsPreview
-
9.1.2 Precision, measurement and graphing
15 minPreview
-
9.1.2 Precision, measurement and graphing — Practice
2 questionsPreview
-
9.2 Describing Motion and Graphing It
15 minPreview
-
9.2.1 Speed, displacement and distance
15 minPreview
-
9.2.1 Speed, displacement and distance — Practice
2 questionsPreview
-
9.2.2 Motion graphs
15 minPreview
-
9.2.2 Motion graphs — Practice
2 questionsPreview
-
9.3 Acceleration and Free Fall
15 minPreview
-
9.3.1 Acceleration and equations of motion
15 minPreview
-
9.3.1 Acceleration and equations of motion — Practice
1 questionsPreview
-
9.3.2 Free fall and vertical projectiles
15 minPreview
-
9.3.2 Free fall and vertical projectiles — Practice
3 questionsPreview
-
9.4 Vectors and Motion in Two Dimensions
15 minPreview
-
9.4.1 Vectors, addition and resolving components
15 minPreview
-
9.4.1 Vectors, addition and resolving components — Practice
2 questionsPreview
-
9.4.2 Projectile motion and uniform circular motion
15 minPreview
-
9.4.2 Projectile motion and uniform circular motion — Practice
3 questionsPreview
Physics · Unit 2: Forces and Gravity
0/15
-
10.1 Forces and Newton’s Laws
15 minPreview
-
10.1.1 Newton’s three laws and their applications
15 minPreview
-
10.1.1 Newton’s three laws and their applications — Practice
2 questionsPreview
-
10.1.2 Friction, free-body diagrams and tension forces
15 minPreview
-
10.1.2 Friction, free-body diagrams and tension forces — Practice
2 questionsPreview
-
10.2 Gravity and Kepler’s Laws
15 minPreview
-
10.2.1 The law of universal gravitation and weight
15 minPreview
-
10.2.1 The law of universal gravitation and weight — Practice
1 questionsPreview
-
10.2.2 Kepler’s laws, orbits and satellites
15 minPreview
-
10.2.2 Kepler’s laws, orbits and satellites — Practice
4 questionsPreview
-
10.3 Torque, Equilibrium and Center of Mass
15 minPreview
-
10.3.1 Torque and conditions of equilibrium
15 minPreview
-
10.3.1 Torque and conditions of equilibrium — Practice
3 questionsPreview
-
10.3.2 Center of mass, stability and simple machines
15 minPreview
-
10.3.2 Center of mass, stability and simple machines — Practice
1 questionsPreview
Physics · Unit 3: Energy and Momentum
0/20
-
11.1 Momentum and Impulse
15 minPreview
-
11.1.1 Momentum, impulse and change in momentum
15 minPreview
-
11.1.1 Momentum, impulse and change in momentum — Practice
6 questionsPreview
-
11.1.2 Elastic and inelastic collisions
15 minPreview
-
11.1.2 Elastic and inelastic collisions — Practice
7 questionsPreview
-
11.2 Work, Energy, Power and Machines
15 minPreview
-
11.2.1 Work, kinetic energy and potential energy
15 minPreview
-
11.2.1 Work, kinetic energy and potential energy — Practice
12 questionsPreview
-
11.2.2 Power, efficiency and machines
15 minPreview
-
11.2.2 Power, efficiency and machines — Practice
5 questionsPreview
-
11.3 Thermal Energy
15 minPreview
-
11.3.1 Heat, specific heat and phase changes
15 minPreview
-
11.3.1 Heat, specific heat and phase changes — Practice
3 questionsPreview
-
11.3.2 Thermal expansion and the laws of thermodynamics
15 minPreview
-
11.3.2 Thermal expansion and the laws of thermodynamics – Exam questions
12 questionsPreview
-
11.4 Fluids
15 minPreview
-
11.4.1 Pressure, density and Pascal’s law
15 minPreview
-
11.4.1 Pressure, density and Pascal’s law — Practice
2 questionsPreview
-
11.4.2 Buoyancy, Archimedes’ principle and fluid dynamics
15 minPreview
-
11.4.2 Buoyancy, Archimedes’ principle and fluid dynamics — Practice
1 questionsPreview
Physics · Unit 4: Waves, Sound and Light
0/19
-
12.1 Vibrations and Waves
15 minPreview
-
12.1.1 Simple harmonic motion, pendulums and springs
15 minPreview
-
12.1.1 Simple harmonic motion, pendulums and springs — Practice
1 questionsPreview
-
12.1.2 Wave properties, propagation and interference
15 minPreview
-
12.1.2 Wave properties, propagation and interference — Practice
1 questionsPreview
-
12.2 Sound
15 minPreview
-
12.2.1 Sound propagation, intensity and pitch
15 minPreview
-
12.2.1 Sound propagation, intensity and pitch — Practice
2 questionsPreview
-
12.2.2 Resonance, musical sources and the ear
15 minPreview
-
12.2.2 Resonance, musical sources and the ear — Practice
1 questionsPreview
-
12.3 Light, Reflection and Mirrors
15 minPreview
-
12.3.1 Nature of light, reflection and scattering
15 minPreview
-
12.3.1 Nature of light, reflection and scattering — Practice
1 questionsPreview
-
12.3.2 Spherical mirrors and image formation
15 minPreview
-
12.3.2 Spherical mirrors and image formation — Practice
2 questionsPreview
-
12.4 Refraction and Lenses
15 minPreview
-
12.4.1 Refraction, refractive index and dispersion
15 minPreview
-
12.4.1 Refraction, refractive index and dispersion — Practice
2 questionsPreview
-
12.4.2 Lenses and optical instruments
15 minPreview
Physics · Unit 5: Electricity and Magnetism
0/15
-
13.1 Static Electricity and the Electric Field
15 minPreview
-
13.1.1 Charge, Coulomb’s law and the electric field
15 minPreview
-
13.1.1 Charge, Coulomb’s law and the electric field — Practice
3 questionsPreview
-
13.1.2 Electric potential, capacitors and stored energy
15 minPreview
-
13.1.2 Electric potential, capacitors and stored energy — Practice
7 questionsPreview
-
13.2 Electric Current and Circuits
15 minPreview
-
13.2.1 Current, resistance and Ohm’s law
15 minPreview
-
13.2.1 Current, resistance and Ohm’s law — Practice
5 questionsPreview
-
13.2.2 Series and parallel circuits, power and safety
15 minPreview
-
13.2.2 Series and parallel circuits, power and safety — Practice
2 questionsPreview
-
13.3 Magnetism and Electromagnetic Induction
15 minPreview
-
13.3.1 The magnetic field and the force on conductors
15 minPreview
-
13.3.1 The magnetic field and the force on conductors — Practice
15 questionsPreview
-
13.3.2 Electromagnetic induction, generators and transformers
15 minPreview
-
13.3.2 Electromagnetic induction, generators and transformers — Practice
7 questionsPreview
Physics · Unit 6: Modern and Nuclear Physics
0/10
-
14.1 Quantum Theory and the Atom
15 minPreview
-
14.1.1 The quantum nature of light and the photoelectric effect
15 minPreview
-
14.1.1 The quantum nature of light and the photoelectric effect — Practice
3 questionsPreview
-
14.1.2 The Bohr model, energy levels and spectra
15 minPreview
-
14.1.2 The Bohr model, energy levels and spectra – Exam questions
12 questionsPreview
-
14.2 Nuclear Physics
15 minPreview
-
14.2.1 Nuclear structure, isotopes and radiation
15 minPreview
-
14.2.1 Nuclear structure, isotopes and radiation – Exam questions
8 questionsPreview
-
14.2.2 Nuclear decay, fission and fusion
15 minPreview
-
14.2.2 Nuclear decay, fission and fusion — Practice
3 questionsPreview
Physics · Mock exams and full tests
0/1
Chemistry · Unit 1: Introduction to Chemistry
0/10
-
16.1 Matter, Its Properties and Classification
15 minPreview
-
16.1.1 Classification of matter: elements, compounds and mixtures
15 minPreview
-
16.1.1 Classification of matter: elements, compounds and mixtures — Practice
2 questionsPreview
-
16.1.2 Physical and chemical properties and changes
15 minPreview
-
16.1.2 Physical and chemical properties and changes — Practice
1 questionsPreview
-
16.2 Chemical Reactions and Balancing Equations
15 minPreview
-
16.2.1 Types of chemical reactions
15 minPreview
-
16.2.1 Types of chemical reactions — Practice
4 questionsPreview
-
16.2.2 Balancing equations and the law of conservation of mass
15 minPreview
-
16.2.2 Balancing equations and the law of conservation of mass — Practice
1 questionsPreview
Chemistry · Unit 2: The Atom and the Periodic Table
0/10
-
17.1 Atomic Structure and Electron Configuration
15 minPreview
-
17.1.1 Atomic particles, isotopes and quantum numbers
15 minPreview
-
17.1.1 Atomic particles, isotopes and quantum numbers — Practice
8 questionsPreview
-
17.1.2 Electron configuration and atomic models
15 minPreview
-
17.1.2 Electron configuration and atomic models — Practice
7 questionsPreview
-
17.2 The Periodic Table and Periodic Trends
15 minPreview
-
17.2.1 Groups and periods of the periodic table
15 minPreview
-
17.2.1 Groups and periods of the periodic table — Practice
7 questionsPreview
-
17.2.2 Periodic properties: atomic radius, ionization and electronegativity
15 minPreview
-
17.2.2 Periodic properties: atomic radius, ionization and electronegativity — Practice
3 questionsPreview
Chemistry · Unit 3: Chemical Bonds
0/16
-
18.1 Ionic and Metallic Bonds
15 minPreview
-
18.1.1 The ionic bond and ion formation
15 minPreview
-
18.1.1 The ionic bond and ion formation — Practice
3 questionsPreview
-
18.1.2 Metallic bonds and the properties that result
15 minPreview
-
18.1.2 Metallic bonds and the properties that result — Practice
2 questionsPreview
-
18.2 Covalent Bonds and Molecular Shapes
15 minPreview
-
18.2.1 The covalent bond and Lewis structures
15 minPreview
-
18.2.1 The covalent bond and Lewis structures — Practice
2 questionsPreview
-
18.2.2 Molecular shape and hybridization
15 minPreview
-
18.2.2 Molecular shape and hybridization — Practice
2 questionsPreview
-
18.3 Intermolecular Forces and States of Matter
15 minPreview
-
18.3.1 Intermolecular attractions and hydrogen bonds
15 minPreview
-
18.3.1 Intermolecular attractions and hydrogen bonds — Practice
1 questionsPreview
-
18.3.2 States of matter and phase changes
15 minPreview
-
18.3.2 States of matter and phase changes — Practice
3 questionsPreview
-
18.3.2 States of matter and phase changes - Figure question bank (30 items)
30 questionsPreview
Chemistry · Unit 4: Chemical Calculations and Gases
0/10
-
19.1 The Mole and Chemical Calculations
15 minPreview
-
19.1.1 The mole, molar mass and formulas
15 minPreview
-
19.1.1 The mole, molar mass and formulas — Practice
3 questionsPreview
-
19.1.2 Stoichiometric calculations and solutions
15 minPreview
-
19.1.2 Stoichiometric calculations and solutions — Practice
2 questionsPreview
-
19.2 Gases and Their Laws
15 minPreview
-
19.2.1 The simple gas laws
15 minPreview
-
19.2.1 The simple gas laws — Practice
2 questionsPreview
-
19.2.2 The ideal gas and the kinetic theory
15 minPreview
-
19.2.2 The ideal gas and the kinetic theory — Practice
2 questionsPreview
Chemistry · Unit 5: Energy, Reaction Rate and Equilibrium
0/15
-
20.1 Energy and Chemical Changes
15 minPreview
-
20.1.1 Thermal energy and enthalpy
15 minPreview
-
20.1.1 Thermal energy and enthalpy — Practice
2 questionsPreview
-
20.1.2 Thermochemical equations and Hess’s law
15 minPreview
-
20.1.2 Thermochemical equations and Hess’s law — Practice
6 questionsPreview
-
20.2 Chemical Reaction Rate
15 minPreview
-
20.2.1 Factors affecting reaction rate
15 minPreview
-
20.2.1 Factors affecting reaction rate — Practice
7 questionsPreview
-
20.2.2 Activation energy and catalysts
15 minPreview
-
20.2.2 Activation energy and catalysts — Practice
6 questionsPreview
-
20.3 Chemical Equilibrium
15 minPreview
-
20.3.1 The equilibrium constant and its calculations
15 minPreview
-
20.3.1 The equilibrium constant and its calculations — Practice
7 questionsPreview
-
20.3.2 Le Chatelier’s principle and ionic equilibrium
15 minPreview
-
20.3.2 Le Chatelier’s principle and ionic equilibrium — Practice
6 questionsPreview
Chemistry · Unit 6: Mixtures, Acids and Bases
0/10
-
21.1 Mixtures and Solutions
15 minPreview
-
21.1.1 Solubility and methods of separating mixtures
15 minPreview
-
21.1.1 Solubility and methods of separating mixtures – Exam questions
12 questionsPreview
-
21.1.2 Concentrations and colligative properties of solutions
15 minPreview
-
21.1.2 Concentrations and colligative properties of solutions — Practice
4 questionsPreview
-
21.2 Acids, Bases and pH
15 minPreview
-
21.2.1 Acid-base theories and pH
15 minPreview
-
21.2.1 Acid-base theories and pH — Practice
4 questionsPreview
-
21.2.2 Neutralization, titration, salts and buffer solutions
15 minPreview
-
21.2.2 Neutralization, titration, salts and buffer solutions — Practice
1 questionsPreview
Chemistry · Unit 7: Electrochemistry
0/10
-
22.1 Oxidation and Reduction
15 minPreview
-
22.1.1 Oxidation numbers and balancing half-reactions
15 minPreview
-
22.1.1 Oxidation numbers and balancing half-reactions — Practice
4 questionsPreview
-
22.1.2 Oxidizing and reducing agents and the activity series
15 minPreview
-
22.1.2 Oxidizing and reducing agents and the activity series — Practice
1 questionsPreview
-
22.2 Electrochemical Cells and Electrolysis
15 minPreview
-
22.2.1 Galvanic cells and cell potential
15 minPreview
-
22.2.1 Galvanic cells and cell potential — Practice
2 questionsPreview
-
22.2.2 Electrolysis, corrosion and protection
15 minPreview
-
22.2.2 Electrolysis, corrosion and protection — Practice
2 questionsPreview
Chemistry · Unit 8: Organic Chemistry
0/15
-
23.1 Hydrocarbons and Their Nomenclature
15 minPreview
-
23.1.1 Alkanes and alkenes and nomenclature
15 minPreview
-
23.1.1 Alkanes and alkenes and nomenclature — Practice
2 questionsPreview
-
23.1.2 Alkynes and aromatic compounds and their reactions
15 minPreview
-
23.1.2 Alkynes and aromatic compounds and their reactions — Practice
1 questionsPreview
-
23.2 Hydrocarbon Derivatives and Polymers
15 minPreview
-
23.2.1 Functional groups, alcohols and aldehydes
15 minPreview
-
23.2.1 Functional groups, alcohols and aldehydes — Practice
2 questionsPreview
-
23.2.2 Carboxylic acids, esters and polymers
15 minPreview
-
23.2.2 Carboxylic acids, esters and polymers — Practice
3 questionsPreview
-
23.3 Biological Organic Compounds
15 minPreview
-
23.3.1 Carbohydrates, lipids and proteins
15 minPreview
-
23.3.1 Carbohydrates, lipids and proteins — Practice
5 questionsPreview
-
23.3.2 Vitamins, nucleic acids and fermentation
15 minPreview
-
23.3.2 Vitamins, nucleic acids and fermentation — Practice
5 questionsPreview
Chemistry · Unit 9: Chemistry question bank with original diagrams
0/1
Chemistry · Mock exams and full tests
0/1
Biology · Unit 1: Introduction to Biology and Classification
0/20
-
26.1 Biology and Scientific Methods
15 minPreview
-
26.1.1 Characteristics of living things and levels of organization
15 minPreview
-
26.1.1 Characteristics of living things and levels of organization — Practice
12 questionsPreview
-
26.1.2 Scientific methods, experiments and variables
15 minPreview
-
26.1.2 Scientific methods, experiments and variables — Practice
17 questionsPreview
-
26.2 Classification and Binomial Nomenclature
15 minPreview
-
26.2.1 Basis of classification and the kingdoms of living things
15 minPreview
-
26.2.1 Basis of classification and the kingdoms of living things — Practice
3 questionsPreview
-
26.2.2 Taxonomic keys and binomial nomenclature
15 minPreview
-
26.2.2 Taxonomic keys and binomial nomenclature — Practice
1 questionsPreview
-
26.3 Viruses and Bacteria
15 minPreview
-
26.3.1 Virus structure and reproduction
15 minPreview
-
26.3.1 Virus structure and reproduction — Practice
2 questionsPreview
-
26.3.2 Bacteria: shapes, reproduction and roles
15 minPreview
-
26.3.2 Bacteria: shapes, reproduction and roles — Practice
2 questionsPreview
-
26.4 Protists and Fungi
15 minPreview
-
26.4.1 Protists: plant-like, animal-like and fungus-like
15 minPreview
-
26.4.1 Protists: plant-like, animal-like and fungus-like — Practice
3 questionsPreview
-
26.4.2 Fungi: structure, reproduction and importance
15 minPreview
-
26.4.2 Fungi: structure, reproduction and importance — Practice
1 questionsPreview
Biology · Unit 2: The Animal Kingdom
0/10
-
27.1 Invertebrates
15 minPreview
-
27.1.1 Simple invertebrates: sponges, cnidarians and worms
15 minPreview
-
27.1.1 Simple invertebrates: sponges, cnidarians and worms — Practice
2 questionsPreview
-
27.1.2 Mollusks, arthropods and echinoderms
15 minPreview
-
27.1.2 Mollusks, arthropods and echinoderms — Practice
2 questionsPreview
-
27.2 Vertebrates
15 minPreview
-
27.2.1 Fish, amphibians and reptiles
15 minPreview
-
27.2.1 Fish, amphibians and reptiles — Practice
3 questionsPreview
-
27.2.2 Birds and mammals and their characteristics
15 minPreview
-
27.2.2 Birds and mammals and their characteristics — Practice
1 questionsPreview
Biology · Unit 3: The Plant Kingdom
0/10
-
28.1 Divisions of the Plant Kingdom and Plant Tissues
15 minPreview
-
28.1.1 Nonvascular and vascular plants
15 minPreview
-
28.1.1 Nonvascular and vascular plants — Practice
6 questionsPreview
-
28.1.2 Plant tissues and the functions of roots, stems and leaves
15 minPreview
-
28.1.2 Plant tissues and the functions of roots, stems and leaves — Practice
7 questionsPreview
-
28.2 Plant Hormones, Flowers and Reproduction
15 minPreview
-
28.2.1 Plant hormones and responses
15 minPreview
-
28.2.1 Plant hormones and responses — Practice
6 questionsPreview
-
28.2.2 Flower structure, pollination and fertilization
15 minPreview
-
28.2.2 Flower structure, pollination and fertilization — Practice
5 questionsPreview
Biology · Unit 4: The Cell
0/15
-
29.1 Cell Structures and Cellular Transport
15 minPreview
-
29.1.1 Organelles and the structures of animal and plant cells
15 minPreview
-
29.1.1 Organelles and the structures of animal and plant cells — Practice
3 questionsPreview
-
29.1.2 Passive transport, active transport and osmosis
15 minPreview
-
29.1.2 Passive transport, active transport and osmosis — Practice
2 questionsPreview
-
29.2 Cellular Energy: Photosynthesis and Respiration
15 minPreview
-
29.2.1 Photosynthesis, light reactions and the Calvin cycle
15 minPreview
-
29.2.1 Photosynthesis, light reactions and the Calvin cycle — Practice
2 questionsPreview
-
29.2.2 Anaerobic and aerobic cellular respiration
15 minPreview
-
29.2.2 Anaerobic and aerobic cellular respiration — Practice
2 questionsPreview
-
29.3 The Cell Cycle and Meiosis
15 minPreview
-
29.3.1 The cell cycle and mitosis
15 minPreview
-
29.3.1 The cell cycle and mitosis — Practice
2 questionsPreview
-
29.3.2 Meiosis and genetic variation
15 minPreview
-
29.3.2 Meiosis and genetic variation — Practice
2 questionsPreview
Biology · Unit 5: Genetics
0/15
-
30.1 Mendelian Genetics
15 minPreview
-
30.1.1 Mendelian inheritance and monohybrid and dihybrid crosses
15 minPreview
-
30.1.1 Mendelian inheritance and monohybrid and dihybrid crosses — Practice
3 questionsPreview
-
30.1.2 Genetic probability and Punnett squares
15 minPreview
-
30.1.2 Genetic probability and Punnett squares — Practice
1 questionsPreview
-
30.2 Patterns of Inheritance in Humans
15 minPreview
-
30.2.1 Non-Mendelian inheritance: codominance and sex-linked traits
15 minPreview
-
30.2.1 Non-Mendelian inheritance: codominance and sex-linked traits — Practice
2 questionsPreview
-
30.2.2 Genetic disorders and chromosomes
15 minPreview
-
30.2.2 Genetic disorders and chromosomes — Practice
4 questionsPreview
-
30.3 Nucleic Acids and Chromosomes
15 minPreview
-
30.3.1 DNA structure and replication
15 minPreview
-
30.3.1 DNA structure and replication — Practice
3 questionsPreview
-
30.3.2 Translation, mutations and gene expression
15 minPreview
-
30.3.2 Translation, mutations and gene expression — Practice
2 questionsPreview
Biology · Unit 6: Human Body Systems
0/20
-
31.1 Skeletal, Muscular and Nervous Systems
15 minPreview
-
31.1.1 The skeletal and muscular systems
15 minPreview
-
31.1.1 The skeletal and muscular systems — Practice
8 questionsPreview
-
31.1.2 The nervous system and the human senses
15 minPreview
-
31.1.2 The nervous system and the human senses — Practice
5 questionsPreview
-
31.2 Circulatory, Respiratory and Excretory Systems
15 minPreview
-
31.2.1 The circulatory, lymphatic and respiratory systems
15 minPreview
-
31.2.1 The circulatory, lymphatic and respiratory systems — Practice
8 questionsPreview
-
31.2.2 The excretory system, skin and liver
15 minPreview
-
31.2.2 The excretory system, skin and liver — Practice
1 questionsPreview
-
31.3 Digestive System, Nutrition and Endocrine Glands
15 minPreview
-
31.3.1 Digestion, enzymes and glands
15 minPreview
-
31.3.1 Digestion, enzymes and glands — Practice
5 questionsPreview
-
31.3.2 Nutrition, health and the immune system
15 minPreview
-
31.3.2 Nutrition, health and the immune system – Exam questions
12 questionsPreview
-
31.4 Reproductive and Immune Systems
15 minPreview
-
31.4.1 Male and female reproductive systems and hormones
15 minPreview
-
31.4.1 Male and female reproductive systems and hormones — Practice
3 questionsPreview
-
31.4.2 Immunity, diseases and body systems
15 minPreview
-
31.4.2 Immunity, diseases and body systems — Practice
1 questionsPreview
Biology · Unit 7: Ecology and Animal Behavior
0/15
-
32.1 Living Organisms and Cycles in the Biosphere
15 minPreview
-
32.1.1 Interactions in ecosystems and food chains
15 minPreview
-
32.1.1 Interactions in ecosystems and food chains — Practice
4 questionsPreview
-
32.1.2 The carbon, nitrogen and water cycles
15 minPreview
-
32.1.2 The carbon, nitrogen and water cycles — Practice
1 questionsPreview
-
32.2 Ecological Succession, Biomes and Aquatic Systems
15 minPreview
-
32.2.1 Tolerance and ecological succession
15 minPreview
-
32.2.1 Tolerance and ecological succession — Practice
3 questionsPreview
-
32.2.2 Terrestrial and aquatic biomes
15 minPreview
-
32.2.2 Terrestrial and aquatic biomes — Practice
1 questionsPreview
-
32.3 Populations, Biodiversity and Animal Behavior
15 minPreview
-
32.3.1 Population growth and biodiversity
15 minPreview
-
32.3.1 Population growth and biodiversity — Practice
3 questionsPreview
-
32.3.2 Animal behavior and groups
15 minPreview
-
32.3.2 Animal behavior and groups — Practice
1 questionsPreview
Biology · Mock exams and full tests
0/2
Text lesson
9.2.2 Motion graphs
Read and interpret position–time, velocity–time and acceleration–time graphs using slope and area.
1Key ideas2Key ideas3Key ideas
Key ideas
Key ideas
1
On a position–time graph the slope is the velocity. A straight line means constant velocity
a horizontal line means the object is at rest.
2
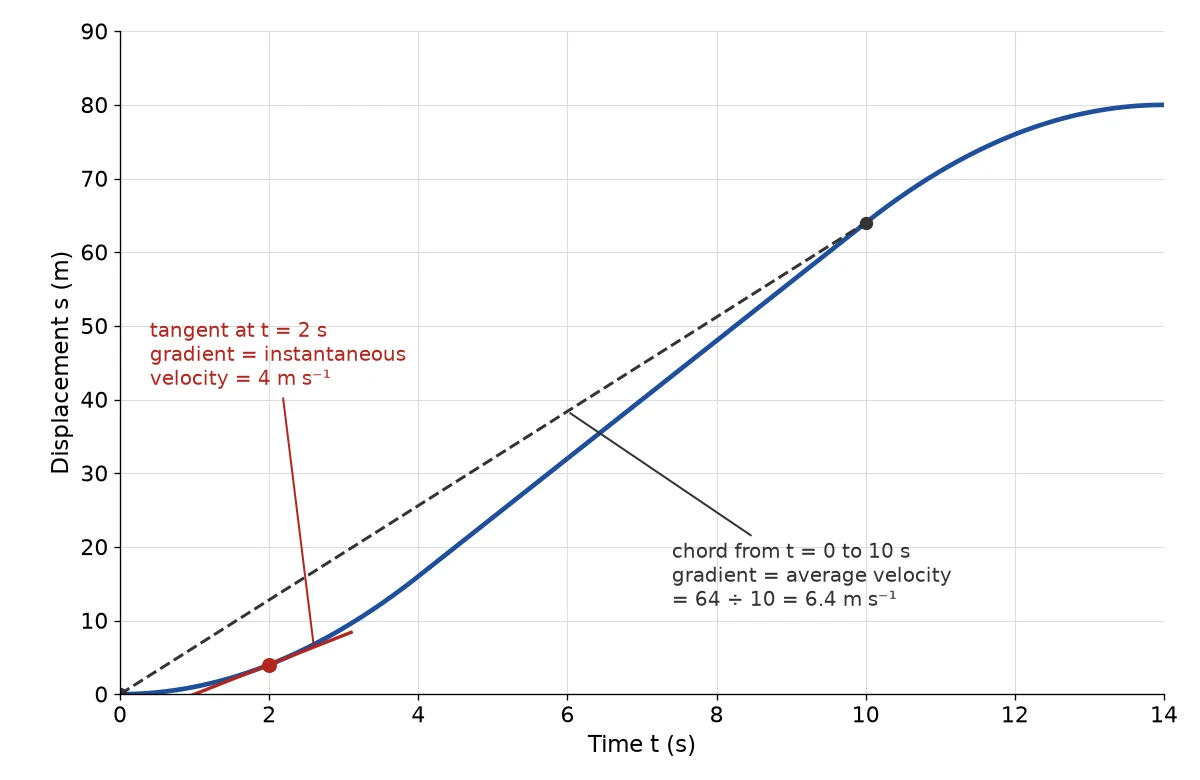
A curved position–time graph means the velocity is changing
the slope of the tangent gives the instantaneous velocity.
3
On a velocity–time graph the slope is the acceleration.
1 / 3Next ▶
Key ideas
1
4
2
The area between a velocity–time graph and the time axis is the displacement. Area below the axis is displacement in the negative direction.
3
5
4
A horizontal velocity–time line means constant velocity (zero acceleration)
a line through zero velocity means the object reverses direction.
5
6
6
The area under an acceleration–time graph is the change in velocity.
◀ Previous2 / 3Next ▶
Displacement-time curve with a tangent at t = 2 s and a dashed chord from t = 0 s to t = 10 s
Key ideas
 ⤢ Enlarge
Key ideas
7
Two objects are at the same position where their position–time lines cross.
◀ Previous3 / 3
1Worked examples2Worked examples3Worked examples
Worked examples
Worked examples
A position–time line rises from 0 m to 60 m in 12 s. Find the velocity.
— Slope =
60
⁄
12
= 5 m/s.
1 / 3Next ▶
Worked examples
1
A velocity–time line rises uniformly from 0 to 20 m/s in 4 s. Find the acceleration and displacement.
2
— a =
3
20
4
4
5
= 5 m/s2
displacement = ½ × 4 × 20 = 40 m.
6
What does a horizontal line at v = −3 m/s mean?
◀ Previous2 / 3Next ▶
Worked examples
Worked examples
— Constant velocity of 3 m/s in the negative direction.
◀ Previous3 / 3
Slope
Slope — the ratio of the vertical change to the horizontal change on a graph
Position–time graph
Position–time graph — a graph of position against time
Velocity–time graph
Velocity–time graph — a graph of velocity against time
Tangent
Tangent — a line touching a curve at one point, giving the instantaneous slope
Area under a graph
Area under a graph — the region between the line and the time axis
| Graph | Slope gives | Area gives |
|---|---|---|
| Position–time | velocity | — |
| Velocity–time | acceleration | displacement |
| Acceleration–time | — | change in velocity |
1
Read the axis title first: the same shape means different things on different graphs.
2
A steeper position–time line means a faster object.
3
Split a velocity–time area into rectangles and triangles.
4
Slowing down appears as a velocity–time line approaching the time axis.