Curriculum
SAAT (Tahsili)
Mathematics · Unit 1: Logic and Geometry
0/25
-
1.1 Mathematical Logic and Proof
 15 minPreview
-
1.1.1 Conditionals, converse, inverse and contrapositive
15 minPreview
-
1.1.1 Conditionals, converse, inverse and contrapositive — Practice
 2 questionsPreview
-
1.1.2 Direct proof and proof by contradiction
15 minPreview
-
1.1.2 Direct proof and proof by contradiction — Practice
2 questionsPreview
-
1.2 Parallelism and Perpendicularity
15 minPreview
-
1.2.1 Angles formed by two parallel lines and a transversal
15 minPreview
-
1.2.1 Angles formed by two parallel lines and a transversal — Practice
1 questionsPreview
-
1.2.2 Slope, equation of a line and perpendicularity
15 minPreview
-
1.2.2 Slope, equation of a line and perpendicularity — Practice
3 questionsPreview
-
1.3 Triangles and Congruence
15 minPreview
-
1.3.1 Triangle angles, properties and triangle inequalities
15 minPreview
-
1.3.1 Triangle angles, properties and triangle inequalities — Practice
4 questionsPreview
-
1.3.2 Triangle congruence cases and justification
15 minPreview
-
1.3.2 Triangle congruence cases and justification — Practice
1 questionsPreview
-
1.4 Quadrilaterals, Similarity and Geometric Transformations
15 minPreview
-
1.4.1 Properties of quadrilaterals and parallelograms
15 minPreview
-
1.4.1 Properties of quadrilaterals and parallelograms — Practice
1 questionsPreview
-
1.4.2 Similarity, side ratios, transformations and coordinates
15 minPreview
-
1.4.2 Similarity, side ratios, transformations and coordinates — Practice
3 questionsPreview
-
1.5 Circles
15 minPreview
-
1.5.1 Chords, tangents and central angles
15 minPreview
-
1.5.1 Chords, tangents and central angles — Practice
3 questionsPreview
-
1.5.2 Power of a point, arcs and sector area
15 minPreview
-
1.5.2 Power of a point, arcs and sector area — Practice
12 questionsPreview
Mathematics · Unit 2: Functions and Matrices
0/19
-
2.1 Real Numbers, Relations and Functions
15 minPreview
-
2.1.1 Real numbers, absolute values and inequalities
15 minPreview
-
2.1.2 Relations, functions, domain and range
15 minPreview
-
2.1.2 Relations, functions, domain and range — Practice
3 questionsPreview
-
2.2 Matrices
15 minPreview
-
2.2.1 Matrix addition, multiplication and determinants
15 minPreview
-
2.2.1 Matrix addition, multiplication and determinants — Practice
2 questionsPreview
-
2.2.2 The inverse matrix and solving linear systems
15 minPreview
-
2.2.2 The inverse matrix and solving linear systems — Practice
1 questionsPreview
-
2.3 Polynomials and Complex Numbers
15 minPreview
-
2.3.1 Polynomial division and the remainder theorem
15 minPreview
-
2.3.1 Polynomial division and the remainder theorem — Practice
2 questionsPreview
-
2.3.2 Complex numbers and roots of equations
15 minPreview
-
2.3.2 Complex numbers and roots of equations — Practice
3 questionsPreview
-
2.4 Inverse, Radical and Rational Functions
15 minPreview
-
2.4.1 The inverse function and radical functions
15 minPreview
-
2.4.1 The inverse function and radical functions — Practice
3 questionsPreview
-
2.4.2 Rational functions and graphing
15 minPreview
-
2.4.2 Rational functions and graphing — Practice
1 questionsPreview
Mathematics · Unit 3: Sequences, Probability and Statistics
0/15
-
3.1 Sequences and Series
15 minPreview
-
3.1.1 Arithmetic sequences and their terms
15 minPreview
-
3.1.1 Arithmetic sequences and their terms — Practice
3 questionsPreview
-
3.1.2 Geometric sequences and infinite series
15 minPreview
-
3.1.2 Geometric sequences and infinite series — Practice
1 questionsPreview
-
3.2 Probability
15 minPreview
-
3.2.1 Counting principles, permutations and combinations
15 minPreview
-
3.2.1 Counting principles, permutations and combinations — Practice
3 questionsPreview
-
3.2.2 Probability, conditional probability and independent events
15 minPreview
-
3.2.2 Probability, conditional probability and independent events — Practice
3 questionsPreview
-
3.3 Statistics
15 minPreview
-
3.3.1 Measures of central tendency and measures of position
15 minPreview
-
3.3.1 Measures of central tendency and measures of position — Practice
2 questionsPreview
-
3.3.2 Dispersion and graphical representation of data
15 minPreview
-
3.3.2 Dispersion and graphical representation of data — Practice
2 questionsPreview
Mathematics · Unit 4: Trigonometry
0/10
-
4.1 Trigonometric Functions and Angle Measure
15 minPreview
-
4.1.1 Measuring angles in degrees, minutes, seconds and on the circle
15 minPreview
-
4.1.1 Measuring angles in degrees, minutes, seconds and on the circle — Practice
2 questionsPreview
-
4.1.2 Trigonometric functions on the unit circle
15 minPreview
-
4.1.2 Trigonometric functions on the unit circle — Practice
12 questionsPreview
-
4.2 Trigonometric Identities and Equations
15 minPreview
-
4.2.1 Trigonometric identities, sum and difference
15 minPreview
-
4.2.1 Trigonometric identities, sum and difference — Practice
19 questionsPreview
-
4.2.2 The laws of sines and cosines and solving triangles
15 minPreview
-
4.2.2 The laws of sines and cosines and solving triangles — Practice
11 questionsPreview
Mathematics · Unit 5: Advanced Functions and Analytic Geometry
0/20
-
5.1 Analyzing Functions and Transformations
15 minPreview
-
5.1.1 Polynomial functions, their zeros and behavior
15 minPreview
-
5.1.1 Polynomial functions, their zeros and behavior — Practice
1 questionsPreview
-
5.1.2 Graph transformations and composition
15 minPreview
-
5.1.2 Graph transformations and composition — Practice
5 questionsPreview
-
5.2 Exponential and Logarithmic Functions
15 minPreview
-
5.2.1 The exponential function, growth and decay
15 minPreview
-
5.2.1 The exponential function, growth and decay — Practice
2 questionsPreview
-
5.2.2 Logarithms, their properties and equations
15 minPreview
-
5.2.2 Logarithms, their properties and equations — Practice
3 questionsPreview
-
5.3 Conic Sections
15 minPreview
-
5.3.1 The circle and the parabola
15 minPreview
-
5.3.1 The circle and the parabola — Practice
2 questionsPreview
-
5.3.2 The hyperbola and the ellipse
15 minPreview
-
5.3.2 The hyperbola and the ellipse — Practice
3 questionsPreview
-
5.4 Vectors and Polar Coordinates
15 minPreview
-
5.4.1 Vectors and operations on them
15 minPreview
-
5.4.1 Vectors and operations on them — Practice
2 questionsPreview
-
5.4.2 Polar coordinates and converting them
15 minPreview
-
5.4.2 Polar coordinates and converting them — Practice
2 questionsPreview
Mathematics · Unit 6: Calculus
0/10
-
6.1 Limits
15 minPreview
-
6.1.1 Evaluating limits algebraically and graphically
15 minPreview
-
6.1.1 Evaluating limits algebraically and graphically — Practice
1 questionsPreview
-
6.1.2 Infinite limits and continuity
15 minPreview
-
6.1.2 Infinite limits and continuity — Practice
2 questionsPreview
-
6.2 Differentiation and Integration
15 minPreview
-
6.2.1 Differentiation rules and derivatives of composite functions
15 minPreview
-
6.2.1 Differentiation rules and derivatives of composite functions — Practice
2 questionsPreview
-
6.2.2 The definite integral and the fundamental theorem of calculus
15 minPreview
-
6.2.2 The definite integral and the fundamental theorem of calculus — Practice
1 questionsPreview
Mathematics · Unit 7: Mathematics question bank with original diagrams
0/1
Mathematics · Mock exams and full tests
0/1
Physics · Unit 1: Physics and Motion
0/20
-
9.1 Introduction to Physics and Measurement
15 minPreview
-
9.1.1 Physical quantities, units and dimensional analysis
15 minPreview
-
9.1.1 Physical quantities, units and dimensional analysis — Practice
3 questionsPreview
-
9.1.2 Precision, measurement and graphing
15 minPreview
-
9.1.2 Precision, measurement and graphing — Practice
2 questionsPreview
-
9.2 Describing Motion and Graphing It
15 minPreview
-
9.2.1 Speed, displacement and distance
15 minPreview
-
9.2.1 Speed, displacement and distance — Practice
2 questionsPreview
-
9.2.2 Motion graphs
15 minPreview
-
9.2.2 Motion graphs — Practice
2 questionsPreview
-
9.3 Acceleration and Free Fall
15 minPreview
-
9.3.1 Acceleration and equations of motion
15 minPreview
-
9.3.1 Acceleration and equations of motion — Practice
1 questionsPreview
-
9.3.2 Free fall and vertical projectiles
15 minPreview
-
9.3.2 Free fall and vertical projectiles — Practice
3 questionsPreview
-
9.4 Vectors and Motion in Two Dimensions
15 minPreview
-
9.4.1 Vectors, addition and resolving components
15 minPreview
-
9.4.1 Vectors, addition and resolving components — Practice
2 questionsPreview
-
9.4.2 Projectile motion and uniform circular motion
15 minPreview
-
9.4.2 Projectile motion and uniform circular motion — Practice
3 questionsPreview
Physics · Unit 2: Forces and Gravity
0/15
-
10.1 Forces and Newton’s Laws
15 minPreview
-
10.1.1 Newton’s three laws and their applications
15 minPreview
-
10.1.1 Newton’s three laws and their applications — Practice
2 questionsPreview
-
10.1.2 Friction, free-body diagrams and tension forces
15 minPreview
-
10.1.2 Friction, free-body diagrams and tension forces — Practice
2 questionsPreview
-
10.2 Gravity and Kepler’s Laws
15 minPreview
-
10.2.1 The law of universal gravitation and weight
15 minPreview
-
10.2.1 The law of universal gravitation and weight — Practice
1 questionsPreview
-
10.2.2 Kepler’s laws, orbits and satellites
15 minPreview
-
10.2.2 Kepler’s laws, orbits and satellites — Practice
4 questionsPreview
-
10.3 Torque, Equilibrium and Center of Mass
15 minPreview
-
10.3.1 Torque and conditions of equilibrium
15 minPreview
-
10.3.1 Torque and conditions of equilibrium — Practice
3 questionsPreview
-
10.3.2 Center of mass, stability and simple machines
15 minPreview
-
10.3.2 Center of mass, stability and simple machines — Practice
1 questionsPreview
Physics · Unit 3: Energy and Momentum
0/20
-
11.1 Momentum and Impulse
15 minPreview
-
11.1.1 Momentum, impulse and change in momentum
15 minPreview
-
11.1.1 Momentum, impulse and change in momentum — Practice
6 questionsPreview
-
11.1.2 Elastic and inelastic collisions
15 minPreview
-
11.1.2 Elastic and inelastic collisions — Practice
7 questionsPreview
-
11.2 Work, Energy, Power and Machines
15 minPreview
-
11.2.1 Work, kinetic energy and potential energy
15 minPreview
-
11.2.1 Work, kinetic energy and potential energy — Practice
12 questionsPreview
-
11.2.2 Power, efficiency and machines
15 minPreview
-
11.2.2 Power, efficiency and machines — Practice
5 questionsPreview
-
11.3 Thermal Energy
15 minPreview
-
11.3.1 Heat, specific heat and phase changes
15 minPreview
-
11.3.1 Heat, specific heat and phase changes — Practice
3 questionsPreview
-
11.3.2 Thermal expansion and the laws of thermodynamics
15 minPreview
-
11.3.2 Thermal expansion and the laws of thermodynamics – Exam questions
12 questionsPreview
-
11.4 Fluids
15 minPreview
-
11.4.1 Pressure, density and Pascal’s law
15 minPreview
-
11.4.1 Pressure, density and Pascal’s law — Practice
2 questionsPreview
-
11.4.2 Buoyancy, Archimedes’ principle and fluid dynamics
15 minPreview
-
11.4.2 Buoyancy, Archimedes’ principle and fluid dynamics — Practice
1 questionsPreview
Physics · Unit 4: Waves, Sound and Light
0/19
-
12.1 Vibrations and Waves
15 minPreview
-
12.1.1 Simple harmonic motion, pendulums and springs
15 minPreview
-
12.1.1 Simple harmonic motion, pendulums and springs — Practice
1 questionsPreview
-
12.1.2 Wave properties, propagation and interference
15 minPreview
-
12.1.2 Wave properties, propagation and interference — Practice
1 questionsPreview
-
12.2 Sound
15 minPreview
-
12.2.1 Sound propagation, intensity and pitch
15 minPreview
-
12.2.1 Sound propagation, intensity and pitch — Practice
2 questionsPreview
-
12.2.2 Resonance, musical sources and the ear
15 minPreview
-
12.2.2 Resonance, musical sources and the ear — Practice
1 questionsPreview
-
12.3 Light, Reflection and Mirrors
15 minPreview
-
12.3.1 Nature of light, reflection and scattering
15 minPreview
-
12.3.1 Nature of light, reflection and scattering — Practice
1 questionsPreview
-
12.3.2 Spherical mirrors and image formation
15 minPreview
-
12.3.2 Spherical mirrors and image formation — Practice
2 questionsPreview
-
12.4 Refraction and Lenses
15 minPreview
-
12.4.1 Refraction, refractive index and dispersion
15 minPreview
-
12.4.1 Refraction, refractive index and dispersion — Practice
2 questionsPreview
-
12.4.2 Lenses and optical instruments
15 minPreview
Physics · Unit 5: Electricity and Magnetism
0/15
-
13.1 Static Electricity and the Electric Field
15 minPreview
-
13.1.1 Charge, Coulomb’s law and the electric field
15 minPreview
-
13.1.1 Charge, Coulomb’s law and the electric field — Practice
3 questionsPreview
-
13.1.2 Electric potential, capacitors and stored energy
15 minPreview
-
13.1.2 Electric potential, capacitors and stored energy — Practice
7 questionsPreview
-
13.2 Electric Current and Circuits
15 minPreview
-
13.2.1 Current, resistance and Ohm’s law
15 minPreview
-
13.2.1 Current, resistance and Ohm’s law — Practice
5 questionsPreview
-
13.2.2 Series and parallel circuits, power and safety
15 minPreview
-
13.2.2 Series and parallel circuits, power and safety — Practice
2 questionsPreview
-
13.3 Magnetism and Electromagnetic Induction
15 minPreview
-
13.3.1 The magnetic field and the force on conductors
15 minPreview
-
13.3.1 The magnetic field and the force on conductors — Practice
15 questionsPreview
-
13.3.2 Electromagnetic induction, generators and transformers
15 minPreview
-
13.3.2 Electromagnetic induction, generators and transformers — Practice
7 questionsPreview
Physics · Unit 6: Modern and Nuclear Physics
0/10
-
14.1 Quantum Theory and the Atom
15 minPreview
-
14.1.1 The quantum nature of light and the photoelectric effect
15 minPreview
-
14.1.1 The quantum nature of light and the photoelectric effect — Practice
3 questionsPreview
-
14.1.2 The Bohr model, energy levels and spectra
15 minPreview
-
14.1.2 The Bohr model, energy levels and spectra – Exam questions
12 questionsPreview
-
14.2 Nuclear Physics
15 minPreview
-
14.2.1 Nuclear structure, isotopes and radiation
15 minPreview
-
14.2.1 Nuclear structure, isotopes and radiation – Exam questions
8 questionsPreview
-
14.2.2 Nuclear decay, fission and fusion
15 minPreview
-
14.2.2 Nuclear decay, fission and fusion — Practice
3 questionsPreview
Physics · Mock exams and full tests
0/1
Chemistry · Unit 1: Introduction to Chemistry
0/10
-
16.1 Matter, Its Properties and Classification
15 minPreview
-
16.1.1 Classification of matter: elements, compounds and mixtures
15 minPreview
-
16.1.1 Classification of matter: elements, compounds and mixtures — Practice
2 questionsPreview
-
16.1.2 Physical and chemical properties and changes
15 minPreview
-
16.1.2 Physical and chemical properties and changes — Practice
1 questionsPreview
-
16.2 Chemical Reactions and Balancing Equations
15 minPreview
-
16.2.1 Types of chemical reactions
15 minPreview
-
16.2.1 Types of chemical reactions — Practice
4 questionsPreview
-
16.2.2 Balancing equations and the law of conservation of mass
15 minPreview
-
16.2.2 Balancing equations and the law of conservation of mass — Practice
1 questionsPreview
Chemistry · Unit 2: The Atom and the Periodic Table
0/10
-
17.1 Atomic Structure and Electron Configuration
15 minPreview
-
17.1.1 Atomic particles, isotopes and quantum numbers
15 minPreview
-
17.1.1 Atomic particles, isotopes and quantum numbers — Practice
8 questionsPreview
-
17.1.2 Electron configuration and atomic models
15 minPreview
-
17.1.2 Electron configuration and atomic models — Practice
7 questionsPreview
-
17.2 The Periodic Table and Periodic Trends
15 minPreview
-
17.2.1 Groups and periods of the periodic table
15 minPreview
-
17.2.1 Groups and periods of the periodic table — Practice
7 questionsPreview
-
17.2.2 Periodic properties: atomic radius, ionization and electronegativity
15 minPreview
-
17.2.2 Periodic properties: atomic radius, ionization and electronegativity — Practice
3 questionsPreview
Chemistry · Unit 3: Chemical Bonds
0/16
-
18.1 Ionic and Metallic Bonds
15 minPreview
-
18.1.1 The ionic bond and ion formation
15 minPreview
-
18.1.1 The ionic bond and ion formation — Practice
3 questionsPreview
-
18.1.2 Metallic bonds and the properties that result
15 minPreview
-
18.1.2 Metallic bonds and the properties that result — Practice
2 questionsPreview
-
18.2 Covalent Bonds and Molecular Shapes
15 minPreview
-
18.2.1 The covalent bond and Lewis structures
15 minPreview
-
18.2.1 The covalent bond and Lewis structures — Practice
2 questionsPreview
-
18.2.2 Molecular shape and hybridization
15 minPreview
-
18.2.2 Molecular shape and hybridization — Practice
2 questionsPreview
-
18.3 Intermolecular Forces and States of Matter
15 minPreview
-
18.3.1 Intermolecular attractions and hydrogen bonds
15 minPreview
-
18.3.1 Intermolecular attractions and hydrogen bonds — Practice
1 questionsPreview
-
18.3.2 States of matter and phase changes
15 minPreview
-
18.3.2 States of matter and phase changes — Practice
3 questionsPreview
-
18.3.2 States of matter and phase changes - Figure question bank (30 items)
30 questionsPreview
Chemistry · Unit 4: Chemical Calculations and Gases
0/10
-
19.1 The Mole and Chemical Calculations
15 minPreview
-
19.1.1 The mole, molar mass and formulas
15 minPreview
-
19.1.1 The mole, molar mass and formulas — Practice
3 questionsPreview
-
19.1.2 Stoichiometric calculations and solutions
15 minPreview
-
19.1.2 Stoichiometric calculations and solutions — Practice
2 questionsPreview
-
19.2 Gases and Their Laws
15 minPreview
-
19.2.1 The simple gas laws
15 minPreview
-
19.2.1 The simple gas laws — Practice
2 questionsPreview
-
19.2.2 The ideal gas and the kinetic theory
15 minPreview
-
19.2.2 The ideal gas and the kinetic theory — Practice
2 questionsPreview
Chemistry · Unit 5: Energy, Reaction Rate and Equilibrium
0/15
-
20.1 Energy and Chemical Changes
15 minPreview
-
20.1.1 Thermal energy and enthalpy
15 minPreview
-
20.1.1 Thermal energy and enthalpy — Practice
2 questionsPreview
-
20.1.2 Thermochemical equations and Hess’s law
15 minPreview
-
20.1.2 Thermochemical equations and Hess’s law — Practice
6 questionsPreview
-
20.2 Chemical Reaction Rate
15 minPreview
-
20.2.1 Factors affecting reaction rate
15 minPreview
-
20.2.1 Factors affecting reaction rate — Practice
7 questionsPreview
-
20.2.2 Activation energy and catalysts
15 minPreview
-
20.2.2 Activation energy and catalysts — Practice
6 questionsPreview
-
20.3 Chemical Equilibrium
15 minPreview
-
20.3.1 The equilibrium constant and its calculations
15 minPreview
-
20.3.1 The equilibrium constant and its calculations — Practice
7 questionsPreview
-
20.3.2 Le Chatelier’s principle and ionic equilibrium
15 minPreview
-
20.3.2 Le Chatelier’s principle and ionic equilibrium — Practice
6 questionsPreview
Chemistry · Unit 6: Mixtures, Acids and Bases
0/10
-
21.1 Mixtures and Solutions
15 minPreview
-
21.1.1 Solubility and methods of separating mixtures
15 minPreview
-
21.1.1 Solubility and methods of separating mixtures – Exam questions
12 questionsPreview
-
21.1.2 Concentrations and colligative properties of solutions
15 minPreview
-
21.1.2 Concentrations and colligative properties of solutions — Practice
4 questionsPreview
-
21.2 Acids, Bases and pH
15 minPreview
-
21.2.1 Acid-base theories and pH
15 minPreview
-
21.2.1 Acid-base theories and pH — Practice
4 questionsPreview
-
21.2.2 Neutralization, titration, salts and buffer solutions
15 minPreview
-
21.2.2 Neutralization, titration, salts and buffer solutions — Practice
1 questionsPreview
Chemistry · Unit 7: Electrochemistry
0/10
-
22.1 Oxidation and Reduction
15 minPreview
-
22.1.1 Oxidation numbers and balancing half-reactions
15 minPreview
-
22.1.1 Oxidation numbers and balancing half-reactions — Practice
4 questionsPreview
-
22.1.2 Oxidizing and reducing agents and the activity series
15 minPreview
-
22.1.2 Oxidizing and reducing agents and the activity series — Practice
1 questionsPreview
-
22.2 Electrochemical Cells and Electrolysis
15 minPreview
-
22.2.1 Galvanic cells and cell potential
15 minPreview
-
22.2.1 Galvanic cells and cell potential — Practice
2 questionsPreview
-
22.2.2 Electrolysis, corrosion and protection
15 minPreview
-
22.2.2 Electrolysis, corrosion and protection — Practice
2 questionsPreview
Chemistry · Unit 8: Organic Chemistry
0/15
-
23.1 Hydrocarbons and Their Nomenclature
15 minPreview
-
23.1.1 Alkanes and alkenes and nomenclature
15 minPreview
-
23.1.1 Alkanes and alkenes and nomenclature — Practice
2 questionsPreview
-
23.1.2 Alkynes and aromatic compounds and their reactions
15 minPreview
-
23.1.2 Alkynes and aromatic compounds and their reactions — Practice
1 questionsPreview
-
23.2 Hydrocarbon Derivatives and Polymers
15 minPreview
-
23.2.1 Functional groups, alcohols and aldehydes
15 minPreview
-
23.2.1 Functional groups, alcohols and aldehydes — Practice
2 questionsPreview
-
23.2.2 Carboxylic acids, esters and polymers
15 minPreview
-
23.2.2 Carboxylic acids, esters and polymers — Practice
3 questionsPreview
-
23.3 Biological Organic Compounds
15 minPreview
-
23.3.1 Carbohydrates, lipids and proteins
15 minPreview
-
23.3.1 Carbohydrates, lipids and proteins — Practice
5 questionsPreview
-
23.3.2 Vitamins, nucleic acids and fermentation
15 minPreview
-
23.3.2 Vitamins, nucleic acids and fermentation — Practice
5 questionsPreview
Chemistry · Unit 9: Chemistry question bank with original diagrams
0/1
Chemistry · Mock exams and full tests
0/1
Biology · Unit 1: Introduction to Biology and Classification
0/20
-
26.1 Biology and Scientific Methods
15 minPreview
-
26.1.1 Characteristics of living things and levels of organization
15 minPreview
-
26.1.1 Characteristics of living things and levels of organization — Practice
12 questionsPreview
-
26.1.2 Scientific methods, experiments and variables
15 minPreview
-
26.1.2 Scientific methods, experiments and variables — Practice
17 questionsPreview
-
26.2 Classification and Binomial Nomenclature
15 minPreview
-
26.2.1 Basis of classification and the kingdoms of living things
15 minPreview
-
26.2.1 Basis of classification and the kingdoms of living things — Practice
3 questionsPreview
-
26.2.2 Taxonomic keys and binomial nomenclature
15 minPreview
-
26.2.2 Taxonomic keys and binomial nomenclature — Practice
1 questionsPreview
-
26.3 Viruses and Bacteria
15 minPreview
-
26.3.1 Virus structure and reproduction
15 minPreview
-
26.3.1 Virus structure and reproduction — Practice
2 questionsPreview
-
26.3.2 Bacteria: shapes, reproduction and roles
15 minPreview
-
26.3.2 Bacteria: shapes, reproduction and roles — Practice
2 questionsPreview
-
26.4 Protists and Fungi
15 minPreview
-
26.4.1 Protists: plant-like, animal-like and fungus-like
15 minPreview
-
26.4.1 Protists: plant-like, animal-like and fungus-like — Practice
3 questionsPreview
-
26.4.2 Fungi: structure, reproduction and importance
15 minPreview
-
26.4.2 Fungi: structure, reproduction and importance — Practice
1 questionsPreview
Biology · Unit 2: The Animal Kingdom
0/10
-
27.1 Invertebrates
15 minPreview
-
27.1.1 Simple invertebrates: sponges, cnidarians and worms
15 minPreview
-
27.1.1 Simple invertebrates: sponges, cnidarians and worms — Practice
2 questionsPreview
-
27.1.2 Mollusks, arthropods and echinoderms
15 minPreview
-
27.1.2 Mollusks, arthropods and echinoderms — Practice
2 questionsPreview
-
27.2 Vertebrates
15 minPreview
-
27.2.1 Fish, amphibians and reptiles
15 minPreview
-
27.2.1 Fish, amphibians and reptiles — Practice
3 questionsPreview
-
27.2.2 Birds and mammals and their characteristics
15 minPreview
-
27.2.2 Birds and mammals and their characteristics — Practice
1 questionsPreview
Biology · Unit 3: The Plant Kingdom
0/10
-
28.1 Divisions of the Plant Kingdom and Plant Tissues
15 minPreview
-
28.1.1 Nonvascular and vascular plants
15 minPreview
-
28.1.1 Nonvascular and vascular plants — Practice
6 questionsPreview
-
28.1.2 Plant tissues and the functions of roots, stems and leaves
15 minPreview
-
28.1.2 Plant tissues and the functions of roots, stems and leaves — Practice
7 questionsPreview
-
28.2 Plant Hormones, Flowers and Reproduction
15 minPreview
-
28.2.1 Plant hormones and responses
15 minPreview
-
28.2.1 Plant hormones and responses — Practice
6 questionsPreview
-
28.2.2 Flower structure, pollination and fertilization
15 minPreview
-
28.2.2 Flower structure, pollination and fertilization — Practice
5 questionsPreview
Biology · Unit 4: The Cell
0/15
-
29.1 Cell Structures and Cellular Transport
15 minPreview
-
29.1.1 Organelles and the structures of animal and plant cells
15 minPreview
-
29.1.1 Organelles and the structures of animal and plant cells — Practice
3 questionsPreview
-
29.1.2 Passive transport, active transport and osmosis
15 minPreview
-
29.1.2 Passive transport, active transport and osmosis — Practice
2 questionsPreview
-
29.2 Cellular Energy: Photosynthesis and Respiration
15 minPreview
-
29.2.1 Photosynthesis, light reactions and the Calvin cycle
15 minPreview
-
29.2.1 Photosynthesis, light reactions and the Calvin cycle — Practice
2 questionsPreview
-
29.2.2 Anaerobic and aerobic cellular respiration
15 minPreview
-
29.2.2 Anaerobic and aerobic cellular respiration — Practice
2 questionsPreview
-
29.3 The Cell Cycle and Meiosis
15 minPreview
-
29.3.1 The cell cycle and mitosis
15 minPreview
-
29.3.1 The cell cycle and mitosis — Practice
2 questionsPreview
-
29.3.2 Meiosis and genetic variation
15 minPreview
-
29.3.2 Meiosis and genetic variation — Practice
2 questionsPreview
Biology · Unit 5: Genetics
0/15
-
30.1 Mendelian Genetics
15 minPreview
-
30.1.1 Mendelian inheritance and monohybrid and dihybrid crosses
15 minPreview
-
30.1.1 Mendelian inheritance and monohybrid and dihybrid crosses — Practice
3 questionsPreview
-
30.1.2 Genetic probability and Punnett squares
15 minPreview
-
30.1.2 Genetic probability and Punnett squares — Practice
1 questionsPreview
-
30.2 Patterns of Inheritance in Humans
15 minPreview
-
30.2.1 Non-Mendelian inheritance: codominance and sex-linked traits
15 minPreview
-
30.2.1 Non-Mendelian inheritance: codominance and sex-linked traits — Practice
2 questionsPreview
-
30.2.2 Genetic disorders and chromosomes
15 minPreview
-
30.2.2 Genetic disorders and chromosomes — Practice
4 questionsPreview
-
30.3 Nucleic Acids and Chromosomes
15 minPreview
-
30.3.1 DNA structure and replication
15 minPreview
-
30.3.1 DNA structure and replication — Practice
3 questionsPreview
-
30.3.2 Translation, mutations and gene expression
15 minPreview
-
30.3.2 Translation, mutations and gene expression — Practice
2 questionsPreview
Biology · Unit 6: Human Body Systems
0/20
-
31.1 Skeletal, Muscular and Nervous Systems
15 minPreview
-
31.1.1 The skeletal and muscular systems
15 minPreview
-
31.1.1 The skeletal and muscular systems — Practice
8 questionsPreview
-
31.1.2 The nervous system and the human senses
15 minPreview
-
31.1.2 The nervous system and the human senses — Practice
5 questionsPreview
-
31.2 Circulatory, Respiratory and Excretory Systems
15 minPreview
-
31.2.1 The circulatory, lymphatic and respiratory systems
15 minPreview
-
31.2.1 The circulatory, lymphatic and respiratory systems — Practice
8 questionsPreview
-
31.2.2 The excretory system, skin and liver
15 minPreview
-
31.2.2 The excretory system, skin and liver — Practice
1 questionsPreview
-
31.3 Digestive System, Nutrition and Endocrine Glands
15 minPreview
-
31.3.1 Digestion, enzymes and glands
15 minPreview
-
31.3.1 Digestion, enzymes and glands — Practice
5 questionsPreview
-
31.3.2 Nutrition, health and the immune system
15 minPreview
-
31.3.2 Nutrition, health and the immune system – Exam questions
12 questionsPreview
-
31.4 Reproductive and Immune Systems
15 minPreview
-
31.4.1 Male and female reproductive systems and hormones
15 minPreview
-
31.4.1 Male and female reproductive systems and hormones — Practice
3 questionsPreview
-
31.4.2 Immunity, diseases and body systems
15 minPreview
-
31.4.2 Immunity, diseases and body systems — Practice
1 questionsPreview
Biology · Unit 7: Ecology and Animal Behavior
0/15
-
32.1 Living Organisms and Cycles in the Biosphere
15 minPreview
-
32.1.1 Interactions in ecosystems and food chains
15 minPreview
-
32.1.1 Interactions in ecosystems and food chains — Practice
4 questionsPreview
-
32.1.2 The carbon, nitrogen and water cycles
15 minPreview
-
32.1.2 The carbon, nitrogen and water cycles — Practice
1 questionsPreview
-
32.2 Ecological Succession, Biomes and Aquatic Systems
15 minPreview
-
32.2.1 Tolerance and ecological succession
15 minPreview
-
32.2.1 Tolerance and ecological succession — Practice
3 questionsPreview
-
32.2.2 Terrestrial and aquatic biomes
15 minPreview
-
32.2.2 Terrestrial and aquatic biomes — Practice
1 questionsPreview
-
32.3 Populations, Biodiversity and Animal Behavior
15 minPreview
-
32.3.1 Population growth and biodiversity
15 minPreview
-
32.3.1 Population growth and biodiversity — Practice
3 questionsPreview
-
32.3.2 Animal behavior and groups
15 minPreview
-
32.3.2 Animal behavior and groups — Practice
1 questionsPreview
Biology · Mock exams and full tests
0/2
Text lesson
5.2.1 The exponential function, growth and decay
Describe the graph of an exponential function and use exponential models for growth, decay and compound interest.
1Key ideas2Key ideas3Key ideas4Key ideas5Key ideas6Key ideas
Key ideas
Key ideas
1
An exponential function has the form y = ab
x
with a ≠ 0, b >
0 and b ≠ 1. The variable is in the exponent.
2
If b >
1 the function shows growthif 0 <b <1 it shows decay.
1 / 6Next ▶
Key ideas
1
3
2
The graph of y = b
3
passes through (0, 1), has the x-axis as a horizontal asymptote, domain all real numbers and range y >
0.
4
4
5
Growth by a percentage r each period: A = P(1 + r)
6
t
◀ Previous2 / 6Next ▶
Key ideas
Key ideas
. Decay: A = P(1 − r)
.
5
Compound interest: A = P(1 + r/n)
nt
continuous growth: A = Pe
◀ Previous3 / 6Next ▶
Key ideas
Key ideas
rt
where e ≈ 2.718.
6
Half-life: the amount remaining after time t is A = A
0
(1/2)
◀ Previous4 / 6Next ▶
Key ideas
1
t/h
2
where h is the half-life.
3
7
4
To solve an exponential equation, write both sides with the same base and set the exponents equal, or take logarithms.
◀ Previous5 / 6Next ▶
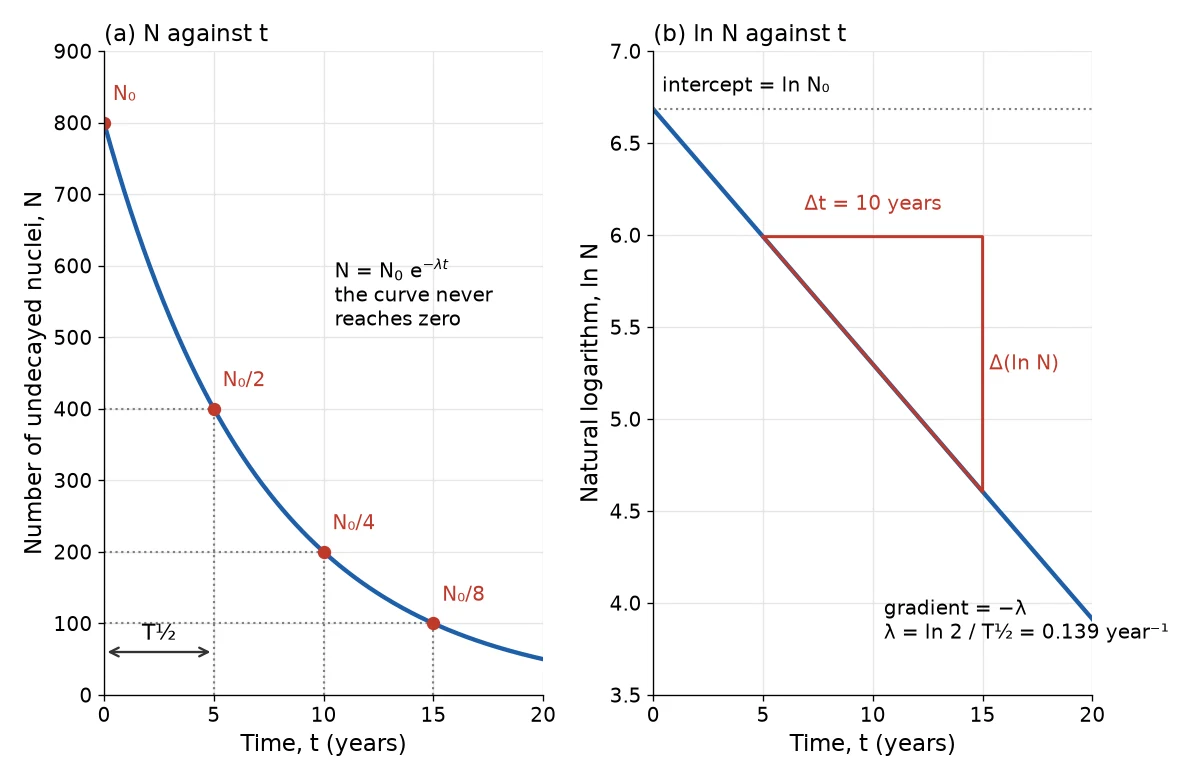
Two panels: left, exponential decay curve of N against t with points at N0, N0/2, N0/4, N0/8; right, straight line of ln N against t with gradient triangle
Key ideas
◀ Previous6 / 6
1Worked examples2Worked examples
Worked examples
Worked examples
A population of 500 grows by 20% each year. Find it after 3 years.
— 500 × 1.23 = 864.
Solve 2
x + 1
= 32.
— 32 = 25
so x + 1 = 5 and x = 4.
1 / 2Next ▶
Exponential growth: Two graphs of population size against time: exponential growth with no limit rises in a steep J-shaped curve, while logistic growth rises, slows, and levels off at a horizontal carrying capacity line, forming an S-shape.
Worked examples
 ⤢ Enlarge
1
A substance has half-life 6 h. How much of 80 g remains after 18 h?
2
— Three half-lives: 80 → 40 → 20 → 10 g.
◀ Previous2 / 2
Key terms
Exponential function
Exponential function — a function with the variable in the exponent
Growth factor
Growth factor — the base b when b > 1
Decay factor
Decay factor — the base b when 0 < b < 1
Asymptote
Asymptote — a line the graph approaches without touching
Half-life
Half-life — the time for a quantity to fall to half its value
e — the irrational number about 2.718 used for continuous growth
| Feature | Growth | Decay |
|---|---|---|
| Base b | b > 1 | 0 < b < 1 |
| Graph from left to right | rises | falls |
| Percentage model | P(1 + r)t | P(1 − r)t |
1
Change the percentage to a decimal before using it.
2
A decrease of 15% means a factor of 0.85, not 0.15.
3
Count the number of compounding periods carefully (n per year times years).
4
Linear change adds the same amount each step; exponential change multiplies by the same factor.