Curriculum
EST II Physics
1. Mechanics
0/19
2. Electricity and Magnetism
0/15
3. Waves and Optics
0/13
4. Heat and Thermodynamics
0/7
5. Modern Physics
0/11
6. Measurement, Analysis and Contemporary Physics
0/5
-
6. Measurement, Analysis and Contemporary Physics
 Preview
-
6.1 Measurement, Units and Graphical Analysis
Preview
-
6.1 Measurement, Units and Graphical Analysis - Check yourself
 Preview
-
6.2 History of Physics and Contemporary Physics
Preview
-
6.2 History of Physics and Contemporary Physics - Check yourself
Preview
Text lesson
6.1 Measurement, Units and Graphical Analysis
6.1 Measurement, Units and Graphical Analysis — EST II PHYSICS notes: You will be able to convert between SI units and prefixes, check an equation with dimensional analysis, give answers to the correct number of significant figures with an uncertainty, and read slopes, areas and intercepts from graphs or linearise a relationship to find a constant.
The International System of Units (SI) is the system used for every measurement on the EST II Physics test.
Its base units include the metre (m) for length, the kilogram (kg) for mass, the second (s) for time, the ampere (A) for electric current and the kelvin (K) for temperature.
The mole (mol) for amount of substance also appears in the course, and the candela (cd) for luminous intensity is rarely needed.
Derived units are built from the base units.
The newton (N) is kg·m/s2, the joule (J) is N·m, the watt (W) is J/s, the pascal (Pa) is N/m2, the hertz (Hz) is s−1, the coulomb (C) is A·s, the volt (V) is J/C and the ohm (Ω) is V/A.
Knowing these definitions lets you check whether an answer has the right unit.
A prefix multiplies a unit by a power of ten. The prefixes to know are listed in the table below.
Note that the capital M means mega and the lowercase m means milli, so mm (millimetre) and MΩ (megaohm) must not be confused.
Prefix
giga
Symbol
G
Factor
109
Example
1 GHz = 109 Hz
Prefix
mega
Symbol
M
Factor
106
Example
1 MW = 106 W
Prefix
kilo
Symbol
k
Factor
103
Example
1 km = 103 m
Prefix
centi
Symbol
c
Factor
10−2
Example
1 cm = 10−2 m
Prefix
milli
Symbol
m
Factor
10−3
Example
1 mA = 10−3 A
Prefix
micro
Symbol
μ
Factor
10−6
Example
1 μC = 10−6 C
Prefix
nano
Symbol
n
Factor
10−9
Example
1 nm = 10−9 m
Prefix
pico
Symbol
p
Factor
10−12
Example
1 pF = 10−12 F
To convert a unit, multiply by a conversion factor equal to one, such as 1 km/1000 m.
Write the factor so that the unit you want to remove is in the denominator.
For example, 90 km/h becomes 90 km/h × (1000 m/1 km) × (1 h/3600 s) = 25 m/s.
When a unit is squared or cubed, the conversion factor must be squared or cubed too.
Since 1 m = 100 cm, 1 m2 = (100 cm)2 = 104 cm2, not 100 cm2.
The same rule applies to volume: 1 m3 = 106 cm3.
Every physical quantity has a dimension, written with square brackets using the base dimensions length [L], mass [M] and time [T].
Velocity has dimensions [L][T]−1, acceleration has [L][T]−2, force has [M][L][T]−2, energy has [M][L]2[T]−2 and pressure has [M][L]−1[T]−2.
Dimensional analysis is the check that both sides of an equation have the same dimensions.
You can add or subtract only quantities that have the same dimensions.
For example, the equation v = at2 is wrong the left side has dimensions [L][T]−1, but the right side has [L][T]−2[T]2 = [L].
Dimensional analysis cannot find pure numbers, such as the ½ in kinetic energy ½mv2 or the 2π in a period, so a correct dimension check does not prove an equation is correct.
The significant figures of a measurement are the digits that are known with some confidence, including the last digit that is estimated.
Every nonzero digit is significant, and zeros between nonzero digits are significant.
Leading zeros are never significant, so 0.0045 has two significant figures.
Trailing zeros after a decimal point are significant, so 2.50 has three.
A whole number with trailing zeros is ambiguous, so 1500 with two significant figures is written as 1.5 × 10³.
Powers of ten and exact counted numbers do not limit the number of significant figures.
When multiplying or dividing, the answer has the same number of significant figures as the measurement with the fewest.
When adding or subtracting, the answer has the same number of decimal places as the measurement with the fewest decimal places.
Keep extra digits during the working and round only the final answer.
If the first dropped digit is 5 or more, round up.
An estimate gives the answer to the order of magnitude, which is the nearest power of ten.
To estimate, round each quantity to one significant figure, carry out the calculation and give the answer to one significant figure.
Estimation is used to check whether an answer is reasonable, not to replace an exact calculation.
Accuracy is how close a measurement is to the true value.
Precision is how close repeated measurements are to each other.
A systematic error, such as a balance that reads 0.2 g when empty, shifts all readings and lowers accuracy.
A random error scatters the readings and lowers precision, and it can be reduced by repeating the measurement and taking an average.
The uncertainty of a measurement is written as x ± δx, where x is the measured value and δx is the absolute uncertainty in the same unit.
The percent uncertainty is (δx/x) × 100%.
For example, a length of 25.0 cm ± 0.5 cm has a percent uncertainty of (0.5/25.0) × 100% = 2.0%.
A reading on a ruler is commonly given an uncertainty of half of the smallest division.
When two measured quantities are added or subtracted, their absolute uncertainties are added.
When they are multiplied or divided, their percent uncertainties are added.
These rules give the largest likely uncertainty in the result.
A final answer is quoted with an uncertainty to one significant figure, and the value is rounded to the same decimal place as the uncertainty.
Before reading a graph, check the labels, units and scale of both axes.
The slope of a straight line is the change in the vertical quantity divided by the change in the horizontal quantity, slope = Δy/Δx.
Its unit is the unit of y divided by the unit of x.
The slope of a position–time graph is velocity in m/s, and the slope of a velocity–time graph is acceleration in m/s2.
The area under a graph equals the product of the units on the two axes.
The area under a velocity–time graph is the displacement in metres, and the area under a force–displacement graph is the work done in joules.
Areas of rectangles and triangles are found with bh and ½bh.
An area below the horizontal axis is negative.
The intercept is the value of a quantity when the other is zero.
The y-intercept of a velocity–time graph is the initial velocity, and the y-intercept of a graph of V against I is the emf of the source when no current is drawn.
The graph of V against I for a resistor is a straight line through the origin, and its slope is the resistance R = ΔV/ΔI in ohms.
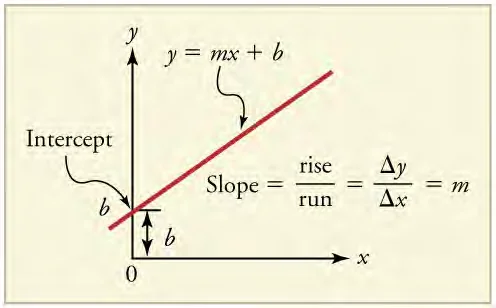
A straight line has the form y = mx + c, where m is the slope and c is the y-intercept.
A relationship that curves can be linearised by choosing new variables so that the graph becomes straight.
If y is proportional to x2, plot y against x2.
If y is proportional to 1/x, plot y against 1/x.
The slope of the new straight line is then the constant of proportionality.
For example, the distance d travelled from rest under constant acceleration a is d = ½at2.
A graph of d against t2 is a straight line through the origin with slope ½a, so the acceleration is a = 2 × slope.
A graph of F against 1/r2 for two masses at separation r has a slope equal to the constant that multiplies 1/r2.
To find the slope of a best-fit line, choose two points far apart on the line, not two data points, and find the change in y and the change in x between them.
A straight line that does not pass through the origin has a nonzero intercept, which may indicate a systematic error or an extra term in the relationship.
Question
A car travels at 90 km/h. Find its speed in metres per second
1
90 km/h = 90 × 103 m / 3600 s = 90 000/3600 m/s = 25 m/s.
Answer
25 m/s. Dividing by 3.6 converts km/h to m/s, so multiplying by 3.6 would be wrong
Question
A rectangle has length 25.0 cm ± 0.5 cm and width 4.0 cm ± 0.1 cm. Find the area and its uncertainty.
1
The percent uncertainty of the length is (0.5/25.0) × 100% = 2.0%.
2
The percent uncertainty of the width is (0.1/4.0) × 100% = 2.5%.
3
For a product, the percent uncertainties are added, giving 4.5%.
4
The area is 25.0 cm × 4.0 cm = 100 cm2, so the uncertainty is 4.5% of 100 cm2 = 4.5 cm2.
Answer
The area is 100 cm2 with an uncertainty of about 4.5 cm2, a percent uncertainty of 4.5%.
Question
A block of mass 2.50 kg has an acceleration of 0.40 m/s2. Find the net force on the block to the correct number of significant figures.
1
F = ma = (2.50 kg)(0.40 m/s2) = 1.00 N, which is rounded to 1.0 N.
2
The mass has three significant figures and the acceleration has two, so the answer is limited to two significant figures.
Answer
1.0 N. The unit check also works: kg × m/s2 = N.
Question
The distance d of a cart from its starting point is plotted against t2, where t is the time from rest. The points lie on a straight line through the origin with slope 5.0 m/s2. Find the acceleration of the cart.
1
Since d = ½at2, the slope of the d against t2 graph is ½a.
2
So ½a = 5.0 m/s2, and a = 2 × 5.0 m/s2 = 10 m/s2.
Answer
10 m/s2. The unit of the slope, m/s2, is the unit of acceleration, which confirms the working.
Converting 90 km/h to m/s by multiplying by 3.6
To convert to m/s from km/h, divide by 3.6.
Converting an area or volume with the length factor only, for example writing 1 m2 = 100 cm2
The factor must be squared, so 1 m2 = 104 cm2.
Adding percent uncertainties when quantities are added or subtracted
For a sum or difference, add the absolute uncertainties.
Reporting every digit from a calculator
Round the final answer to the fewest significant figures in the data, and count leading zeros as not significant.
Reading the slope of a v–t graph as velocity
The slope of a velocity–time graph is acceleration, and the area under it is displacement.
Claiming that dimensional analysis confirms a numerical factor such as ½ or 2π
It checks only the units, so a correct check does not prove the equation is correct.
Avoid
Using the slope of a curve drawn between two distant points without a tangent or best-fit line, which gives an average rather than the value at a point