Curriculum
Biology for AP Courses
Unit 1: The Study of Life
0/6
-
Unit 1 overview: The Study of Life
 Text lessonPreview
-
1.1 The Science of Biology
Text lessonPreview
-
1.1 The Science of Biology - Check yourself
 6 questionsPreview
-
1.2 Themes and Concepts of Biology
Text lessonPreview
-
1.2 Themes and Concepts of Biology - Check yourself
6 questionsPreview
-
Unit 1 review quiz: The Study of Life
10 questionsPreview
Unit 2: The Chemical Foundation of Life
0/8
-
Unit 2 overview: The Chemical Foundation of Life
Text lessonPreview
-
2.1 Atoms, Isotopes, Ions, and Molecules: The Building Blocks
Text lessonPreview
-
2.1 Atoms, Isotopes, Ions, and Molecules: The Building Blocks - Check yourself
6 questionsPreview
-
2.2 Water
Text lessonPreview
-
2.2 Water - Check yourself
6 questionsPreview
-
2.3 Carbon
Text lessonPreview
-
2.3 Carbon - Check yourself
6 questionsPreview
-
Unit 2 review quiz: The Chemical Foundation of Life
10 questionsPreview
Unit 3: Biological Macromolecules
0/12
-
Unit 3 overview: Biological Macromolecules
Text lessonPreview
-
3.1 Synthesis of Biological Macromolecules
Text lessonPreview
-
3.1 Synthesis of Biological Macromolecules - Check yourself
6 questionsPreview
-
3.2 Carbohydrates
Text lessonPreview
-
3.2 Carbohydrates - Check yourself
6 questionsPreview
-
3.3 Lipids
Text lessonPreview
-
3.3 Lipids - Check yourself
6 questionsPreview
-
3.4 Proteins
Text lessonPreview
-
3.4 Proteins - Check yourself
6 questionsPreview
-
3.5 Nucleic Acids
Text lessonPreview
-
3.5 Nucleic Acids - Check yourself
6 questionsPreview
-
Unit 3 review quiz: Biological Macromolecules
10 questionsPreview
Unit 4: Cell Structure
0/14
-
Unit 4 overview: Cell Structure
Text lessonPreview
-
4.1 Studying Cells
Text lessonPreview
-
4.1 Studying Cells - Check yourself
6 questionsPreview
-
4.2 Prokaryotic Cells
Text lessonPreview
-
4.2 Prokaryotic Cells - Check yourself
6 questionsPreview
-
4.3 Eukaryotic Cells
Text lessonPreview
-
4.3 Eukaryotic Cells - Check yourself
6 questionsPreview
-
4.4 The Endomembrane System and Proteins
Text lessonPreview
-
4.4 The Endomembrane System and Proteins - Check yourself
6 questionsPreview
-
4.5 Cytoskeleton
Text lessonPreview
-
4.5 Cytoskeleton - Check yourself
6 questionsPreview
-
4.6 Connections between Cells and Cellular Activities
Text lessonPreview
-
4.6 Connections between Cells and Cellular Activities - Check yourself
6 questionsPreview
-
Unit 4 review quiz: Cell Structure
10 questionsPreview
Unit 5: Structure and Function of Plasma Membranes
0/10
-
Unit 5 overview: Structure and Function of Plasma Membranes
Text lessonPreview
-
5.1 Components and Structure
Text lessonPreview
-
5.1 Components and Structure - Check yourself
6 questionsPreview
-
5.2 Passive Transport
Text lessonPreview
-
5.2 Passive Transport - Check yourself
6 questionsPreview
-
5.3 Active Transport
Text lessonPreview
-
5.3 Active Transport - Check yourself
6 questionsPreview
-
5.4 Bulk Transport
Text lessonPreview
-
5.4 Bulk Transport - Check yourself
6 questionsPreview
-
Unit 5 review quiz: Structure and Function of Plasma Membranes
10 questionsPreview
Unit 6: Metabolism
0/12
-
Unit 6 overview: Metabolism
Text lessonPreview
-
6.1 Energy and Metabolism
Text lessonPreview
-
6.1 Energy and Metabolism - Check yourself
6 questionsPreview
-
6.2 Potential, Kinetic, Free, and Activation Energy
Text lessonPreview
-
6.2 Potential, Kinetic, Free, and Activation Energy - Check yourself
6 questionsPreview
-
6.3 The Laws of Thermodynamics
Text lessonPreview
-
6.3 The Laws of Thermodynamics - Check yourself
6 questionsPreview
-
6.4 ATP: Adenosine Triphosphate
Text lessonPreview
-
6.4 ATP: Adenosine Triphosphate - Check yourself
6 questionsPreview
-
6.5 Enzymes
Text lessonPreview
-
6.5 Enzymes - Check yourself
6 questionsPreview
-
Unit 6 review quiz: Metabolism
10 questionsPreview
Unit 7: Cellular Respiration
0/16
-
Unit 7 overview: Cellular Respiration
Text lessonPreview
-
7.1 Energy in Living Systems
Text lessonPreview
-
7.1 Energy in Living Systems - Check yourself
6 questionsPreview
-
7.2 Glycolysis
Text lessonPreview
-
7.2 Glycolysis - Check yourself
6 questionsPreview
-
7.3 Oxidation of Pyruvate and the Citric Acid Cycle
Text lessonPreview
-
7.3 Oxidation of Pyruvate and the Citric Acid Cycle - Check yourself
6 questionsPreview
-
7.4 Oxidative Phosphorylation
Text lessonPreview
-
7.4 Oxidative Phosphorylation - Check yourself
6 questionsPreview
-
7.5 Metabolism without Oxygen
Text lessonPreview
-
7.5 Metabolism without Oxygen - Check yourself
6 questionsPreview
-
7.6 Connections of Carbohydrate, Protein, and Lipid Metabolic Pathways
Text lessonPreview
-
7.6 Connections of Carbohydrate, Protein, and Lipid Metabolic Pathways - Check yourself
6 questionsPreview
-
7.7 Regulation of Cellular Respiration
Text lessonPreview
-
7.7 Regulation of Cellular Respiration - Check yourself
6 questionsPreview
-
Unit 7 review quiz: Cellular Respiration
10 questionsPreview
Unit 8: Photosynthesis
0/8
-
Unit 8 overview: Photosynthesis
Text lessonPreview
-
8.1 Overview of Photosynthesis
Text lessonPreview
-
8.1 Overview of Photosynthesis - Check yourself
6 questionsPreview
-
8.2 The Light-Dependent Reaction of Photosynthesis
Text lessonPreview
-
8.2 The Light-Dependent Reaction of Photosynthesis - Check yourself
6 questionsPreview
-
8.3 Using Light to Make Organic Molecules
Text lessonPreview
-
8.3 Using Light to Make Organic Molecules - Check yourself
6 questionsPreview
-
Unit 8 review quiz: Photosynthesis
10 questionsPreview
Unit 9: Cell Communication
0/10
-
Unit 9 overview: Cell Communication
Text lessonPreview
-
9.1 Signaling Molecules and Cellular Receptors
Text lessonPreview
-
9.1 Signaling Molecules and Cellular Receptors - Check yourself
6 questionsPreview
-
9.2 Propagation of the Signal
Text lessonPreview
-
9.2 Propagation of the Signal - Check yourself
6 questionsPreview
-
9.3 Response to the Signal
Text lessonPreview
-
9.3 Response to the Signal - Check yourself
6 questionsPreview
-
9.4 Signaling in Single-Celled Organisms
Text lessonPreview
-
9.4 Signaling in Single-Celled Organisms - Check yourself
6 questionsPreview
-
Unit 9 review quiz: Cell Communication
10 questionsPreview
Unit 10: Cell Reproduction
0/12
-
Unit 10 overview: Cell Reproduction
Text lessonPreview
-
10.1 Cell Division
Text lessonPreview
-
10.1 Cell Division - Check yourself
6 questionsPreview
-
10.2 The Cell Cycle
Text lessonPreview
-
10.2 The Cell Cycle - Check yourself
6 questionsPreview
-
10.3 Control of the Cell Cycle
Text lessonPreview
-
10.3 Control of the Cell Cycle - Check yourself
6 questionsPreview
-
10.4 Cancer and the Cell Cycle
Text lessonPreview
-
10.4 Cancer and the Cell Cycle - Check yourself
6 questionsPreview
-
10.5 Prokaryotic Cell Division
Text lessonPreview
-
10.5 Prokaryotic Cell Division - Check yourself
6 questionsPreview
-
Unit 10 review quiz: Cell Reproduction
10 questionsPreview
Unit 11: Meiosis and Sexual Reproduction
0/6
-
Unit 11 overview: Meiosis and Sexual Reproduction
Text lessonPreview
-
11.1 The Process of Meiosis
Text lessonPreview
-
11.1 The Process of Meiosis - Check yourself
6 questionsPreview
-
11.2 Sexual Reproduction
Text lessonPreview
-
11.2 Sexual Reproduction - Check yourself
6 questionsPreview
-
Unit 11 review quiz: Meiosis and Sexual Reproduction
10 questionsPreview
Unit 12: Mendel's Experiments and Heredity
0/8
-
Unit 12 overview: Mendel's Experiments and Heredity
Text lessonPreview
-
12.1 Mendel’s Experiments and the Laws of Probability
Text lessonPreview
-
12.1 Mendel’s Experiments and the Laws of Probability - Check yourself
6 questionsPreview
-
12.2 Characteristics and Traits
Text lessonPreview
-
12.2 Characteristics and Traits - Check yourself
6 questionsPreview
-
12.3 Laws of Inheritance
Text lessonPreview
-
12.3 Laws of Inheritance - Check yourself
6 questionsPreview
-
Unit 12 review quiz: Mendel's Experiments and Heredity
10 questionsPreview
Unit 13: Modern Understandings of Inheritance
0/6
-
Unit 13 overview: Modern Understandings of Inheritance
Text lessonPreview
-
13.1 Chromosomal Theory and Genetic Linkages
Text lessonPreview
-
13.1 Chromosomal Theory and Genetic Linkages - Check yourself
6 questionsPreview
-
13.2 Chromosomal Basis of Inherited Disorders
Text lessonPreview
-
13.2 Chromosomal Basis of Inherited Disorders - Check yourself
6 questionsPreview
-
Unit 13 review quiz: Modern Understandings of Inheritance
10 questionsPreview
Unit 14: DNA Structure and Function
0/14
-
Unit 14 overview: DNA Structure and Function
Text lessonPreview
-
14.1 Historical Basis of Modern Understanding
Text lessonPreview
-
14.1 Historical Basis of Modern Understanding - Check yourself
6 questionsPreview
-
14.2 DNA Structure and Sequencing
Text lessonPreview
-
14.2 DNA Structure and Sequencing - Check yourself
6 questionsPreview
-
14.3 Basics of DNA Replication
Text lessonPreview
-
14.3 Basics of DNA Replication - Check yourself
6 questionsPreview
-
14.4 DNA Replication in Prokaryotes
Text lessonPreview
-
14.4 DNA Replication in Prokaryotes - Check yourself
6 questionsPreview
-
14.5 DNA Replication in Eukaryotes
Text lessonPreview
-
14.5 DNA Replication in Eukaryotes - Check yourself
6 questionsPreview
-
14.6 DNA Repair
Text lessonPreview
-
14.6 DNA Repair - Check yourself
6 questionsPreview
-
Unit 14 review quiz: DNA Structure and Function
10 questionsPreview
Unit 15: Genes and Proteins
0/13
-
Unit 15 overview: Genes and Proteins
Text lessonPreview
-
15.1 The Genetic Code
Text lessonPreview
-
15.1 The Genetic Code - Check yourself
6 questionsPreview
-
15.2 Prokaryotic Transcription
Text lessonPreview
-
15.2 Prokaryotic Transcription
Text lessonPreview
-
15.2 Prokaryotic Transcription - Check yourself
6 questionsPreview
-
15.3 Eukaryotic Transcription
Text lessonPreview
-
15.3 Eukaryotic Transcription - Check yourself
6 questionsPreview
-
15.4 RNA Processing in Eukaryotes
Text lessonPreview
-
15.4 RNA Processing in Eukaryotes - Check yourself
6 questionsPreview
-
15.5 Ribosomes and Protein Synthesis
Text lessonPreview
-
15.5 Ribosomes and Protein Synthesis - Check yourself
6 questionsPreview
-
Unit 15 review quiz: Genes and Proteins
10 questionsPreview
Unit 16: Gene Regulation
0/16
-
Unit 16 overview: Gene Regulation
Text lessonPreview
-
16.1 Regulation of Gene Expression
Text lessonPreview
-
16.1 Regulation of Gene Expression - Check yourself
6 questionsPreview
-
16.2 Prokaryotic Gene Regulation
Text lessonPreview
-
16.2 Prokaryotic Gene Regulation - Check yourself
6 questionsPreview
-
16.3 Eukaryotic Epigenetic Gene Regulation
Text lessonPreview
-
16.3 Eukaryotic Epigenetic Gene Regulation - Check yourself
6 questionsPreview
-
16.4 Eukaryotic Transcriptional Gene Regulation
Text lessonPreview
-
16.4 Eukaryotic Transcriptional Gene Regulation - Check yourself
6 questionsPreview
-
16.5 Eukaryotic Post-transcriptional Gene Regulation
Text lessonPreview
-
16.5 Eukaryotic Post-transcriptional Gene Regulation - Check yourself
6 questionsPreview
-
16.6 Eukaryotic Translational and Post-translational Gene Regulation
Text lessonPreview
-
16.6 Eukaryotic Translational and Post-translational Gene Regulation - Check yourself
6 questionsPreview
-
16.7 Cancer and Gene Regulation
Text lessonPreview
-
16.7 Cancer and Gene Regulation - Check yourself
6 questionsPreview
-
Unit 16 review quiz: Gene Regulation
10 questionsPreview
Unit 17: Biotechnology and Genomics
0/12
-
Unit 17 overview: Biotechnology and Genomics
Text lessonPreview
-
17.1 Biotechnology
Text lessonPreview
-
17.1 Biotechnology - Check yourself
6 questionsPreview
-
17.2 Mapping Genomes
Text lessonPreview
-
17.2 Mapping Genomes - Check yourself
6 questionsPreview
-
17.3 Whole-Genome Sequencing
Text lessonPreview
-
17.3 Whole-Genome Sequencing - Check yourself
6 questionsPreview
-
17.4 Applying Genomics
Text lessonPreview
-
17.4 Applying Genomics - Check yourself
6 questionsPreview
-
17.5 Genomics and Proteomics
Text lessonPreview
-
17.5 Genomics and Proteomics - Check yourself
6 questionsPreview
-
Unit 17 review quiz: Biotechnology and Genomics
10 questionsPreview
Unit 18: Evolution and Origin of Species
0/8
-
Unit 18 overview: Evolution and Origin of Species
Text lessonPreview
-
18.1 Understanding Evolution
Text lessonPreview
-
18.1 Understanding Evolution - Check yourself
6 questionsPreview
-
18.2 Formation of New Species
Text lessonPreview
-
18.2 Formation of New Species - Check yourself
6 questionsPreview
-
18.3 Reconnection and Rates of Speciation
Text lessonPreview
-
18.3 Reconnection and Rates of Speciation - Check yourself
6 questionsPreview
-
Unit 18 review quiz: Evolution and Origin of Species
10 questionsPreview
Unit 19: The Evolution of Populations
0/8
-
Unit 19 overview: The Evolution of Populations
Text lessonPreview
-
19.1 Population Evolution
Text lessonPreview
-
19.1 Population Evolution - Check yourself
6 questionsPreview
-
19.2 Population Genetics
Text lessonPreview
-
19.2 Population Genetics - Check yourself
6 questionsPreview
-
19.3 Adaptive Evolution
Text lessonPreview
-
19.3 Adaptive Evolution - Check yourself
6 questionsPreview
-
Unit 19 review quiz: The Evolution of Populations
10 questionsPreview
Unit 20: Phylogenies and the History of Life
0/8
-
Unit 20 overview: Phylogenies and the History of Life
Text lessonPreview
-
20.1 Organizing Life on Earth
Text lessonPreview
-
20.1 Organizing Life on Earth - Check yourself
6 questionsPreview
-
20.2 Determining Evolutionary Relationships
Text lessonPreview
-
20.2 Determining Evolutionary Relationships - Check yourself
6 questionsPreview
-
20.3 Perspectives on the Phylogenetic Tree
Text lessonPreview
-
20.3 Perspectives on the Phylogenetic Tree - Check yourself
6 questionsPreview
-
Unit 20 review quiz: Phylogenies and the History of Life
10 questionsPreview
Unit 21: Viruses
0/10
-
Unit 21 overview: Viruses
Text lessonPreview
-
21.1 Viral Evolution, Morphology, and Classification
Text lessonPreview
-
21.1 Viral Evolution, Morphology, and Classification - Check yourself
6 questionsPreview
-
21.2 Virus Infection and Hosts
Text lessonPreview
-
21.2 Virus Infection and Hosts - Check yourself
6 questionsPreview
-
21.3 Prevention and Treatment of Viral Infections
Text lessonPreview
-
21.3 Prevention and Treatment of Viral Infections - Check yourself
6 questionsPreview
-
21.4 Other Acellular Entities: Prions and Viroids
Text lessonPreview
-
21.4 Other Acellular Entities: Prions and Viroids - Check yourself
6 questionsPreview
-
Unit 21 review quiz: Viruses
10 questionsPreview
Unit 22: Prokaryotes: Bacteria and Archaea
0/12
-
Unit 22 overview: Prokaryotes: Bacteria and Archaea
Text lessonPreview
-
22.1 Prokaryotic Diversity
Text lessonPreview
-
22.1 Prokaryotic Diversity - Check yourself
6 questionsPreview
-
22.2 Structure of Prokaryotes
Text lessonPreview
-
22.2 Structure of Prokaryotes - Check yourself
6 questionsPreview
-
22.3 Prokaryotic Metabolism
Text lessonPreview
-
22.3 Prokaryotic Metabolism - Check yourself
6 questionsPreview
-
22.4 Bacterial Diseases in Humans
Text lessonPreview
-
22.4 Bacterial Diseases in Humans - Check yourself
6 questionsPreview
-
22.5 Beneficial Prokaryotes
Text lessonPreview
-
22.5 Beneficial Prokaryotes - Check yourself
6 questionsPreview
-
Unit 22 review quiz: Prokaryotes: Bacteria and Archaea
10 questionsPreview
Unit 23: Plant Form and Physiology
0/14
-
Unit 23 overview: Plant Form and Physiology
Text lessonPreview
-
23.1 The Plant Body
Text lessonPreview
-
23.1 The Plant Body - Check yourself
6 questionsPreview
-
23.2 Stems
Text lessonPreview
-
23.2 Stems - Check yourself
6 questionsPreview
-
23.3 Roots
Text lessonPreview
-
23.3 Roots - Check yourself
6 questionsPreview
-
23.4 Leaves
Text lessonPreview
-
23.4 Leaves - Check yourself
6 questionsPreview
-
23.5 Transport of Water and Solutes in Plants
Text lessonPreview
-
23.5 Transport of Water and Solutes in Plants - Check yourself
6 questionsPreview
-
23.6 Plant Sensory Systems and Responses
Text lessonPreview
-
23.6 Plant Sensory Systems and Responses - Check yourself
6 questionsPreview
-
Unit 23 review quiz: Plant Form and Physiology
10 questionsPreview
Unit 24: The Animal Body: Basic Form and Function
0/8
-
Unit 24 overview: The Animal Body: Basic Form and Function
Text lessonPreview
-
24.1 Animal Form and Function
Text lessonPreview
-
24.1 Animal Form and Function - Check yourself
6 questionsPreview
-
24.2 Animal Primary Tissues
Text lessonPreview
-
24.2 Animal Primary Tissues - Check yourself
6 questionsPreview
-
24.3 Homeostasis
Text lessonPreview
-
24.3 Homeostasis - Check yourself
6 questionsPreview
-
Unit 24 review quiz: The Animal Body: Basic Form and Function
10 questionsPreview
Unit 25: Animal Nutrition and the Digestive System
0/10
-
Unit 25 overview: Animal Nutrition and the Digestive System
Text lessonPreview
-
25.1 Digestive Systems
Text lessonPreview
-
25.1 Digestive Systems - Check yourself
6 questionsPreview
-
25.2 Nutrition and Energy Production
Text lessonPreview
-
25.2 Nutrition and Energy Production - Check yourself
6 questionsPreview
-
25.3 Digestive System Processes
Text lessonPreview
-
25.3 Digestive System Processes - Check yourself
6 questionsPreview
-
25.4 Digestive System Regulation
Text lessonPreview
-
25.4 Digestive System Regulation - Check yourself
6 questionsPreview
-
Unit 25 review quiz: Animal Nutrition and the Digestive System
10 questionsPreview
Unit 26: The Nervous System
0/12
-
Unit 26 overview: The Nervous System
Text lessonPreview
-
26.1 Neurons and Glial Cells
Text lessonPreview
-
26.1 Neurons and Glial Cells - Check yourself
6 questionsPreview
-
26.2 How Neurons Communicate
Text lessonPreview
-
26.2 How Neurons Communicate - Check yourself
6 questionsPreview
-
26.3 The Central Nervous System
Text lessonPreview
-
26.3 The Central Nervous System - Check yourself
6 questionsPreview
-
26.4 The Peripheral Nervous System
Text lessonPreview
-
26.4 The Peripheral Nervous System - Check yourself
6 questionsPreview
-
26.5 Nervous System Disorders
Text lessonPreview
-
26.5 Nervous System Disorders - Check yourself
6 questionsPreview
-
Unit 26 review quiz: The Nervous System
10 questionsPreview
Unit 27: Sensory Systems
0/12
-
Unit 27 overview: Sensory Systems
Text lessonPreview
-
27.1 Sensory Processes
Text lessonPreview
-
27.1 Sensory Processes - Check yourself
6 questionsPreview
-
27.2 Somatosensation
Text lessonPreview
-
27.2 Somatosensation - Check yourself
6 questionsPreview
-
27.3 Taste and Smell
Text lessonPreview
-
27.3 Taste and Smell - Check yourself
6 questionsPreview
-
27.4 Hearing and Vestibular Sensation
Text lessonPreview
-
27.4 Hearing and Vestibular Sensation - Check yourself
6 questionsPreview
-
27.5 Vision
Text lessonPreview
-
27.5 Vision - Check yourself
6 questionsPreview
-
Unit 27 review quiz: Sensory Systems
10 questionsPreview
Unit 28: The Endocrine System
0/12
-
Unit 28 overview: The Endocrine System
Text lessonPreview
-
28.1 Types of Hormones
Text lessonPreview
-
28.1 Types of Hormones - Check yourself
6 questionsPreview
-
28.2 How Hormones Work
Text lessonPreview
-
28.2 How Hormones Work - Check yourself
6 questionsPreview
-
28.3 Regulation of Body Processes
Text lessonPreview
-
28.3 Regulation of Body Processes - Check yourself
6 questionsPreview
-
28.4 Regulation of Hormone Production
Text lessonPreview
-
28.4 Regulation of Hormone Production - Check yourself
6 questionsPreview
-
28.5 Endocrine Glands
Text lessonPreview
-
28.5 Endocrine Glands - Check yourself
6 questionsPreview
-
Unit 28 review quiz: The Endocrine System
10 questionsPreview
Unit 29: The Musculoskeletal System
0/10
-
Unit 29 overview: The Musculoskeletal System
Text lessonPreview
-
29.1 Types of Skeletal Systems
Text lessonPreview
-
29.1 Types of Skeletal Systems - Check yourself
6 questionsPreview
-
29.2 Bone
Text lessonPreview
-
29.2 Bone - Check yourself
6 questionsPreview
-
29.3 Joints and Skeletal Movement
Text lessonPreview
-
29.3 Joints and Skeletal Movement - Check yourself
6 questionsPreview
-
29.4 Muscle Contraction and Locomotion
Text lessonPreview
-
29.4 Muscle Contraction and Locomotion - Check yourself
6 questionsPreview
-
Unit 29 review quiz: The Musculoskeletal System
10 questionsPreview
Unit 30: The Respiratory System
0/10
-
Unit 30 overview: The Respiratory System
Text lessonPreview
-
30.1 Systems of Gas Exchange
Text lessonPreview
-
30.1 Systems of Gas Exchange - Check yourself
6 questionsPreview
-
30.2 Gas Exchange across Respiratory Surfaces
Text lessonPreview
-
30.2 Gas Exchange across Respiratory Surfaces - Check yourself
6 questionsPreview
-
30.3 Breathing
Text lessonPreview
-
30.3 Breathing - Check yourself
6 questionsPreview
-
30.4 Transport of Gases in Human Bodily Fluids
Text lessonPreview
-
30.4 Transport of Gases in Human Bodily Fluids - Check yourself
6 questionsPreview
-
Unit 30 review quiz: The Respiratory System
10 questionsPreview
Unit 31: The Circulatory System
0/10
-
Unit 31 overview: The Circulatory System
Text lessonPreview
-
31.1 Overview of the Circulatory System
Text lessonPreview
-
31.1 Overview of the Circulatory System - Check yourself
6 questionsPreview
-
31.2 Components of the Blood
Text lessonPreview
-
31.2 Components of the Blood - Check yourself
6 questionsPreview
-
31.3 Mammalian Heart and Blood Vessels
Text lessonPreview
-
31.3 Mammalian Heart and Blood Vessels - Check yourself
6 questionsPreview
-
31.4 Blood Flow and Blood Pressure Regulation
Text lessonPreview
-
31.4 Blood Flow and Blood Pressure Regulation - Check yourself
6 questionsPreview
-
Unit 31 review quiz: The Circulatory System
10 questionsPreview
Unit 32: Osmotic Regulation and Excretion
0/12
-
Unit 32 overview: Osmotic Regulation and Excretion
Text lessonPreview
-
32.1 Osmoregulation and Osmotic Balance
Text lessonPreview
-
32.1 Osmoregulation and Osmotic Balance - Check yourself
6 questionsPreview
-
32.2 The Kidneys and Osmoregulatory Organs
Text lessonPreview
-
32.2 The Kidneys and Osmoregulatory Organs - Check yourself
6 questionsPreview
-
32.3 Excretion Systems
Text lessonPreview
-
32.3 Excretion Systems - Check yourself
6 questionsPreview
-
32.4 Nitrogenous Wastes
Text lessonPreview
-
32.4 Nitrogenous Wastes - Check yourself
6 questionsPreview
-
32.5 Hormonal Control of Osmoregulatory Functions
Text lessonPreview
-
32.5 Hormonal Control of Osmoregulatory Functions - Check yourself
6 questionsPreview
-
Unit 32 review quiz: Osmotic Regulation and Excretion
10 questionsPreview
Unit 33: The Immune System
0/10
-
Unit 33 overview: The Immune System
Text lessonPreview
-
33.1 Innate Immune Response
Text lessonPreview
-
33.1 Innate Immune Response - Check yourself
6 questionsPreview
-
33.2 Adaptive Immune Response
Text lessonPreview
-
33.2 Adaptive Immune Response - Check yourself
6 questionsPreview
-
33.3 Antibodies
Text lessonPreview
-
33.3 Antibodies - Check yourself
6 questionsPreview
-
33.4 Disruptions in the Immune System
Text lessonPreview
-
33.4 Disruptions in the Immune System - Check yourself
6 questionsPreview
-
Unit 33 review quiz: The Immune System
10 questionsPreview
Unit 34: Animal Reproduction and Development
0/16
-
Unit 34 overview: Animal Reproduction and Development
Text lessonPreview
-
34.1 Reproduction Methods
Text lessonPreview
-
34.1 Reproduction Methods - Check yourself
6 questionsPreview
-
34.2 Fertilization
Text lessonPreview
-
34.2 Fertilization - Check yourself
6 questionsPreview
-
34.3 Human Reproductive Anatomy and Gametogenesis
Text lessonPreview
-
34.3 Human Reproductive Anatomy and Gametogenesis - Check yourself
6 questionsPreview
-
34.4 Hormonal Control of Human Reproduction
Text lessonPreview
-
34.4 Hormonal Control of Human Reproduction - Check yourself
6 questionsPreview
-
34.5 Fertilization and Early Embryonic Development
Text lessonPreview
-
34.5 Fertilization and Early Embryonic Development - Check yourself
6 questionsPreview
-
34.6 Organogenesis and Vertebrate Axis Formation
Text lessonPreview
-
34.6 Organogenesis and Vertebrate Axis Formation - Check yourself
6 questionsPreview
-
34.7 Human Pregnancy and Birth
Text lessonPreview
-
34.7 Human Pregnancy and Birth - Check yourself
6 questionsPreview
-
Unit 34 review quiz: Animal Reproduction and Development
10 questionsPreview
Unit 35: Ecology and the Biosphere
0/12
-
Unit 35 overview: Ecology and the Biosphere
Text lessonPreview
-
35.1 The Scope of Ecology
Text lessonPreview
-
35.1 The Scope of Ecology - Check yourself
6 questionsPreview
-
35.2 Biogeography
Text lessonPreview
-
35.2 Biogeography - Check yourself
6 questionsPreview
-
35.3 Terrestrial Biomes
Text lessonPreview
-
35.3 Terrestrial Biomes - Check yourself
6 questionsPreview
-
35.4 Aquatic Biomes
Text lessonPreview
-
35.4 Aquatic Biomes - Check yourself
6 questionsPreview
-
35.5 Climate and the Effects of Global Climate Change
Text lessonPreview
-
35.5 Climate and the Effects of Global Climate Change - Check yourself
6 questionsPreview
-
Unit 35 review quiz: Ecology and the Biosphere
10 questionsPreview
Unit 36: Population and Community Ecology
0/16
-
Unit 36 overview: Population and Community Ecology
Text lessonPreview
-
36.1 Population Demography
Text lessonPreview
-
36.1 Population Demography - Check yourself
6 questionsPreview
-
36.2 Life Histories and Natural Selection
Text lessonPreview
-
36.2 Life Histories and Natural Selection - Check yourself
6 questionsPreview
-
36.3 Environmental Limits to Population Growth
Text lessonPreview
-
36.3 Environmental Limits to Population Growth - Check yourself
6 questionsPreview
-
36.4 Population Dynamics and Regulation
Text lessonPreview
-
36.4 Population Dynamics and Regulation - Check yourself
6 questionsPreview
-
36.5 Human Population Growth
Text lessonPreview
-
36.5 Human Population Growth - Check yourself
6 questionsPreview
-
36.6 Community Ecology
Text lessonPreview
-
36.6 Community Ecology - Check yourself
6 questionsPreview
-
36.7 Behavioral Biology: Proximate and Ultimate Causes of Behavior
Text lessonPreview
-
36.7 Behavioral Biology: Proximate and Ultimate Causes of Behavior - Check yourself
6 questionsPreview
-
Unit 36 review quiz: Population and Community Ecology
10 questionsPreview
Unit 37: Ecosystems
0/8
-
Unit 37 overview: Ecosystems
Text lessonPreview
-
37.1 Ecology for Ecosystems
Text lessonPreview
-
37.1 Ecology for Ecosystems - Check yourself
6 questionsPreview
-
37.2 Energy Flow through Ecosystems
Text lessonPreview
-
37.2 Energy Flow through Ecosystems - Check yourself
6 questionsPreview
-
37.3 Biogeochemical Cycles
Text lessonPreview
-
37.3 Biogeochemical Cycles - Check yourself
6 questionsPreview
-
Unit 37 review quiz: Ecosystems
10 questionsPreview
Unit 38: Conservation Biology and Biodiversity
0/10
-
Unit 38 overview: Conservation Biology and Biodiversity
Text lessonPreview
-
38.1 The Biodiversity Crisis
Text lessonPreview
-
38.1 The Biodiversity Crisis - Check yourself
6 questionsPreview
-
38.2 The Importance of Biodiversity to Human Life
Text lessonPreview
-
38.2 The Importance of Biodiversity to Human Life - Check yourself
6 questionsPreview
-
38.3 Threats to Biodiversity
Text lessonPreview
-
38.3 Threats to Biodiversity - Check yourself
6 questionsPreview
-
38.4 Preserving Biodiversity
Text lessonPreview
-
38.4 Preserving Biodiversity - Check yourself
6 questionsPreview
-
Unit 38 review quiz: Conservation Biology and Biodiversity
10 questionsPreview
Text lesson
Unit 37 overview: Ecosystems
Unit 37: Ecosystems — BIOLOGY FOR AP COURSES notes: By the end of this unit you will be able to explain how ecologists model ecosystems, how energy and nutrients move through them, and how human activity disturbs their cycles.
1Chapter introduction2Chapter introduction
Chapter introduction
Chapter introduction
In 1993, a rare and deadly lung disease appeared in the southwestern United States.
Many of the early patients were healthy young adults, and more than half of them died within a short time from complete respiratory failure.
The Centers for Disease Control (CDC), the United States agency responsible for handling possible epidemics, was called in,
but at first the disease was unknown.
Local Navajo healers could have given scientists an early warning. They had noticed a link between rainfall and mouse populations. In wet years, pinyon nut production rises, deer mouse numbers grow quickly, and more mice can carry the virus. The 1992–1993 outbreak followed exactly this pattern of wet El Niño weather.
Within a few weeks, CDC investigators identified the cause as a hantavirus called Sin Nombre, a Spanish name meaning “without a name.” Combining laboratory investigation with traditional Navajo knowledge helped scientists describe the disease quickly and introduce effective health measures to stop its spread.
Hantavirus infections are less common today
but they still occur.
1 / 2Next ▶
Chapter introduction
Chapter introduction
The event shows how weather, plant food, animal populations and human health are linked within one ecosystem.
◀ Previous2 / 2
Chapter sections at a glance
1
37.1 Ecology for Ecosystems
2
the basic types of ecosystems, the methods ecologists use to study them, the three main kinds of ecosystem models, and the difference between food chains and food webs.
3
37.2 Energy Flow through Ecosystems
4
how organisms obtain energy, how energy passes between trophic levels with losses at each step, and how ecological pyramids of energy model that flow.
5
37.3 Biogeochemical Cycles
6
how water, carbon, nitrogen, phosphorus and sulfur cycle through living organisms and the non-living world, and how human activity disturbs these cycles.
1Key equation: trophic level transfer efficiency2Key equation: trophic level transfer efficiency
Key equation: trophic level transfer efficiency
Key equation: trophic level transfer efficiency
Trophic level transfer efficiency (TLTE) measures the percentage of energy that passes from one trophic level to the next. It is calculated with this equation:
TLTE (%) = (production at the present trophic level ÷ production at the past trophic level) × 100
TLTE
trophic level transfer efficiency, a percentage with no unit.
Production at the present trophic level
energy stored as biomass at the level receiving energy, in kilocalories per square metre (kcal/m2).
1 / 2Next ▶
Key equation: trophic level transfer efficiency
1
Production at the past trophic level
2
energy stored as biomass at the level that supplied the energy, in kcal/m2.
3
Both production values must use the same units
so the kcal/m2 units cancel and the result is a pure percentage. Because energy is lost at every transfer, TLTE is always less than 100%.
◀ Previous2 / 2
1Chapter summary: 37.1 Ecology for Ecosystems2Chapter summary: 37.1 Ecology for Ecosystems
Chapter summary: 37.1 Ecology for Ecosystems
1
Ecosystems exist on land, in the sea, in the air and underground.
2
Each kind of model helps ecologists predict how environmental disturbances will change an ecosystem’s structure and dynamics.
3
Conceptual models, also called compartment models, are flow charts that show how the living and non-living parts of an ecosystem relate to each other and how matter or energy moves between them.
4
Analytical models use mathematical formulas and suit simple, linear food chains.
5
Simulation models use computer programs to represent holistic food webs and predict the effects of disturbances.
1 / 2Next ▶
Individual, population, community, ecosystem
Chapter summary: 37.1 Ecology for Ecosystems

◀ Previous2 / 2
1Chapter summary: 37.2 Energy Flow through Ecosystems2Chapter summary: 37.2 Energy Flow through Ecosystems
Chapter summary: 37.2 Energy Flow through Ecosystems
1
Organisms in an ecosystem obtain energy in many different ways.
2
Energy moves from the bottom of a food web to the top through trophic levels, and some energy is lost at every transfer.
3
The efficiency of these transfers explains differences in the eating habits and behavior of warm-blooded and cold-blooded animals,
because warm-blooded animals spend a large share of their energy keeping their body temperature constant.
4
Energy flow is best modeled with ecological pyramids of energy.
5
Other pyramids, based on numbers or biomass, give different but equally useful information about ecosystem structure.
1 / 2Next ▶
Food Chain Energy Flow — Step-by-Step Mechanism Simulation (10% Rule)
Chapter summary: 37.2 Energy Flow through Ecosystems
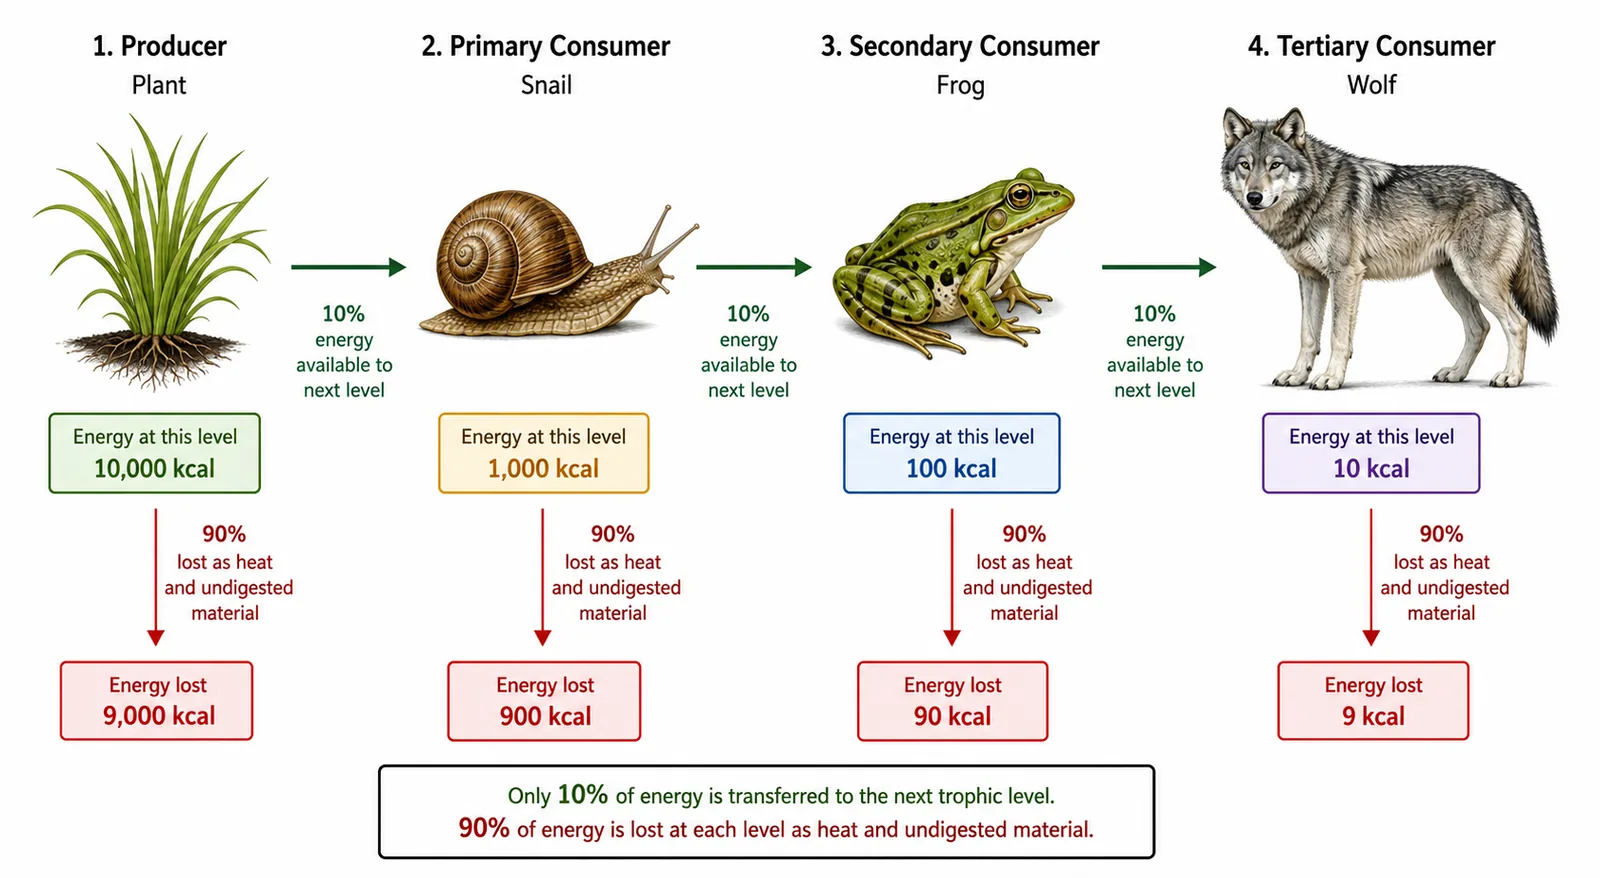
◀ Previous2 / 2
Chapter summary: 37.3 Biogeochemical Cycles
Chapter summary: 37.3 Biogeochemical Cycles
Mineral nutrients cycle through ecosystems and their environment.
The most important cycles involve water, carbon, nitrogen, phosphorus and sulfur.
Each cycle affects the structure and function of ecosystems.
Human activities such as pollution, oil spills and other disturbances have changed these cycles and may contribute to global climate change,
so studying and modeling them is especially important.
Protecting Earth from irreversible damage depends on understanding how these cycles work.
1Review concepts2Review concepts3Review concepts4Review concepts5Review concepts
Review concepts
1
Experimental systems
2
a microcosm is an ecosystem re-created entirely in a laboratory. A mesocosm is a portion of a natural ecosystem set aside for experiments. Both are useful
but both can alter the dynamics of the ecosystem being studiedbecause the system is either rebuilt or partitioned.
3
Resistance and resilience
4
resistance is the ability to stay at equilibrium despite a disturbance. Resilience is the speed at which an ecosystem returns to equilibrium after being disturbed. A highly resilient ecosystem recovers quickly.
5
Disturbances
6
natural disturbances include fire, lightning and volcanic eruptions. Human disturbances include pollution, agriculture, oil spills and new buildings that block sunlight from a forest. Conservationists are concerned about both kinds because they alter ecosystems.
1 / 5Next ▶
Review concepts
1
Food chains and food webs
2
a food chain is linear and easy to follow
but most organisms eat several kinds of foodso a food web is a more accurate, non-linear, holistic picture of an ecosystem.
3
Trophic levels and biomass
4
a trophic level is a position in a food chain or web. Primary producers are the basis of energy for the whole ecosystem, and the amount of energy available shrinks at each higher level.
5
Primary producers without sunlight
6
chemoautotrophs make their own food from energy released by inorganic molecules. They support life in dark places where sunlight cannot reach.
◀ Previous2 / 5Next ▶
Review concepts
Review concepts
Nitrogen cycle
nitrogen fixation brings nitrogen into organic molecules. Nitrification converts ammonia into nitrites and nitrates that plants can use. Denitrification returns nitrogen gas to the atmosphere.
Phosphorus cycle
phosphorus is released into the environment mainly by rock weathering and the decomposition of organic molecules. It has no major gas phase
so it moves mainly through rock, soil, water and organisms.
Sulfur and acid rain
sulfur dioxide gas from the air dissolves into rainwater and forms weak sulfuric acid
which can damage structures and ecosystems.
◀ Previous3 / 5Next ▶
Review concepts
1
Eutrophication and dead zones
2
runoff rich in nitrogen and phosphorus makes microorganisms grow in excess. Their activity uses up dissolved oxygen and kills fish and other animals, creating a dead zone.
3
Water cycle
4
surface runoff is fresh water that flows from rain or melting ice. Evaporation and sublimation return water to the atmosphere. Residence time measures how long a water molecule stays in one reservoir.
5
Carbon cycle
6
the amount of carbon in any location depends most strongly on the exchange between the atmosphere and water. Photosynthesis by plants is a natural process that removes carbon dioxide from the atmosphere
which is called carbon sequestration.
◀ Previous4 / 5Next ▶
Review concepts
Review concepts
Pyramid shapes
energy pyramids are always upright because energy is lost at each transfer. Number and biomass pyramids can be inverted, for example when producers reproduce quickly and turn over rapidly
so a lower standing biomass supports a larger biomass of consumers.
Net and gross productivity
gross primary productivity is the rate at which producers capture energy from the sun. Net primary productivity is what remains after the producers’ own respiration and heat loss, and it is the energy available to the next trophic level.
Science practice questions
reading a graph, food web or pyramid means identifying producers, consumers and changes in abundance, predicting the effect of a change
and then writing a claim that the data support.
◀ Previous5 / 5
1Example 1: Trophic level transfer efficiency between produce2Example 2: Energy reaching the tertiary consumers when each 3Example 2: Energy reaching the tertiary consumers when each
Example 1: Trophic level transfer efficiency between producers and primary consumers
Example 1: Trophic level transfer efficiency between producers and primary consumers
Primary producers produce 1,600 kcal/m2, and primary consumers produce 900 kcal/m2. Find the TLTE.
TLTE = (900 kcal/m2 ÷ 1,600 kcal/m2) × 100 = 0.5625 × 100 = 56.25%
Answer: about 56% of the producers’ energy reaches the primary consumers. The remaining 44% is lost through respiration, heat and waste.
1 / 3Next ▶
Example 2: Energy reaching the tertiary consumers when each step transfers 10%
1
1
2
The producer level holds 33,000 kcal/m2. Assume each transfer passes on 10% of the energy to the next level.
3
2
4
Primary consumers: 33,000 × 0.10 = 3,300 kcal/m2
5
3
6
Secondary consumers: 3,300 × 0.10 = 330 kcal/m2
◀ Previous2 / 3Next ▶
Example 2: Energy reaching the tertiary consumers when each step transfers 10%
1
4
2
Tertiary consumers: 330 × 0.10 = 33 kcal/m2
3
5
4
Answer: only 33 kcal/m2 reaches the tertiary consumer level. This is why food chains are usually short.
◀ Previous3 / 3
Key terms
| Term | Meaning |
|---|---|
| acid rain | Rain made more acidic when sulfur dioxide dissolves in it and forms weak sulfuric acid, which can damage structures and ecosystems. |
| analytical model | An ecosystem model built from mathematical equations to predict how disturbances will change structure and dynamics; best suited to simple, linear food chains. |
| apex consumer | The organism at the top of a food chain. |
| assimilation | The biomass a trophic level takes in from the level below after subtracting energy lost in uneaten food, in respiration and in waste. |
| biogeochemical cycle | The movement of mineral nutrients through living organisms, the environment and the non-living world. |
| biomagnification | The increasing concentration of persistent toxic substances in organisms at each higher trophic level, from primary producers up to apex consumers. |
| biomass | The total weight of living or recently living matter in a unit area within one trophic level, measured at a given time. |
| chemoautotroph | An organism that makes its own food using energy released by inorganic molecules instead of sunlight. |
| conceptual model (compartment model) | A flow chart showing how the living and non-living compartments of an ecosystem interact and how matter or energy moves between them. |
| dead zone | An area in a lake or sea, often near a river mouth, where oxygen loss and pollution have removed most normal plants and animals; caused by eutrophication, oil spills, toxic dumping and similar activities. |
| detrital food web | A food web in which the primary consumers are decomposers feeding on dead matter; often found alongside a grazing food web in the same ecosystem. |
| ecological pyramid (Eltonian pyramid) | A diagram that stacks trophic levels according to the number of organisms, their biomass or their energy content. |
| ecosystem | A community of living organisms, together with their interactions with one another and with their non-living surroundings. |
| ecosystem dynamics | The study of how an ecosystem’s structure changes because of changes in the environment or of forces within the system. |
| equilibrium | A steady state in which the organisms of an ecosystem are in balance with their environment and with each other. |
| eutrophication | Excess growth of microorganisms caused by nutrient runoff, which uses up dissolved oxygen and kills animals in the water. |
| fallout | Solid minerals that settle directly from the atmosphere onto land or into the ocean. |
| food chain | A linear sequence of who eats whom, from primary producers through primary and higher-level consumers. |
| food web | A network of many interconnected feeding relationships among producers and consumers, showing how an ecosystem is linked together. |
| grazing food web | A food web whose primary producers are land plants or water phytoplankton, eaten by grazing consumers; often linked to a detrital food web in the same ecosystem. |
| gross primary productivity | The rate at which photosynthetic producers capture energy from the sun. |
| holistic ecosystem model | A study that tries to measure the composition, interactions and dynamics of an entire ecosystem; often limited by cost and logistics. |
| hydrosphere | The part of Earth where water moves and is stored, such as oceans, lakes, rivers, groundwater and ice. |
| mesocosm | A portion of a natural ecosystem set aside for experiments. |
| microcosm | A re-creation of a natural ecosystem entirely inside a laboratory, used for experiments. |
| net consumer productivity | The energy content available to the organisms of the next trophic level. |
| net primary productivity | The energy left in the primary producers after they use some for respiration and lose some as heat. |
| net production efficiency (NPE) | A measure of how well a trophic level converts the energy it receives from the level below into biomass. |
| non-renewable resource | A resource, such as a fossil fuel, that is replaced very slowly or not at all on a human timescale. |
| primary consumer | A trophic level that gets its energy by eating primary producers. |
| primary producer | A trophic level that gets its energy from sunlight or inorganic chemicals; the source text also includes dead and decaying organic material in this definition. |
| residence time | The average time an individual water molecule stays in one particular reservoir. |
| resilience (ecological) | How quickly an ecosystem returns to equilibrium after being disturbed. |
| resistance (ecological) | An ecosystem’s ability to remain at equilibrium in spite of disturbances. |
| secondary consumer | Usually a carnivore that eats primary consumers. |
| simulation model | A computer-based model of a whole ecosystem, especially a food web, used to predict how disturbances will change its structure and dynamics. |
| subduction | The process in which one tectonic plate moves beneath another. |
| tertiary consumer | A carnivore that eats other carnivores. |
| trophic level | A position in a food chain or food web, occupied by a species or group of species according to how it obtains energy. |
| trophic level transfer efficiency (TLTE) | The efficiency of energy transfer between two successive trophic levels, expressed as a percentage. |
1Avoid these mistakes2Avoid these mistakes3Avoid these mistakes
Avoid these mistakes
1Avoid this
Describing a food chain as a complete picture of an ecosystem. Most organisms eat several kinds of food, so a food web is needed to show the real interactions.Avoid this
2Avoid this
Swapping resistance and resilience. Resistance is staying at equilibrium despite a disturbance; resilience is how fast the ecosystem recovers after it.Avoid this
3Avoid this
Assuming energy is recycled like nutrients. Nutrients cycle through ecosystems, but energy flows one way and is lost as heat at each transfer.Avoid this
1 / 3Next ▶
Avoid these mistakes
4Avoid this
Using microcosm and mesocosm as if they were the same. A microcosm is recreated inside a laboratory; a mesocosm is a portion of a natural ecosystem.Avoid this
5Avoid this
Thinking every ecological pyramid can be inverted. Energy pyramids are always upright, while number and biomass pyramids can be inverted.Avoid this
6Avoid this
Confusing the nitrogen processes. Nitrogen fixation brings nitrogen into organic molecules, nitrification forms nitrites and nitrates, and denitrification returns nitrogen gas to the atmosphere.Avoid this
◀ Previous2 / 3Next ▶
Avoid these mistakes
7Avoid this
Calculating TLTE with the values reversed. Divide the present level’s production by the past level’s production, then multiply by 100; a result above 100% signals a reversed calculation.Avoid this
◀ Previous3 / 3