1.1Motion, Forces and Energy
Photosynthesis — Question Bank (Cambridge) — Cambridge IGCSE Physics 0625 Revision Notes & Topical Questions
5 min read Lesson 2 of 91 Unit quiz
Curriculum Equation Key Balanced Photosynthesis EquationFast Exam Solution
6CO₂ + 6H₂O ➔ C₆H₁₂O₆ + 6O₂
Word Equation & Conditions: Carbon Dioxide + Water (+ Light & Chlorophyll) -> Glucose + Oxygen
Cambridge Past Paper Bank
1.1 Photosynthesis
8 Multiple-Choice Questions with Official Mark Schemes
Question 1
0610/22_Summer_2023_Q12
Question 2
0610/22_Winter_2019_Q10
Question 3
0610/21_Summer_2024_Q10
Question 4
0610/23_Winter_2023_Q12
Question 5
0610/21_Summer_2022_Q12
Question 6
0610/23_Summer_2020_Q11
Question 7
0610/23_Winter_2025_Q10
Question 8
0610/22_Spring_2024_Q13
Cambridge Lower Secondary Stage 9
1.1 Photosynthesis – Complete Question Bank & Mark Scheme
Total Questions8 Questions with Verified Solutions & Past Paper Mark Schemes
Multiple Choice Questions (Exam Practice)
Question 1
Paper Ref: 0610/22_Summer_2023_Q12
Paper Ref: 0610/22_Summer_2023_Q12
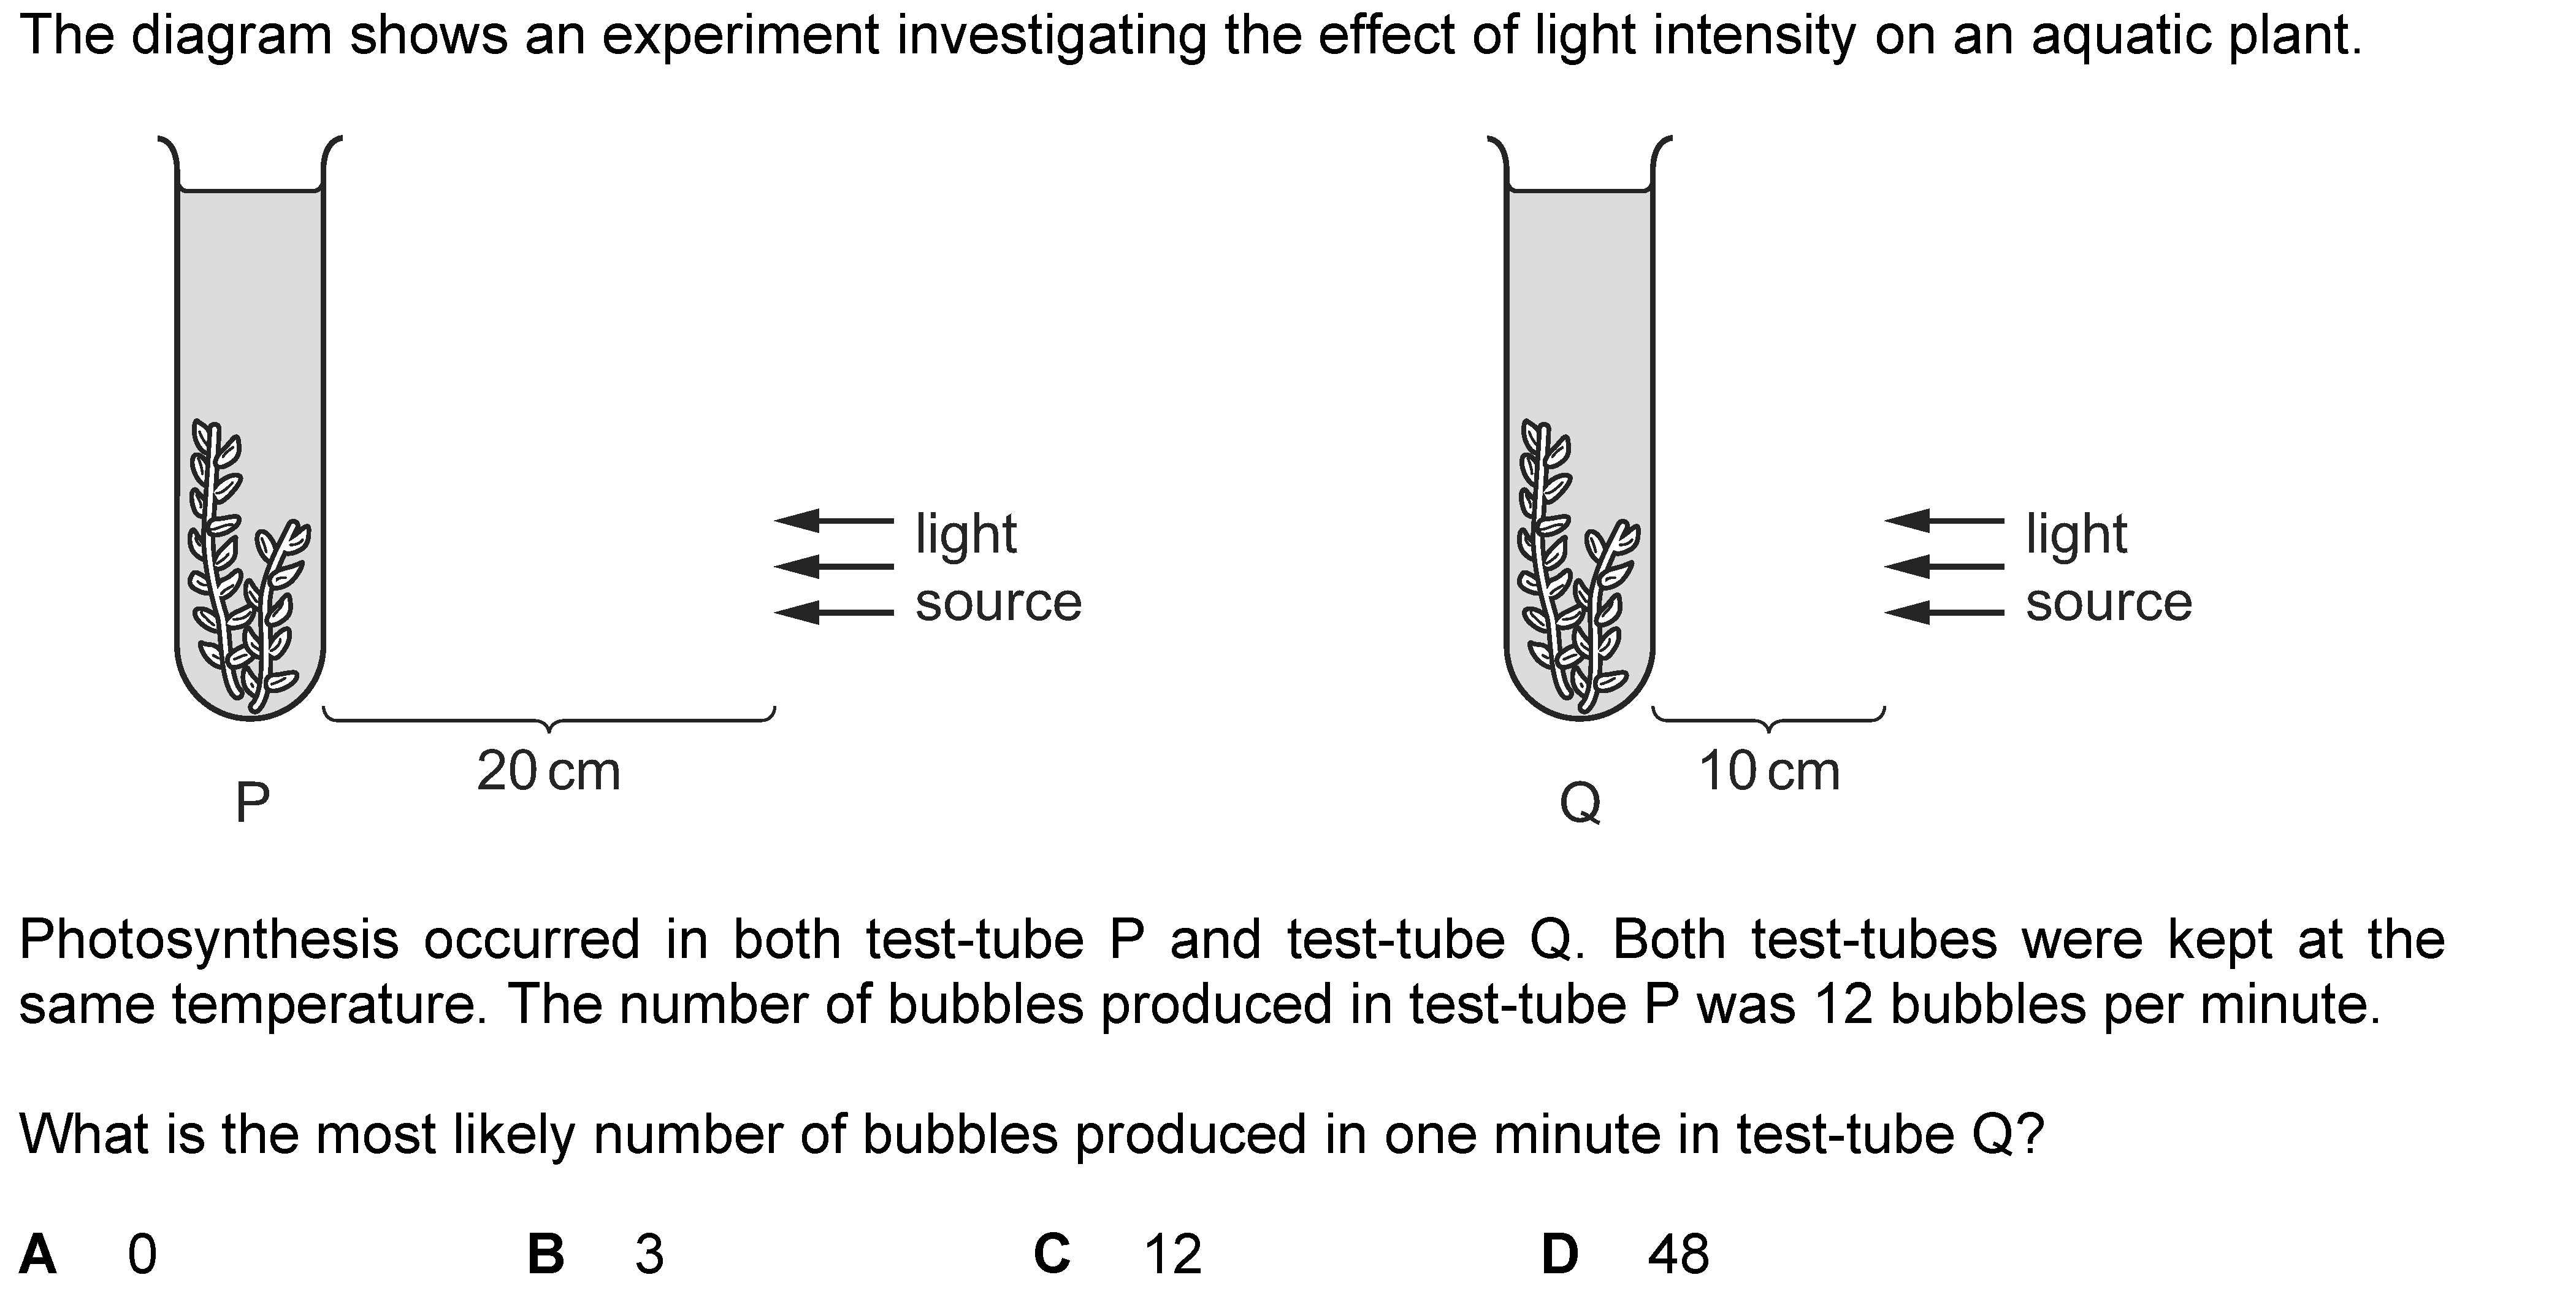
The diagram shows an experiment investigating the effect of light intensity on an aquatic plant.
<— light
<«— SOUICE
Photosynthesis occurred in both test-tube P and test-tube Q. Both test-tubes were kept at the
same temperature. The number of bubbles produced in test-tube P was 12 bubbles per minute.
What is the most likely number of bubbles produced in one minute in test-tube Q?
A 0 B 3 C 12 D 48
Options:
A
B
C
D
Correct Key: C
A
B
C
D
Correct Key: C
Question 2
Paper Ref: 0610/22_Winter_2019_Q10
Paper Ref: 0610/22_Winter_2019_Q10
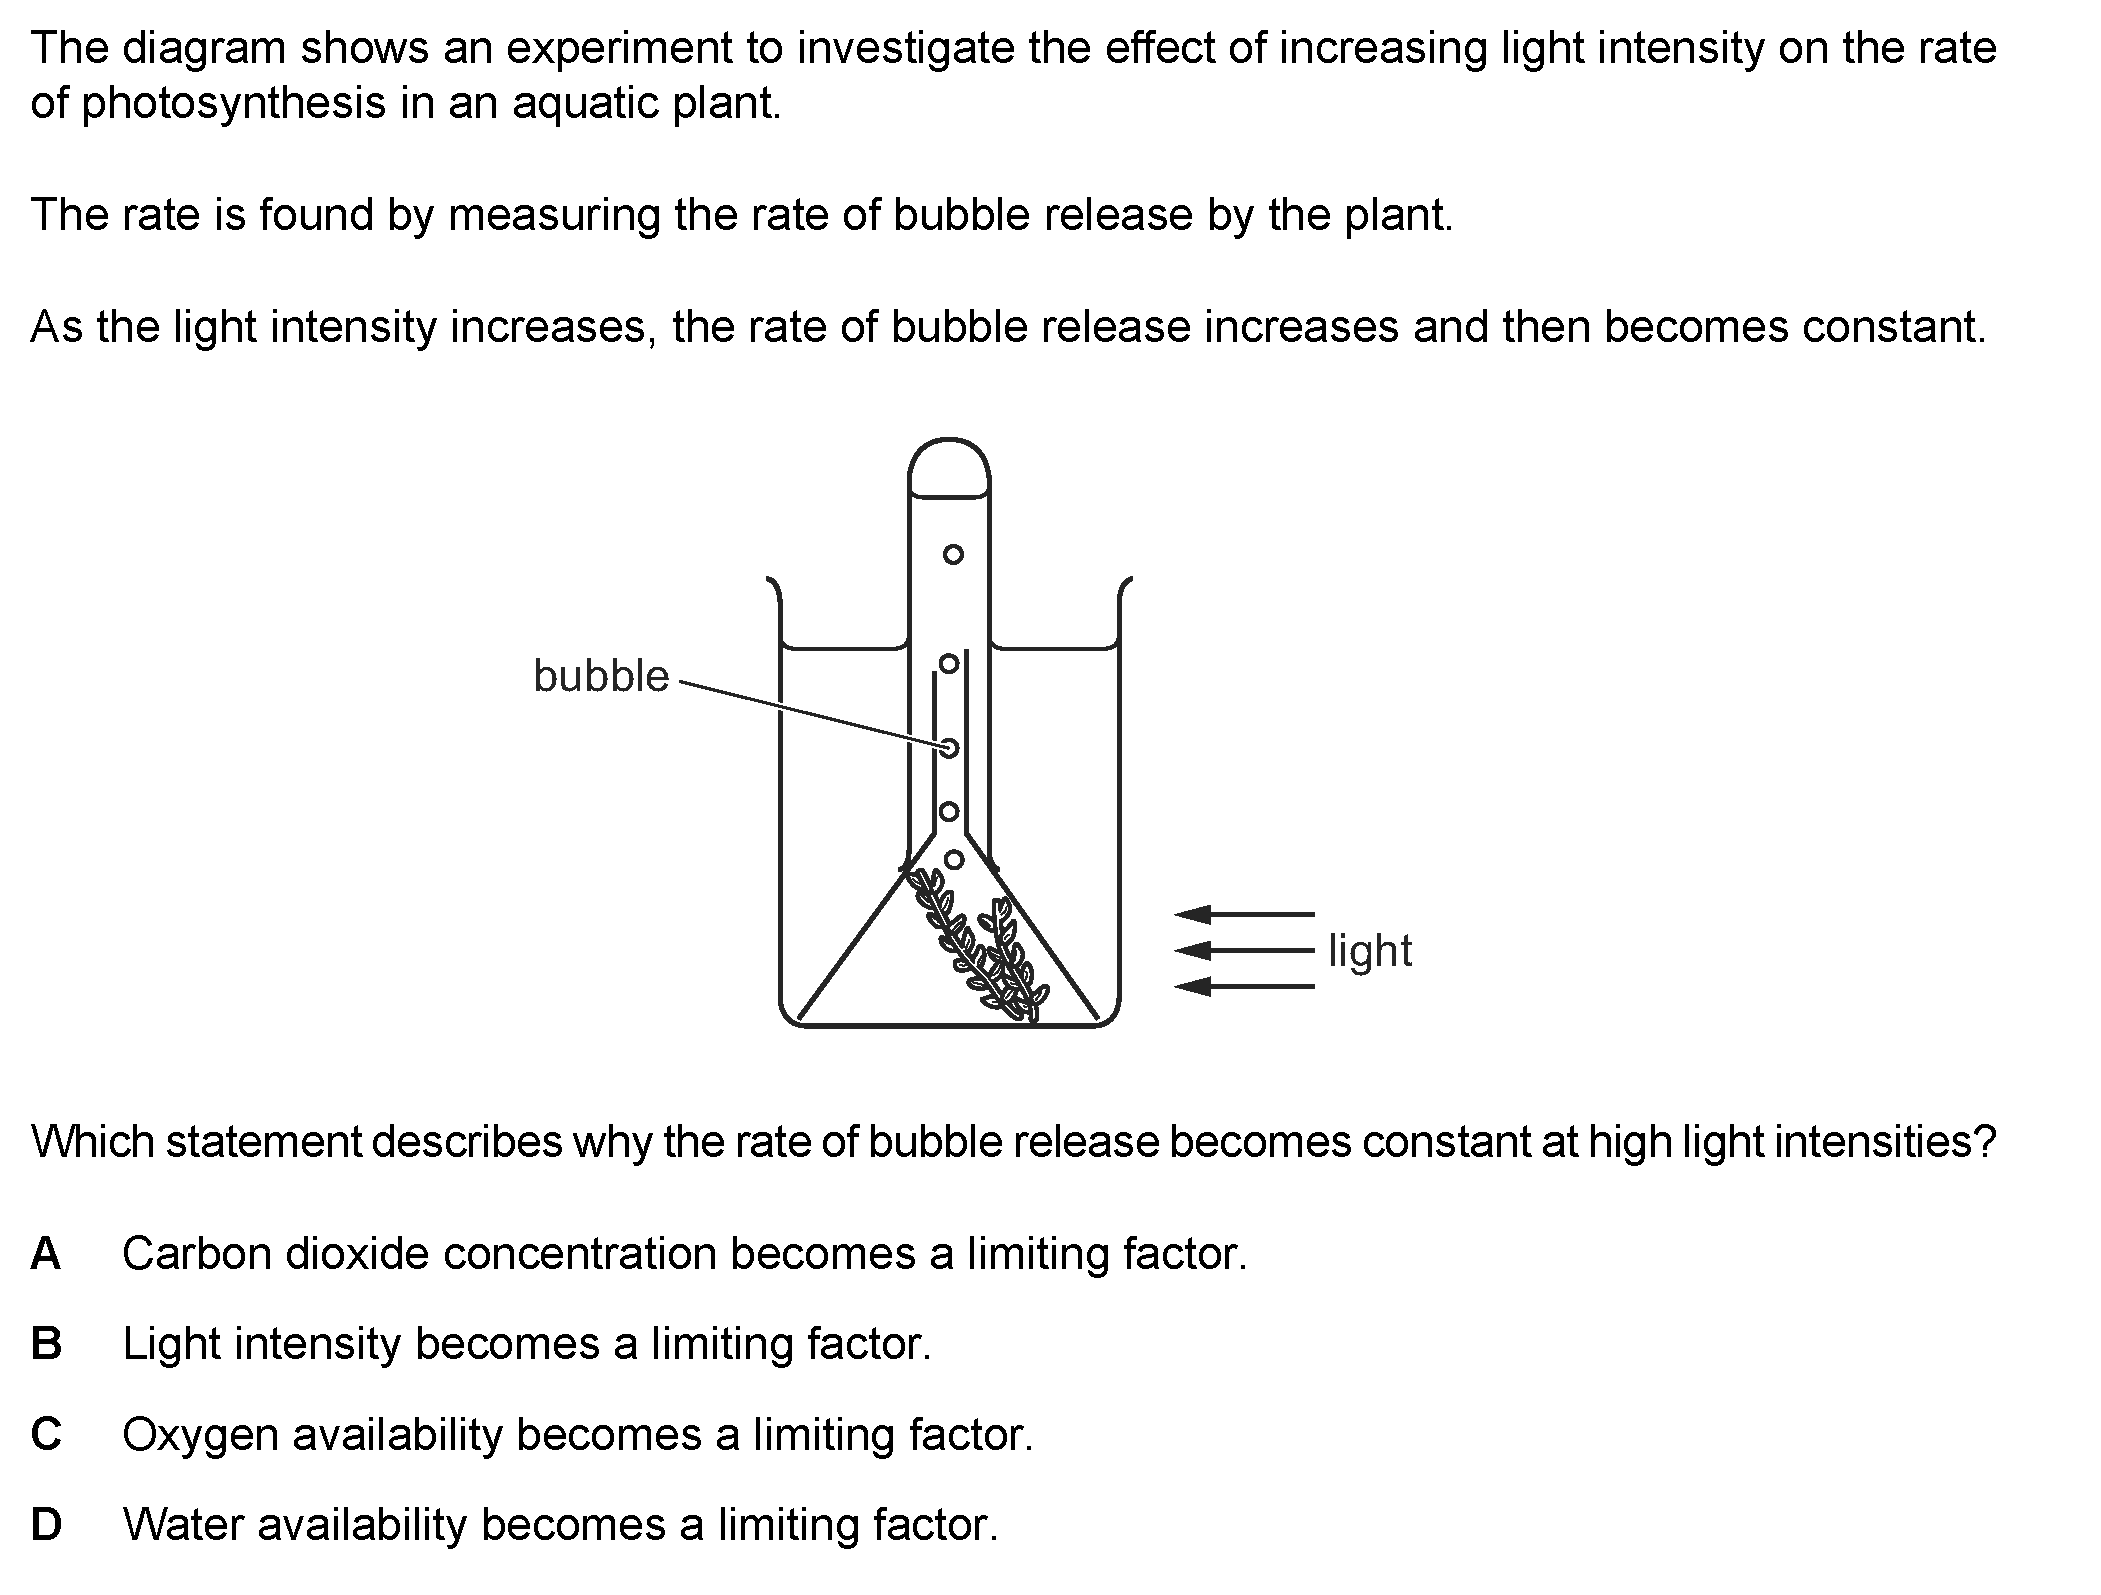
The diagram shows an experiment to investigate the effect of increasing light intensity on the rate
of photosynthesis in an aquatic plant.
The rate is found by measuring the rate of bubble release by the plant.
As the light intensity increases, the rate of bubble release increases and then becomes constant.
Which statement describes why the rate of bubble release becomes constant at high light intensities?
Carbon dioxide concentration becomes a limiting factor.
Light intensity becomes a limiting factor.
Oxygen availability becomes a limiting factor.
0 0O wD FY
Water availability becomes a limiting factor.
Options:
A
B
C
D
Correct Key: D
A
B
C
D
Correct Key: D
Question 3
Paper Ref: 0610/21_Summer_2024_Q10
Paper Ref: 0610/21_Summer_2024_Q10
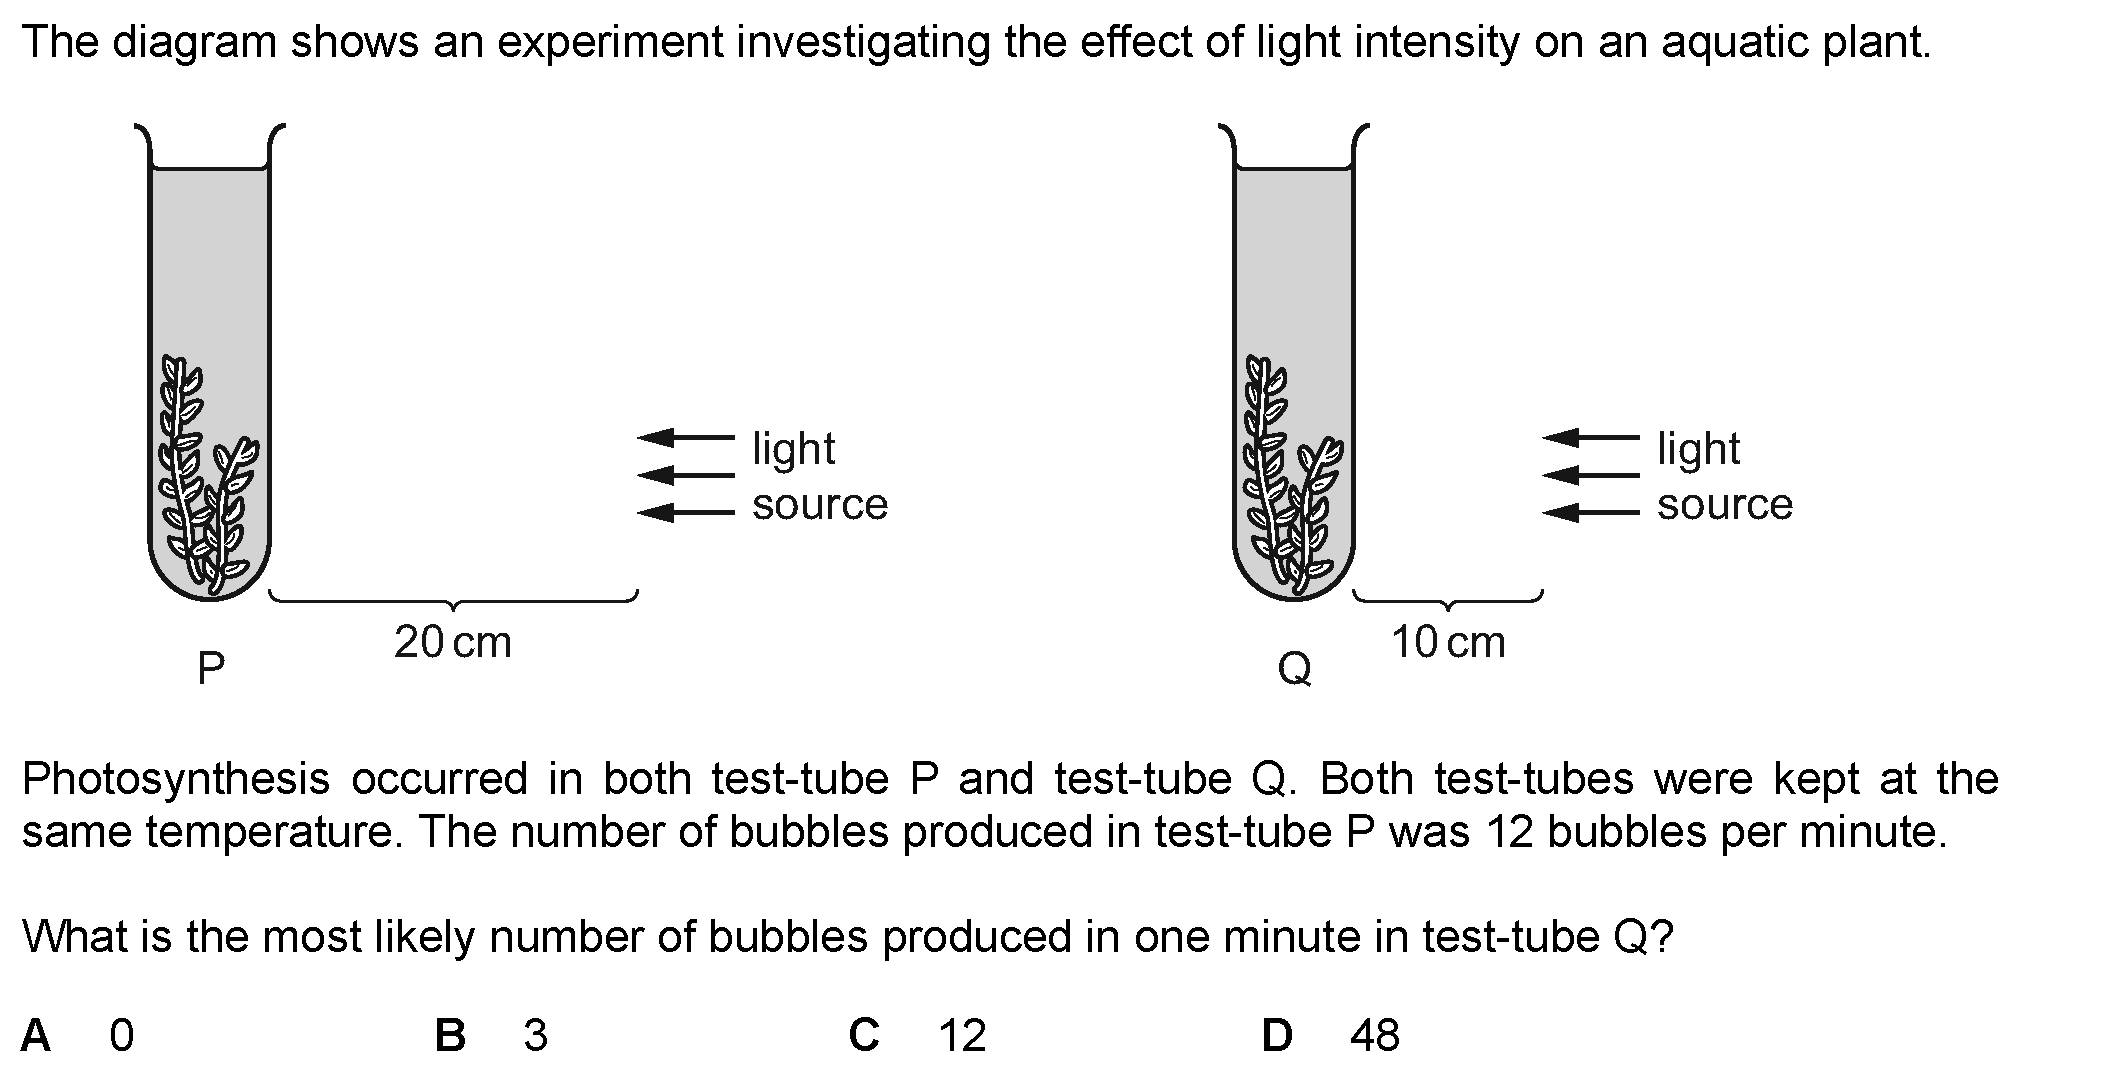
The diagram shows an experiment investigating the effect of light intensity on an aquatic plant.
<— light <— light
~<«— source ~«— source
Photosynthesis occurred in both test-tube P and test-tube Q. Both test-tubes were kept at the
same temperature. The number of bubbles produced in test-tube P was 12 bubbles per minute.
What is the most likely number of bubbles produced in one minute in test-tube Q?
A 0 B 3 C 12 D 48
Options:
A
B
C
D
Correct Key: A
A
B
C
D
Correct Key: A
Question 4
Paper Ref: 0610/23_Winter_2023_Q12
Paper Ref: 0610/23_Winter_2023_Q12
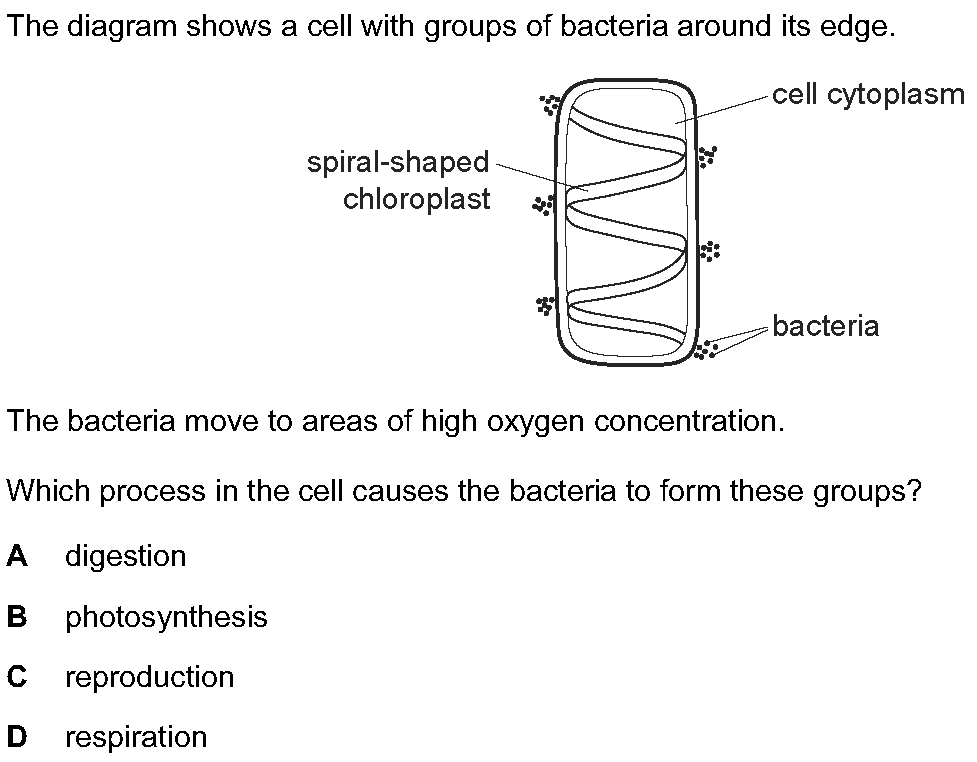
The diagram shows a cell with groups of bacteria around its edge.
cell cytoplasm
spiral-shaped
chloroplast
a bacteria
The bacteria move to areas of high oxygen concentration.
Which process in the cell causes the bacteria to form these groups?
A
B
c
D
digestion
photosynthesis
reproduction
respiration
cell cytoplasm
spiral-shaped
chloroplast
a bacteria
The bacteria move to areas of high oxygen concentration.
Which process in the cell causes the bacteria to form these groups?
A
B
c
D
digestion
photosynthesis
reproduction
respiration
Options:
A
B
C
D
Correct Key: D
A
B
C
D
Correct Key: D
Question 5
Paper Ref: 0610/21_Summer_2022_Q12
Paper Ref: 0610/21_Summer_2022_Q12
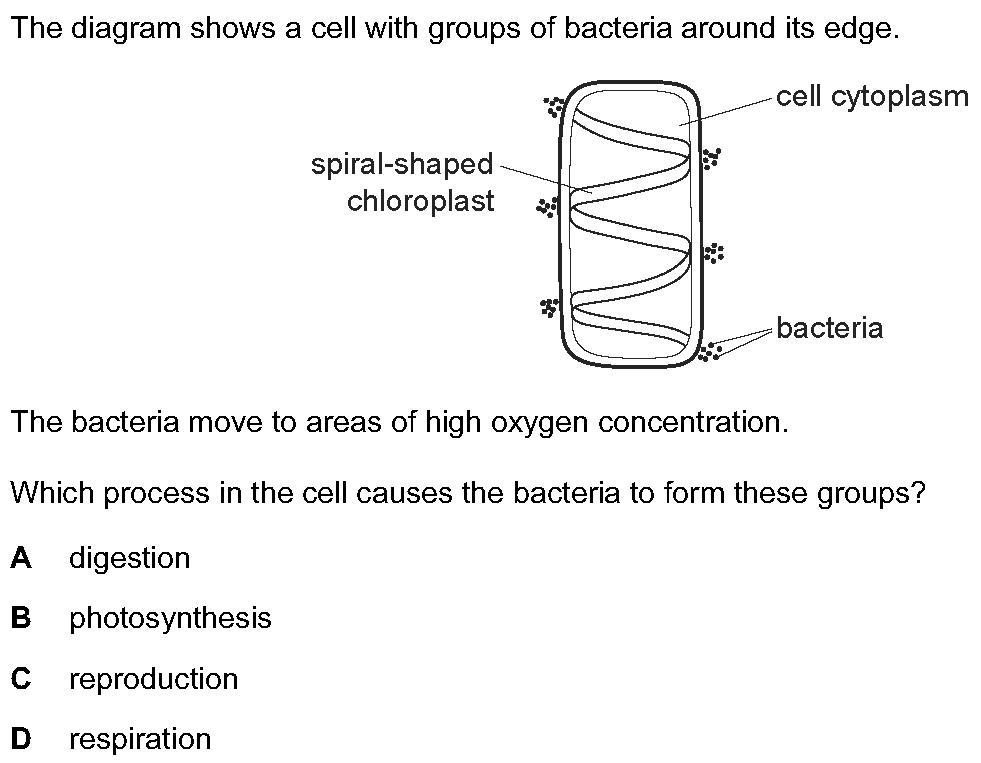
The diagram shows a cell with groups of bacteria around its edge.
cell cytoplasm
spiral-shaped
chloroplast
a bacteria
The bacteria move to areas of high oxygen concentration.
Which process in the cell causes the bacteria to form these groups?
digestion
B photosynthesis
C reproduction
D respiration
cell cytoplasm
spiral-shaped
chloroplast
a bacteria
The bacteria move to areas of high oxygen concentration.
Which process in the cell causes the bacteria to form these groups?
digestion
B photosynthesis
C reproduction
D respiration
Options:
A
B
C
D
Correct Key: B
A
B
C
D
Correct Key: B
Question 6
Paper Ref: 0610/23_Summer_2020_Q11
Paper Ref: 0610/23_Summer_2020_Q11
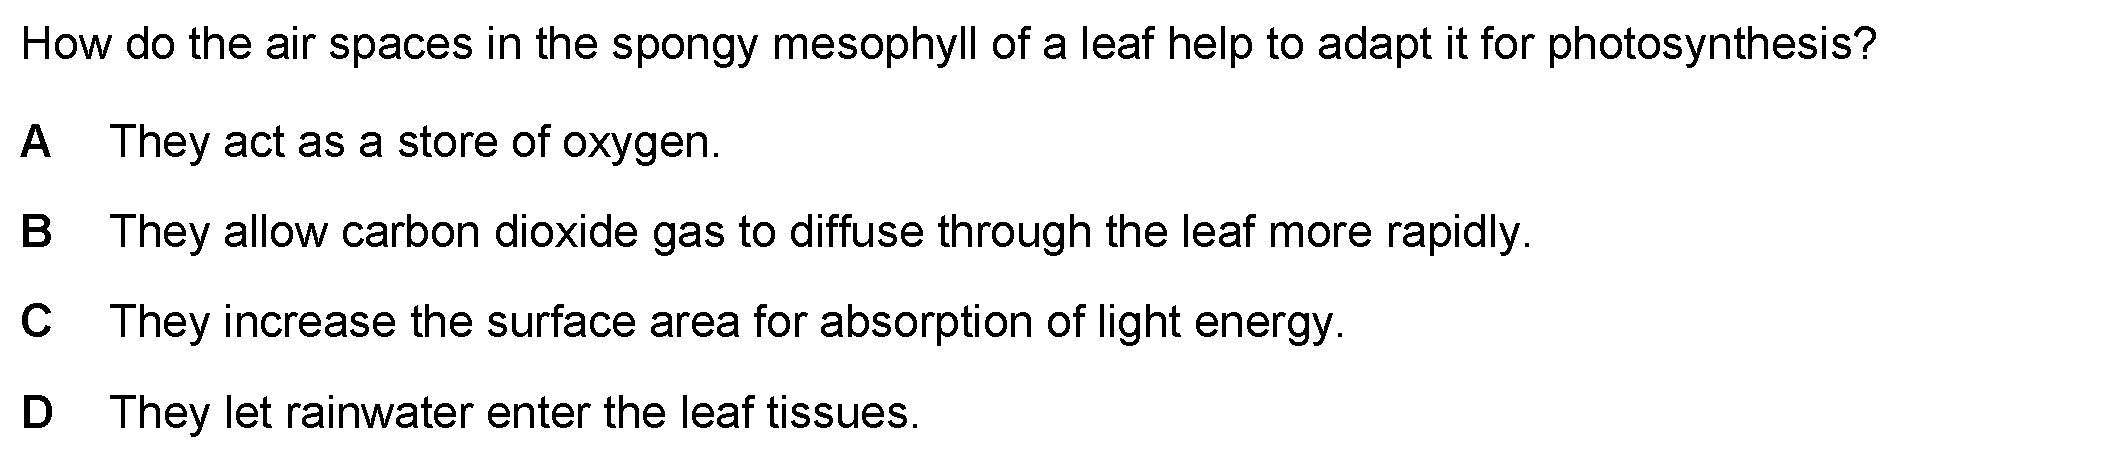
How do the air spaces in the spongy mesophyll of a leaf help to adapt it for photosynthesis?
They act as a store of oxygen.
B- They allow carbon dioxide gas to diffuse through the leaf more rapidly.
C_ They increase the surface area for absorption of light energy.
D_ They let rainwater enter the leaf tissues.
They act as a store of oxygen.
B- They allow carbon dioxide gas to diffuse through the leaf more rapidly.
C_ They increase the surface area for absorption of light energy.
D_ They let rainwater enter the leaf tissues.
Options:
A
B
C
D
Correct Key: C
A
B
C
D
Correct Key: C
Question 7
Paper Ref: 0610/23_Winter_2025_Q10
Paper Ref: 0610/23_Winter_2025_Q10
Which process does not release carbon dioxide to the atmosphere?
oO W
decomposition of animals
photosynthesis of plants
respiration of animals
respiration of plants
oO W
decomposition of animals
photosynthesis of plants
respiration of animals
respiration of plants
Options:
A
B
C
D
Correct Key: B
A
B
C
D
Correct Key: B
Question 8
Paper Ref: 0610/22_Spring_2024_Q13
Paper Ref: 0610/22_Spring_2024_Q13
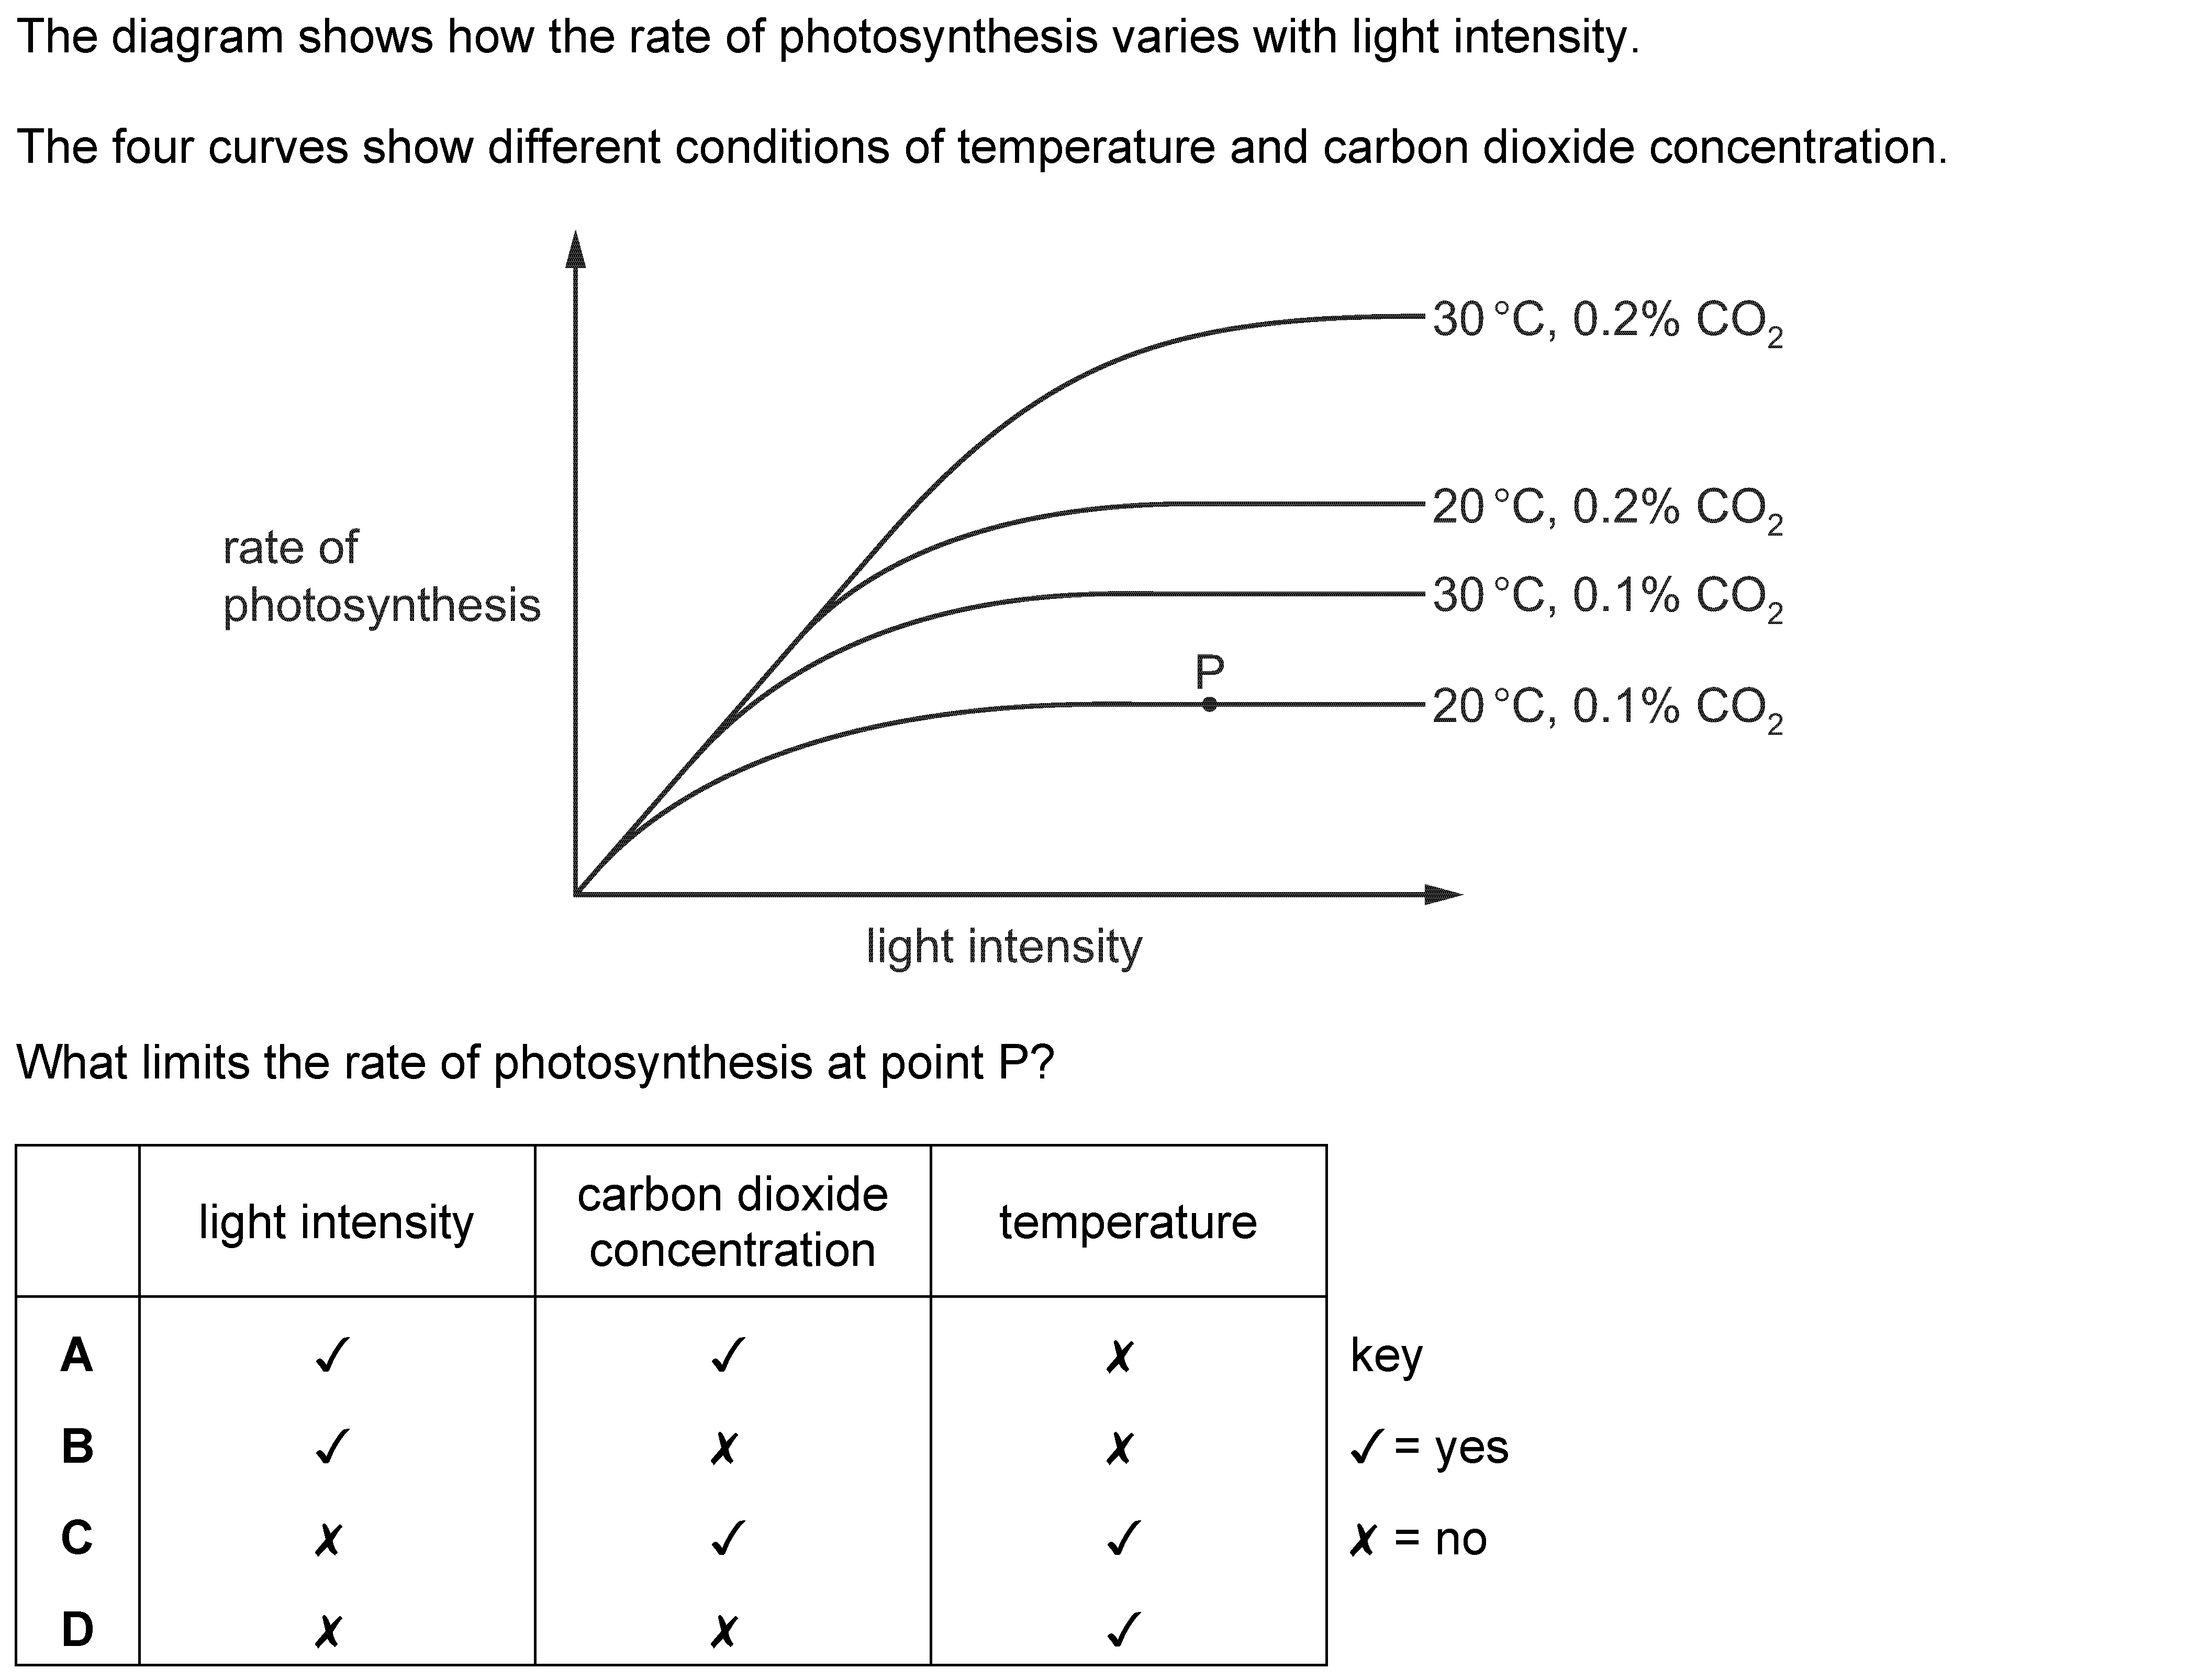
The diagram shows how the rate of photosynthesis varies with light intensity.
The four curves show different conditions of temperature and carbon dioxide concentration.
30°C, 0.2% CO,
te of 20°C, 0.2% CO,
rate o
photosynthesis 30°C, 0.1% CO,
20°C, 0.1% CO,
light intensity
What limits the rate of photosynthesis at point P?
carbon dioxide
light intensity temperature
concentration
A
J key
x /=yes
J xX =no
x
Options:
A
B
C
D
Correct Key: C
A
B
C
D
Correct Key: C
Structured Questions Mark Scheme & Answers
•1•.• • • •[•P•R•I• •2•0•0•9••• •P•1• • •·• • •Q•1• • •P•a•r•t• •(•a•)• • •·• • •2•0•0•9• • •·• • •P•r•i•m•a•r•y• •0•8•4•6•]• • • • • • •(•n•o• •p•u•b•l•i•s•h•e•d• •m•a•r•k• •s•c•h•e•m•e• •f•o•r• •t•h•i•s• •p•a•p•e•r•)•
•2•.• • • •[•P•R•I• •2•0•0•9••• •P•1• • •·• • •Q•1• • •P•a•r•t• •(•b•)• • •·• • •2•0•0•9• • •·• • •P•r•i•m•a•r•y• •0•8•4•6•]• • • • • • •(•n•o• •p•u•b•l•i•s•h•e•d• •m•a•r•k• •s•c•h•e•m•e• •f•o•r• •t•h•i•s• •p•a•p•e•r•)•
•3•.• • • •[•P•R•I• •2•0•0•9••• •P•1• • •·• • •Q•1•3• • •P•a•r•t• •(•a•)• • •·• • •2•0•0•9• • •·• • •P•r•i•m•a•r•y• •0•8•4•6•]• • • • • • •(•n•o• •p•u•b•l•i•s•h•e•d• •m•a•r•k• •s•c•h•e•m•e• •f•o•r• •t•h•i•s• •p•a•p•e•r•)•
•4•.• • • •[•P•R•I• •2•0•1•4•B• •P•2• • •·• • •Q•5• • •P•a•r•t• •(•a•)• • •·• • •2•0•1•4• • •·• • •P•r•i•m•a•r•y• •0•8•4•6•]• • • • • • •(•n•o• •p•u•b•l•i•s•h•e•d• •m•a•r•k• •s•c•h•e•m•e• •f•o•r• •t•h•i•s• •p•a•p•e•r•)•
•5•.• • • •[•P•R•I• •2•0•1•4•B• •P•2• • •·• • •Q•5• • •P•a•r•t• •(•b•)• • •·• • •2•0•1•4• • •·• • •P•r•i•m•a•r•y• •0•8•4•6•]• • • • • • •(•n•o• •p•u•b•l•i•s•h•e•d• •m•a•r•k• •s•c•h•e•m•e• •f•o•r• •t•h•i•s• •p•a•p•e•r•)•
•6•.• • • •[•P•R•I• •2•0•1•4•B• •P•2• • •·• • •Q•5• • •P•a•r•t• •(•c•)• • •·• • •2•0•1•4• • •·• • •P•r•i•m•a•r•y• •0•8•4•6•]• • • • • • •(•n•o• •p•u•b•l•i•s•h•e•d• •m•a•r•k• •s•c•h•e•m•e• •f•o•r• •t•h•i•s• •p•a•p•e•r•)•
•7•.• • • •[•P•R•I• •2•0•1•4•B• •P•2• • •·• • •Q•5• • •P•a•r•t• •(•d•)• • •·• • •2•0•1•4• • •·• • •P•r•i•m•a•r•y• •0•8•4•6•]• • • • • • •(•n•o• •p•u•b•l•i•s•h•e•d• •m•a•r•k• •s•c•h•e•m•e• •f•o•r• •t•h•i•s• •p•a•p•e•r•)•
•8•.• • • •[•P•R•I• •2•0•1•8•C• •P•1• • •·• • •Q•6• • •P•a•r•t• •(•a•)• • •·• • •2•0•1•8• • •·• • •P•r•i•m•a•r•y• •0•8•4•6•]• • • • • • •(•n•o•)• •2• •n•o• •m•a•r•k• •f•o•r• •a•n•s•w•e•r• •n•o•,• •b•u•t• •n•e•e•d•s• •t•o• •b•e• •c•o•r•r•e•c•t• •f•o•r• •m•a•r•k•s• •t•o• •b•e• •a•w•a•r•d•e•d• •••s•s•e•m•b•l•e•d• •b•y• •N•.•S•.• •a•n•y• •t•w•o• •o•f• •s•e•e•d•s• •i•n• •B• •w•i•l•l• •(•a•l•s•o•)• •g•e•r•m•i•n•a•t•e• •••c•c•e•p•t• •g•r•o•w• •f•o•r• •g•e•r•m•i•n•a•t•e• •(•b•e•c•a•u•s•e•)• •s•e•e•d•s• •n•e•e•d• •w•a•t•e•r• •o•r• •m•o•i•s•t•u•r•e• •t•o• •g•e•r•m•i•n•a•t•e• •(•b•u•t•)• •s•e•e•d•s• •d•o• •n•o•t• •n•e•e•d• •l•i•g•h•t• •t•o• •g•e•r•m•i•n•a•t•e• •(•i•d•e•a• •t•h•a•t•)• •s•e•e•d•s• •n•e•e•d• •w•a•r•m•t•h• •t•o• •g•e•r•m•i•n•a•t•e• •/• •i•t• •i•s• •(•t•o•o•)• •c•o•l•d• •(•i•n• •1• •••c•c•e•p•t• •s•e•e•d•s• •n•e•e•d• •t•h•e• •r•i•g•h•t• •o•r• •s•u•i•t•a•b•l•e• •t•e•m•p•e•r•a•t•u•r•e• •w•i•n•t•e•r•)• •t•o• •g•e•r•m•i•n•a•t•e• •D•o• •n•o•t• •a•c•c•e•p•t• •t•h•e•r•e• •i•s• •l•e•s•s• •(•s•u•n•)•l•i•g•h•t• •/• •n•o• •(•s•u•n•)•l•i•g•h•t•
Last updated:
Biology 0610 & 9700 Exam Model
Limiting Factors Master
Photosynthesis: Limiting Factors & Graph Plateau
6CO2 + 6H2O → C6H12O6 + 6O2 (Light & Chlorophyll required)
- Limiting Factor Definition: Something present in the environment in such short supply that it restricts life processes.
- Graph Plateau: When rate levels off as light intensity increases, light is no longer the limiting factor; CO2 concentration or temperature has become limiting.
- High Temperature Drop: Beyond optimum temp (~40°C), enzymes (e.g. RuBisCO) denature, permanently decreasing rate.