Curriculum
College Physics for AP Courses 2e
Unit 1: Introduction: The Nature of Science and Physics
0/10
-
Unit 1 overview: Introduction: The Nature of Science and Physics
 Text lessonPreview
-
1.1 Physics: An Introduction
Text lessonPreview
-
1.1 Physics: An Introduction - Check yourself
 6 questionsPreview
-
1.2 Physical Quantities and Units
Text lessonPreview
-
1.2 Physical Quantities and Units - Check yourself
6 questionsPreview
-
1.3 Accuracy, Precision, and Significant Figures
Text lessonPreview
-
1.3 Accuracy, Precision, and Significant Figures - Check yourself
6 questionsPreview
-
1.4 Approximation
Text lessonPreview
-
1.4 Approximation - Check yourself
6 questionsPreview
-
Unit 1 review quiz: Introduction: The Nature of Science and Physics
10 questionsPreview
Unit 2: Kinematics
0/18
-
Unit 2 overview: Kinematics
Text lessonPreview
-
2.1 Displacement
Text lessonPreview
-
2.1 Displacement - Check yourself
6 questionsPreview
-
2.2 Vectors, Scalars, and Coordinate Systems
Text lessonPreview
-
2.2 Vectors, Scalars, and Coordinate Systems - Check yourself
6 questionsPreview
-
2.3 Time, Velocity, and Speed
Text lessonPreview
-
2.3 Time, Velocity, and Speed - Check yourself
6 questionsPreview
-
2.4 Acceleration
Text lessonPreview
-
2.4 Acceleration - Check yourself
6 questionsPreview
-
2.5 Motion Equations for Constant Acceleration in One Dimension
Text lessonPreview
-
2.5 Motion Equations for Constant Acceleration in One Dimension - Check yourself
6 questionsPreview
-
2.6 Problem-Solving Basics for One-Dimensional Kinematics
Text lessonPreview
-
2.6 Problem-Solving Basics for One-Dimensional Kinematics - Check yourself
6 questionsPreview
-
2.7 Falling Objects
Text lessonPreview
-
2.7 Falling Objects - Check yourself
6 questionsPreview
-
2.8 Graphical Analysis of One-Dimensional Motion
Text lessonPreview
-
2.8 Graphical Analysis of One-Dimensional Motion - Check yourself
6 questionsPreview
-
Unit 2 review quiz: Kinematics
10 questionsPreview
Unit 3: Two-Dimensional Kinematics
0/12
-
Unit 3 overview: Two-Dimensional Kinematics
Text lessonPreview
-
3.1 Kinematics in Two Dimensions: An Introduction
Text lessonPreview
-
3.1 Kinematics in Two Dimensions: An Introduction - Check yourself
6 questionsPreview
-
3.2 Vector Addition and Subtraction: Graphical Methods
Text lessonPreview
-
3.2 Vector Addition and Subtraction: Graphical Methods - Check yourself
6 questionsPreview
-
3.3 Vector Addition and Subtraction: Analytical Methods
Text lessonPreview
-
3.3 Vector Addition and Subtraction: Analytical Methods - Check yourself
6 questionsPreview
-
3.4 Projectile Motion
Text lessonPreview
-
3.4 Projectile Motion - Check yourself
6 questionsPreview
-
3.5 Addition of Velocities
Text lessonPreview
-
3.5 Addition of Velocities - Check yourself
6 questionsPreview
-
Unit 3 review quiz: Two-Dimensional Kinematics
10 questionsPreview
Unit 4: Dynamics: Force and Newton's Laws of Motion
0/18
-
Unit 4 overview: Dynamics: Force and Newton's Laws of Motion
Text lessonPreview
-
4.1 Development of Force Concept
Text lessonPreview
-
4.1 Development of Force Concept - Check yourself
6 questionsPreview
-
4.2 Newton’s First Law of Motion: Inertia
Text lessonPreview
-
4.2 Newton’s First Law of Motion: Inertia - Check yourself
6 questionsPreview
-
4.3 Newton’s Second Law of Motion: Concept of a System
Text lessonPreview
-
4.3 Newton’s Second Law of Motion: Concept of a System - Check yourself
6 questionsPreview
-
4.4 Newton’s Third Law of Motion: Symmetry in Forces
Text lessonPreview
-
4.4 Newton’s Third Law of Motion: Symmetry in Forces - Check yourself
6 questionsPreview
-
4.5 Normal, Tension, and Other Examples of Forces
Text lessonPreview
-
4.5 Normal, Tension, and Other Examples of Forces - Check yourself
6 questionsPreview
-
4.6 Problem-Solving Strategies
Text lessonPreview
-
4.6 Problem-Solving Strategies - Check yourself
6 questionsPreview
-
4.7 Further Applications of Newton’s Laws of Motion
Text lessonPreview
-
4.7 Further Applications of Newton’s Laws of Motion - Check yourself
6 questionsPreview
-
4.8 Extended Topic: The Four Basic Forces—An Introduction
Text lessonPreview
-
4.8 Extended Topic: The Four Basic Forces—An Introduction - Check yourself
6 questionsPreview
-
Unit 4 review quiz: Dynamics: Force and Newton's Laws of Motion
10 questionsPreview
Unit 5: Further Applications of Newton's Laws: Friction, Drag, and Elasticity
0/8
-
Unit 5 overview: Further Applications of Newton's Laws: Friction, Drag, and Elasticity
Text lessonPreview
-
5.1 Friction
Text lessonPreview
-
5.1 Friction - Check yourself
6 questionsPreview
-
5.2 Drag Forces
Text lessonPreview
-
5.2 Drag Forces - Check yourself
6 questionsPreview
-
5.3 Elasticity: Stress and Strain
Text lessonPreview
-
5.3 Elasticity: Stress and Strain - Check yourself
6 questionsPreview
-
Unit 5 review quiz: Further Applications of Newton's Laws: Friction, Drag, and Elasticity
10 questionsPreview
Unit 6: Uniform Circular Motion and Gravitation
0/14
-
Unit 6 overview: Uniform Circular Motion and Gravitation
Text lessonPreview
-
6.1 Rotation Angle and Angular Velocity
Text lessonPreview
-
6.1 Rotation Angle and Angular Velocity - Check yourself
6 questionsPreview
-
6.2 Centripetal Acceleration
Text lessonPreview
-
6.2 Centripetal Acceleration - Check yourself
6 questionsPreview
-
6.3 Centripetal Force
Text lessonPreview
-
6.3 Centripetal Force - Check yourself
6 questionsPreview
-
6.4 Fictitious Forces and Non-inertial Frames: The Coriolis Force
Text lessonPreview
-
6.4 Fictitious Forces and Non-inertial Frames: The Coriolis Force - Check yourself
6 questionsPreview
-
6.5 Newton’s Universal Law of Gravitation
Text lessonPreview
-
6.5 Newton’s Universal Law of Gravitation - Check yourself
6 questionsPreview
-
6.6 Satellites and Kepler’s Laws: An Argument for Simplicity
Text lessonPreview
-
6.6 Satellites and Kepler’s Laws: An Argument for Simplicity - Check yourself
6 questionsPreview
-
Unit 6 review quiz: Uniform Circular Motion and Gravitation
10 questionsPreview
Unit 7: Work, Energy, and Energy Resources
0/20
-
Unit 7 overview: Work, Energy, and Energy Resources
Text lessonPreview
-
7.1 Work: The Scientific Definition
Text lessonPreview
-
7.1 Work: The Scientific Definition - Check yourself
6 questionsPreview
-
7.2 Kinetic Energy and the Work-Energy Theorem
Text lessonPreview
-
7.2 Kinetic Energy and the Work-Energy Theorem - Check yourself
6 questionsPreview
-
7.3 Gravitational Potential Energy
Text lessonPreview
-
7.3 Gravitational Potential Energy - Check yourself
6 questionsPreview
-
7.4 Conservative Forces and Potential Energy
Text lessonPreview
-
7.4 Conservative Forces and Potential Energy - Check yourself
6 questionsPreview
-
7.5 Nonconservative Forces
Text lessonPreview
-
7.5 Nonconservative Forces - Check yourself
6 questionsPreview
-
7.6 Conservation of Energy
Text lessonPreview
-
7.6 Conservation of Energy - Check yourself
6 questionsPreview
-
7.7 Power
Text lessonPreview
-
7.7 Power - Check yourself
6 questionsPreview
-
7.8 Work, Energy, and Power in Humans
Text lessonPreview
-
7.8 Work, Energy, and Power in Humans - Check yourself
6 questionsPreview
-
7.9 World Energy Use
Text lessonPreview
-
7.9 World Energy Use - Check yourself
6 questionsPreview
-
Unit 7 review quiz: Work, Energy, and Energy Resources
10 questionsPreview
Unit 8: Linear Momentum and Collisions
0/32
-
Unit 8 overview: Linear Momentum and Collisions
Text lessonPreview
-
8.1 Linear Momentum and Force
Text lessonPreview
-
8.1 Linear Momentum and Force - Check yourself
6 questionsPreview
-
8.1 Linear Momentum and Force
Text lessonPreview
-
8.1 Linear Momentum and Force - Check yourself
6 questionsPreview
-
8.2 Impulse
Text lessonPreview
-
8.2 Impulse - Check yourself
6 questionsPreview
-
8.2 Impulse
Text lessonPreview
-
8.2 Impulse - Check yourself
6 questionsPreview
-
8.3 Conservation of Momentum
Text lessonPreview
-
8.3 Conservation of Momentum - Check yourself
6 questionsPreview
-
8.3 Conservation of Momentum
Text lessonPreview
-
8.3 Conservation of Momentum - Check yourself
6 questionsPreview
-
8.4 Elastic Collisions in One Dimension
Text lessonPreview
-
8.4 Elastic Collisions in One Dimension - Check yourself
6 questionsPreview
-
Unit 8 review quiz: Linear Momentum and Collisions
10 questionsPreview
-
Unit 8 overview: Linear Momentum and Collisions
Text lessonPreview
-
8.4 Elastic Collisions in One Dimension
Text lessonPreview
-
8.4 Elastic Collisions in One Dimension - Check yourself
6 questionsPreview
-
8.5 Inelastic Collisions in One Dimension
Text lessonPreview
-
8.5 Inelastic Collisions in One Dimension - Check yourself
6 questionsPreview
-
8.5 Inelastic Collisions in One Dimension
Text lessonPreview
-
8.5 Inelastic Collisions in One Dimension - Check yourself
6 questionsPreview
-
8.6 Collisions of Point Masses in Two Dimensions
Text lessonPreview
-
8.6 Collisions of Point Masses in Two Dimensions - Check yourself
6 questionsPreview
-
8.6 Collisions of Point Masses in Two Dimensions
Text lessonPreview
-
8.6 Collisions of Point Masses in Two Dimensions - Check yourself
6 questionsPreview
-
8.7 Introduction to Rocket Propulsion
Text lessonPreview
-
8.7 Introduction to Rocket Propulsion - Check yourself
6 questionsPreview
-
8.7 Introduction to Rocket Propulsion
Text lessonPreview
-
8.7 Introduction to Rocket Propulsion - Check yourself
6 questionsPreview
-
Unit 8 review quiz: Linear Momentum and Collisions
10 questionsPreview
Unit 9: Statics and Torque
0/28
-
Unit 9 overview: Statics and Torque
Text lessonPreview
-
9.1 The First Condition for Equilibrium
Text lessonPreview
-
9.1 The First Condition for Equilibrium - Check yourself
6 questionsPreview
-
9.1 The First Condition for Equilibrium
Text lessonPreview
-
9.1 The First Condition for Equilibrium - Check yourself
6 questionsPreview
-
9.2 The Second Condition for Equilibrium
Text lessonPreview
-
9.2 The Second Condition for Equilibrium - Check yourself
6 questionsPreview
-
9.2 The Second Condition for Equilibrium
Text lessonPreview
-
9.2 The Second Condition for Equilibrium - Check yourself
6 questionsPreview
-
9.3 Stability
Text lessonPreview
-
9.3 Stability - Check yourself
6 questionsPreview
-
9.3 Stability
Text lessonPreview
-
9.3 Stability - Check yourself
6 questionsPreview
-
Unit 9 review quiz: Statics and Torque
10 questionsPreview
-
Unit 9 overview: Statics and Torque
Text lessonPreview
-
9.4 Applications of Statics, Including Problem-Solving Strategies
Text lessonPreview
-
9.4 Applications of Statics, Including Problem-Solving Strategies - Check yourself
6 questionsPreview
-
9.4 Applications of Statics, Including Problem-Solving Strategies
Text lessonPreview
-
9.4 Applications of Statics, Including Problem-Solving Strategies - Check yourself
6 questionsPreview
-
9.5 Simple Machines
Text lessonPreview
-
9.5 Simple Machines - Check yourself
6 questionsPreview
-
9.5 Simple Machines
Text lessonPreview
-
9.5 Simple Machines - Check yourself
6 questionsPreview
-
9.6 Forces and Torques in Muscles and Joints
Text lessonPreview
-
9.6 Forces and Torques in Muscles and Joints - Check yourself
6 questionsPreview
-
9.6 Forces and Torques in Muscles and Joints
Text lessonPreview
-
9.6 Forces and Torques in Muscles and Joints - Check yourself
6 questionsPreview
-
Unit 9 review quiz: Statics and Torque
10 questionsPreview
Unit 10: Rotational Motion and Angular Momentum
0/32
-
Unit 10 overview: Rotational Motion and Angular Momentum
Text lessonPreview
-
10.1 Angular Acceleration
Text lessonPreview
-
10.1 Angular Acceleration - Check yourself
6 questionsPreview
-
10.1 Angular Acceleration
Text lessonPreview
-
10.1 Angular Acceleration - Check yourself
6 questionsPreview
-
10.2 Kinematics of Rotational Motion
Text lessonPreview
-
10.2 Kinematics of Rotational Motion - Check yourself
6 questionsPreview
-
10.2 Kinematics of Rotational Motion
Text lessonPreview
-
10.2 Kinematics of Rotational Motion - Check yourself
6 questionsPreview
-
10.3 Dynamics of Rotational Motion: Rotational Inertia
Text lessonPreview
-
10.3 Dynamics of Rotational Motion: Rotational Inertia - Check yourself
6 questionsPreview
-
10.3 Dynamics of Rotational Motion: Rotational Inertia
Text lessonPreview
-
10.3 Dynamics of Rotational Motion: Rotational Inertia - Check yourself
6 questionsPreview
-
10.4 Rotational Kinetic Energy: Work and Energy Revisited
Text lessonPreview
-
10.4 Rotational Kinetic Energy: Work and Energy Revisited - Check yourself
6 questionsPreview
-
Unit 10 review quiz: Rotational Motion and Angular Momentum
10 questionsPreview
-
Unit 10 overview: Rotational Motion and Angular Momentum
Text lessonPreview
-
10.4 Rotational Kinetic Energy: Work and Energy Revisited
Text lessonPreview
-
10.4 Rotational Kinetic Energy: Work and Energy Revisited - Check yourself
6 questionsPreview
-
10.5 Angular Momentum and Its Conservation
Text lessonPreview
-
10.5 Angular Momentum and Its Conservation - Check yourself
6 questionsPreview
-
10.5 Angular Momentum and Its Conservation
Text lessonPreview
-
10.5 Angular Momentum and Its Conservation - Check yourself
6 questionsPreview
-
10.6 Collisions of Extended Bodies in Two Dimensions
Text lessonPreview
-
10.6 Collisions of Extended Bodies in Two Dimensions - Check yourself
6 questionsPreview
-
10.6 Collisions of Extended Bodies in Two Dimensions
Text lessonPreview
-
10.6 Collisions of Extended Bodies in Two Dimensions - Check yourself
6 questionsPreview
-
10.7 Gyroscopic Effects: Vector Aspects of Angular Momentum
Text lessonPreview
-
10.7 Gyroscopic Effects: Vector Aspects of Angular Momentum - Check yourself
6 questionsPreview
-
10.7 Gyroscopic Effects: Vector Aspects of Angular Momentum
Text lessonPreview
-
10.7 Gyroscopic Effects: Vector Aspects of Angular Momentum - Check yourself
6 questionsPreview
-
Unit 10 review quiz: Rotational Motion and Angular Momentum
10 questionsPreview
Unit 11: Fluid Statics
0/40
-
Unit 11 overview: Fluid Statics
Text lessonPreview
-
11.1 What Is a Fluid?
Text lessonPreview
-
11.1 What Is a Fluid? - Check yourself
6 questionsPreview
-
11.1 What Is a Fluid?
Text lessonPreview
-
11.1 What Is a Fluid? - Check yourself
6 questionsPreview
-
11.2 Density
Text lessonPreview
-
11.2 Density - Check yourself
6 questionsPreview
-
11.2 Density
Text lessonPreview
-
11.2 Density - Check yourself
6 questionsPreview
-
11.3 Pressure
Text lessonPreview
-
11.3 Pressure - Check yourself
6 questionsPreview
-
11.3 Pressure
Text lessonPreview
-
11.3 Pressure - Check yourself
6 questionsPreview
-
11.4 Variation of Pressure with Depth in a Fluid
Text lessonPreview
-
11.4 Variation of Pressure with Depth in a Fluid - Check yourself
6 questionsPreview
-
11.4 Variation of Pressure with Depth in a Fluid
Text lessonPreview
-
11.4 Variation of Pressure with Depth in a Fluid - Check yourself
6 questionsPreview
-
11.5 Pascal’s Principle
Text lessonPreview
-
11.5 Pascal’s Principle - Check yourself
6 questionsPreview
-
Unit 11 review quiz: Fluid Statics
10 questionsPreview
-
Unit 11 overview: Fluid Statics
Text lessonPreview
-
11.5 Pascal’s Principle
Text lessonPreview
-
11.5 Pascal’s Principle - Check yourself
6 questionsPreview
-
11.6 Gauge Pressure, Absolute Pressure, and Pressure Measurement
Text lessonPreview
-
11.6 Gauge Pressure, Absolute Pressure, and Pressure Measurement - Check yourself
6 questionsPreview
-
11.6 Gauge Pressure, Absolute Pressure, and Pressure Measurement
Text lessonPreview
-
11.6 Gauge Pressure, Absolute Pressure, and Pressure Measurement - Check yourself
6 questionsPreview
-
11.7 Archimedes’ Principle
Text lessonPreview
-
11.7 Archimedes’ Principle - Check yourself
6 questionsPreview
-
11.7 Archimedes’ Principle
Text lessonPreview
-
11.7 Archimedes’ Principle - Check yourself
6 questionsPreview
-
11.8 Cohesion and Adhesion in Liquids: Surface Tension and Capillary Action
Text lessonPreview
-
11.8 Cohesion and Adhesion in Liquids: Surface Tension and Capillary Action - Check yourself
6 questionsPreview
-
11.8 Cohesion and Adhesion in Liquids: Surface Tension and Capillary Action
Text lessonPreview
-
11.8 Cohesion and Adhesion in Liquids: Surface Tension and Capillary Action - Check yourself
6 questionsPreview
-
11.9 Pressures in the Body
Text lessonPreview
-
11.9 Pressures in the Body - Check yourself
6 questionsPreview
-
11.9 Pressures in the Body
Text lessonPreview
-
11.9 Pressures in the Body - Check yourself
6 questionsPreview
-
Unit 11 review quiz: Fluid Statics
10 questionsPreview
Unit 12: Fluid Dynamics and Its Biological and Medical Applications
0/32
-
Unit 12 overview: Fluid Dynamics and Its Biological and Medical Applications
Text lessonPreview
-
12.1 Flow Rate and Its Relation to Velocity
Text lessonPreview
-
12.1 Flow Rate and Its Relation to Velocity - Check yourself
6 questionsPreview
-
12.1 Flow Rate and Its Relation to Velocity
Text lessonPreview
-
12.1 Flow Rate and Its Relation to Velocity - Check yourself
6 questionsPreview
-
12.2 Bernoulli’s Equation
Text lessonPreview
-
12.2 Bernoulli’s Equation - Check yourself
6 questionsPreview
-
12.2 Bernoulli’s Equation
Text lessonPreview
-
12.2 Bernoulli’s Equation - Check yourself
6 questionsPreview
-
12.3 The Most General Applications of Bernoulli’s Equation
Text lessonPreview
-
12.3 The Most General Applications of Bernoulli’s Equation - Check yourself
6 questionsPreview
-
12.3 The Most General Applications of Bernoulli’s Equation
Text lessonPreview
-
12.3 The Most General Applications of Bernoulli’s Equation - Check yourself
6 questionsPreview
-
12.4 Viscosity and Laminar Flow; Poiseuille’s Law
Text lessonPreview
-
12.4 Viscosity and Laminar Flow; Poiseuille’s Law - Check yourself
6 questionsPreview
-
Unit 12 review quiz: Fluid Dynamics and Its Biological and Medical Applications
10 questionsPreview
-
Unit 12 overview: Fluid Dynamics and Its Biological and Medical Applications
Text lessonPreview
-
12.4 Viscosity and Laminar Flow; Poiseuille’s Law
Text lessonPreview
-
12.4 Viscosity and Laminar Flow; Poiseuille’s Law - Check yourself
6 questionsPreview
-
12.5 The Onset of Turbulence
Text lessonPreview
-
12.5 The Onset of Turbulence - Check yourself
6 questionsPreview
-
12.5 The Onset of Turbulence
Text lessonPreview
-
12.5 The Onset of Turbulence - Check yourself
6 questionsPreview
-
12.6 Motion of an Object in a Viscous Fluid
Text lessonPreview
-
12.6 Motion of an Object in a Viscous Fluid - Check yourself
6 questionsPreview
-
12.6 Motion of an Object in a Viscous Fluid
Text lessonPreview
-
12.6 Motion of an Object in a Viscous Fluid - Check yourself
6 questionsPreview
-
12.7 Molecular Transport Phenomena: Diffusion, Osmosis, and Related Processes
Text lessonPreview
-
12.7 Molecular Transport Phenomena: Diffusion, Osmosis, and Related Processes - Check yourself
6 questionsPreview
-
12.7 Molecular Transport Phenomena: Diffusion, Osmosis, and Related Processes
Text lessonPreview
-
12.7 Molecular Transport Phenomena: Diffusion, Osmosis, and Related Processes - Check yourself
6 questionsPreview
-
Unit 12 review quiz: Fluid Dynamics and Its Biological and Medical Applications
10 questionsPreview
Unit 13: Temperature, Kinetic Theory, and the Gas Laws
0/28
-
Unit 13 overview: Temperature, Kinetic Theory, and the Gas Laws
Text lessonPreview
-
13.1 Temperature
Text lessonPreview
-
13.1 Temperature - Check yourself
6 questionsPreview
-
13.1 Temperature
Text lessonPreview
-
13.1 Temperature - Check yourself
6 questionsPreview
-
13.2 Thermal Expansion of Solids and Liquids
Text lessonPreview
-
13.2 Thermal Expansion of Solids and Liquids - Check yourself
6 questionsPreview
-
13.2 Thermal Expansion of Solids and Liquids
Text lessonPreview
-
13.2 Thermal Expansion of Solids and Liquids - Check yourself
6 questionsPreview
-
13.3 The Ideal Gas Law
Text lessonPreview
-
13.3 The Ideal Gas Law - Check yourself
6 questionsPreview
-
13.3 The Ideal Gas Law
Text lessonPreview
-
13.3 The Ideal Gas Law - Check yourself
6 questionsPreview
-
Unit 13 review quiz: Temperature, Kinetic Theory, and the Gas Laws
10 questionsPreview
-
Unit 13 overview: Temperature, Kinetic Theory, and the Gas Laws
Text lessonPreview
-
13.4 Kinetic Theory: Atomic and Molecular Explanation of Pressure and Temperature
Text lessonPreview
-
13.4 Kinetic Theory: Atomic and Molecular Explanation of Pressure and Temperature - Check yourself
6 questionsPreview
-
13.4 Kinetic Theory: Atomic and Molecular Explanation of Pressure and Temperature
Text lessonPreview
-
13.4 Kinetic Theory: Atomic and Molecular Explanation of Pressure and Temperature - Check yourself
6 questionsPreview
-
13.5 Phase Changes
Text lessonPreview
-
13.5 Phase Changes - Check yourself
6 questionsPreview
-
13.5 Phase Changes
Text lessonPreview
-
13.5 Phase Changes - Check yourself
6 questionsPreview
-
13.6 Humidity, Evaporation, and Boiling
Text lessonPreview
-
13.6 Humidity, Evaporation, and Boiling - Check yourself
6 questionsPreview
-
13.6 Humidity, Evaporation, and Boiling
Text lessonPreview
-
13.6 Humidity, Evaporation, and Boiling - Check yourself
6 questionsPreview
-
Unit 13 review quiz: Temperature, Kinetic Theory, and the Gas Laws
10 questionsPreview
Unit 14: Heat and Heat Transfer Methods
0/32
-
Unit 14 overview: Heat and Heat Transfer Methods
Text lessonPreview
-
14.1 Heat
Text lessonPreview
-
14.1 Heat - Check yourself
6 questionsPreview
-
14.1 Heat
Text lessonPreview
-
14.1 Heat - Check yourself
6 questionsPreview
-
14.2 Temperature Change and Heat Capacity
Text lessonPreview
-
14.2 Temperature Change and Heat Capacity - Check yourself
6 questionsPreview
-
14.2 Temperature Change and Heat Capacity
Text lessonPreview
-
14.2 Temperature Change and Heat Capacity - Check yourself
6 questionsPreview
-
14.3 Phase Change and Latent Heat
Text lessonPreview
-
14.3 Phase Change and Latent Heat - Check yourself
6 questionsPreview
-
14.3 Phase Change and Latent Heat
Text lessonPreview
-
14.3 Phase Change and Latent Heat - Check yourself
6 questionsPreview
-
14.4 Heat Transfer Methods
Text lessonPreview
-
14.4 Heat Transfer Methods - Check yourself
6 questionsPreview
-
Unit 14 review quiz: Heat and Heat Transfer Methods
10 questionsPreview
-
Unit 14 overview: Heat and Heat Transfer Methods
Text lessonPreview
-
14.4 Heat Transfer Methods
Text lessonPreview
-
14.4 Heat Transfer Methods - Check yourself
6 questionsPreview
-
14.5 Conduction
Text lessonPreview
-
14.5 Conduction - Check yourself
6 questionsPreview
-
14.5 Conduction
Text lessonPreview
-
14.5 Conduction - Check yourself
6 questionsPreview
-
14.6 Convection
Text lessonPreview
-
14.6 Convection - Check yourself
6 questionsPreview
-
14.6 Convection
Text lessonPreview
-
14.6 Convection - Check yourself
6 questionsPreview
-
14.7 Radiation
Text lessonPreview
-
14.7 Radiation - Check yourself
6 questionsPreview
-
14.7 Radiation
Text lessonPreview
-
14.7 Radiation - Check yourself
6 questionsPreview
-
Unit 14 review quiz: Heat and Heat Transfer Methods
10 questionsPreview
Unit 15: Thermodynamics
0/32
-
Unit 15 overview: Thermodynamics
Text lessonPreview
-
15.1 The First Law of Thermodynamics
Text lessonPreview
-
15.1 The First Law of Thermodynamics - Check yourself
6 questionsPreview
-
15.1 The First Law of Thermodynamics
Text lessonPreview
-
15.1 The First Law of Thermodynamics - Check yourself
6 questionsPreview
-
15.2 The First Law of Thermodynamics and Some Simple Processes
Text lessonPreview
-
15.2 The First Law of Thermodynamics and Some Simple Processes - Check yourself
6 questionsPreview
-
15.2 The First Law of Thermodynamics and Some Simple Processes
Text lessonPreview
-
15.2 The First Law of Thermodynamics and Some Simple Processes - Check yourself
6 questionsPreview
-
15.3 Introduction to the Second Law of Thermodynamics: Heat Engines and Their Efficiency
Text lessonPreview
-
15.3 Introduction to the Second Law of Thermodynamics: Heat Engines and Their Efficiency - Check yourself
6 questionsPreview
-
15.3 Introduction to the Second Law of Thermodynamics: Heat Engines and Their Efficiency
Text lessonPreview
-
15.3 Introduction to the Second Law of Thermodynamics: Heat Engines and Their Efficiency - Check yourself
6 questionsPreview
-
15.4 Carnot’s Perfect Heat Engine: The Second Law of Thermodynamics Restated
Text lessonPreview
-
15.4 Carnot’s Perfect Heat Engine: The Second Law of Thermodynamics Restated - Check yourself
6 questionsPreview
-
Unit 15 review quiz: Thermodynamics
10 questionsPreview
-
Unit 15 overview: Thermodynamics
Text lessonPreview
-
15.4 Carnot’s Perfect Heat Engine: The Second Law of Thermodynamics Restated
Text lessonPreview
-
15.4 Carnot’s Perfect Heat Engine: The Second Law of Thermodynamics Restated - Check yourself
6 questionsPreview
-
15.5 Applications of Thermodynamics: Heat Pumps and Refrigerators
Text lessonPreview
-
15.5 Applications of Thermodynamics: Heat Pumps and Refrigerators - Check yourself
6 questionsPreview
-
15.5 Applications of Thermodynamics: Heat Pumps and Refrigerators
Text lessonPreview
-
15.5 Applications of Thermodynamics: Heat Pumps and Refrigerators - Check yourself
6 questionsPreview
-
15.6 Entropy and the Second Law of Thermodynamics: Disorder and the Unavailability of Energy
Text lessonPreview
-
15.6 Entropy and the Second Law of Thermodynamics: Disorder and the Unavailability of Energy - Check yourself
6 questionsPreview
-
15.6 Entropy and the Second Law of Thermodynamics: Disorder and the Unavailability of Energy
Text lessonPreview
-
15.6 Entropy and the Second Law of Thermodynamics: Disorder and the Unavailability of Energy - Check yourself
6 questionsPreview
-
15.7 Statistical Interpretation of Entropy and the Second Law of Thermodynamics: The Underlying Explanation
Text lessonPreview
-
15.7 Statistical Interpretation of Entropy and the Second Law of Thermodynamics: The Underlying Explanation - Check yourself
6 questionsPreview
-
15.7 Statistical Interpretation of Entropy and the Second Law of Thermodynamics: The Underlying Explanation
Text lessonPreview
-
15.7 Statistical Interpretation of Entropy and the Second Law of Thermodynamics: The Underlying Explanation - Check yourself
6 questionsPreview
-
Unit 15 review quiz: Thermodynamics
10 questionsPreview
Unit 16: Oscillatory Motion and Waves
0/48
-
Unit 16 overview: Oscillatory Motion and Waves
Text lessonPreview
-
16.1 Hooke’s Law: Stress and Strain Revisited
Text lessonPreview
-
16.1 Hooke’s Law: Stress and Strain Revisited - Check yourself
6 questionsPreview
-
16.1 Hooke’s Law: Stress and Strain Revisited
Text lessonPreview
-
16.1 Hooke’s Law: Stress and Strain Revisited - Check yourself
6 questionsPreview
-
16.2 Period and Frequency in Oscillations
Text lessonPreview
-
16.2 Period and Frequency in Oscillations - Check yourself
6 questionsPreview
-
16.2 Period and Frequency in Oscillations
Text lessonPreview
-
16.2 Period and Frequency in Oscillations - Check yourself
6 questionsPreview
-
16.3 Simple Harmonic Motion: A Special Periodic Motion
Text lessonPreview
-
16.3 Simple Harmonic Motion: A Special Periodic Motion - Check yourself
6 questionsPreview
-
16.3 Simple Harmonic Motion: A Special Periodic Motion
Text lessonPreview
-
16.3 Simple Harmonic Motion: A Special Periodic Motion - Check yourself
6 questionsPreview
-
16.4 The Simple Pendulum
Text lessonPreview
-
16.4 The Simple Pendulum - Check yourself
6 questionsPreview
-
16.4 The Simple Pendulum
Text lessonPreview
-
16.4 The Simple Pendulum - Check yourself
6 questionsPreview
-
16.5 Energy and the Simple Harmonic Oscillator
Text lessonPreview
-
16.5 Energy and the Simple Harmonic Oscillator - Check yourself
6 questionsPreview
-
16.5 Energy and the Simple Harmonic Oscillator
Text lessonPreview
-
16.5 Energy and the Simple Harmonic Oscillator - Check yourself
6 questionsPreview
-
16.6 Uniform Circular Motion and Simple Harmonic Motion
Text lessonPreview
-
16.6 Uniform Circular Motion and Simple Harmonic Motion - Check yourself
6 questionsPreview
-
Unit 16 review quiz: Oscillatory Motion and Waves
10 questionsPreview
-
Unit 16 overview: Oscillatory Motion and Waves
Text lessonPreview
-
16.6 Uniform Circular Motion and Simple Harmonic Motion
Text lessonPreview
-
16.6 Uniform Circular Motion and Simple Harmonic Motion - Check yourself
6 questionsPreview
-
16.7 Damped Harmonic Motion
Text lessonPreview
-
16.7 Damped Harmonic Motion - Check yourself
6 questionsPreview
-
16.7 Damped Harmonic Motion
Text lessonPreview
-
16.7 Damped Harmonic Motion - Check yourself
6 questionsPreview
-
16.8 Forced Oscillations and Resonance
Text lessonPreview
-
16.8 Forced Oscillations and Resonance - Check yourself
6 questionsPreview
-
16.8 Forced Oscillations and Resonance
Text lessonPreview
-
16.8 Forced Oscillations and Resonance - Check yourself
6 questionsPreview
-
16.9 Waves
Text lessonPreview
-
16.9 Waves - Check yourself
6 questionsPreview
-
16.9 Waves
Text lessonPreview
-
16.9 Waves - Check yourself
6 questionsPreview
-
16.10 Superposition and Interference
Text lessonPreview
-
16.10 Superposition and Interference - Check yourself
6 questionsPreview
-
16.10 Superposition and Interference
Text lessonPreview
-
16.10 Superposition and Interference - Check yourself
6 questionsPreview
-
16.11 Energy in Waves: Intensity
Text lessonPreview
-
16.11 Energy in Waves: Intensity - Check yourself
6 questionsPreview
-
16.11 Energy in Waves: Intensity
Text lessonPreview
-
16.11 Energy in Waves: Intensity - Check yourself
6 questionsPreview
-
Unit 16 review quiz: Oscillatory Motion and Waves
10 questionsPreview
Unit 17: Physics of Hearing
0/32
-
Unit 17 overview: Physics of Hearing
Text lessonPreview
-
17.1 Sound
Text lessonPreview
-
17.1 Sound - Check yourself
6 questionsPreview
-
17.1 Sound
Text lessonPreview
-
17.1 Sound - Check yourself
6 questionsPreview
-
17.2 Speed of Sound, Frequency, and Wavelength
Text lessonPreview
-
17.2 Speed of Sound, Frequency, and Wavelength - Check yourself
6 questionsPreview
-
17.2 Speed of Sound, Frequency, and Wavelength
Text lessonPreview
-
17.2 Speed of Sound, Frequency, and Wavelength - Check yourself
6 questionsPreview
-
17.3 Sound Intensity and Sound Level
Text lessonPreview
-
17.3 Sound Intensity and Sound Level - Check yourself
6 questionsPreview
-
17.3 Sound Intensity and Sound Level
Text lessonPreview
-
17.3 Sound Intensity and Sound Level - Check yourself
6 questionsPreview
-
17.4 Doppler Effect and Sonic Booms
Text lessonPreview
-
17.4 Doppler Effect and Sonic Booms - Check yourself
6 questionsPreview
-
Unit 17 review quiz: Physics of Hearing
10 questionsPreview
-
Unit 17 overview: Physics of Hearing
Text lessonPreview
-
17.4 Doppler Effect and Sonic Booms
Text lessonPreview
-
17.4 Doppler Effect and Sonic Booms - Check yourself
6 questionsPreview
-
17.5 Sound Interference and Resonance: Standing Waves in Air Columns
Text lessonPreview
-
17.5 Sound Interference and Resonance: Standing Waves in Air Columns - Check yourself
6 questionsPreview
-
17.5 Sound Interference and Resonance: Standing Waves in Air Columns
Text lessonPreview
-
17.5 Sound Interference and Resonance: Standing Waves in Air Columns - Check yourself
6 questionsPreview
-
17.6 Hearing
Text lessonPreview
-
17.6 Hearing - Check yourself
6 questionsPreview
-
17.6 Hearing
Text lessonPreview
-
17.6 Hearing - Check yourself
6 questionsPreview
-
17.7 Ultrasound
Text lessonPreview
-
17.7 Ultrasound - Check yourself
6 questionsPreview
-
17.7 Ultrasound
Text lessonPreview
-
17.7 Ultrasound - Check yourself
6 questionsPreview
-
Unit 17 review quiz: Physics of Hearing
10 questionsPreview
Unit 18: Electric Charge and Electric Field
0/36
-
Unit 18 overview: Electric Charge and Electric Field
Text lessonPreview
-
18.1 Static Electricity and Charge: Conservation of Charge
Text lessonPreview
-
18.1 Static Electricity and Charge: Conservation of Charge - Check yourself
6 questionsPreview
-
18.1 Static Electricity and Charge: Conservation of Charge
Text lessonPreview
-
18.1 Static Electricity and Charge: Conservation of Charge - Check yourself
6 questionsPreview
-
18.2 Conductors and Insulators
Text lessonPreview
-
18.2 Conductors and Insulators - Check yourself
6 questionsPreview
-
18.2 Conductors and Insulators
Text lessonPreview
-
18.2 Conductors and Insulators - Check yourself
6 questionsPreview
-
18.3 Conductors and Electric Fields in Static Equilibrium
Text lessonPreview
-
18.3 Conductors and Electric Fields in Static Equilibrium - Check yourself
6 questionsPreview
-
18.3 Conductors and Electric Fields in Static Equilibrium
Text lessonPreview
-
18.3 Conductors and Electric Fields in Static Equilibrium - Check yourself
6 questionsPreview
-
18.4 Coulomb’s Law
Text lessonPreview
-
18.4 Coulomb’s Law - Check yourself
6 questionsPreview
-
18.4 Coulomb’s Law
Text lessonPreview
-
18.4 Coulomb’s Law - Check yourself
6 questionsPreview
-
Unit 18 review quiz: Electric Charge and Electric Field
10 questionsPreview
-
Unit 18 overview: Electric Charge and Electric Field
Text lessonPreview
-
18.5 Electric Field: Concept of a Field Revisited
Text lessonPreview
-
18.5 Electric Field: Concept of a Field Revisited - Check yourself
6 questionsPreview
-
18.5 Electric Field: Concept of a Field Revisited
Text lessonPreview
-
18.5 Electric Field: Concept of a Field Revisited - Check yourself
6 questionsPreview
-
18.6 Electric Field Lines: Multiple Charges
Text lessonPreview
-
18.6 Electric Field Lines: Multiple Charges - Check yourself
6 questionsPreview
-
18.6 Electric Field Lines: Multiple Charges
Text lessonPreview
-
18.6 Electric Field Lines: Multiple Charges - Check yourself
6 questionsPreview
-
18.7 Electric Forces in Biology
Text lessonPreview
-
18.7 Electric Forces in Biology - Check yourself
6 questionsPreview
-
18.7 Electric Forces in Biology
Text lessonPreview
-
18.7 Electric Forces in Biology - Check yourself
6 questionsPreview
-
18.8 Applications of Electrostatics
Text lessonPreview
-
18.8 Applications of Electrostatics - Check yourself
6 questionsPreview
-
18.8 Applications of Electrostatics
Text lessonPreview
-
18.8 Applications of Electrostatics - Check yourself
6 questionsPreview
-
Unit 18 review quiz: Electric Charge and Electric Field
10 questionsPreview
Unit 19: Electric Potential and Electric Field
0/32
-
Unit 19 overview: Electric Potential and Electric Field
Text lessonPreview
-
19.1 Electric Potential Energy: Potential Difference
Text lessonPreview
-
19.1 Electric Potential Energy: Potential Difference - Check yourself
6 questionsPreview
-
19.1 Electric Potential Energy: Potential Difference
Text lessonPreview
-
19.1 Electric Potential Energy: Potential Difference - Check yourself
6 questionsPreview
-
19.2 Electric Potential in a Uniform Electric Field
Text lessonPreview
-
19.2 Electric Potential in a Uniform Electric Field - Check yourself
6 questionsPreview
-
19.2 Electric Potential in a Uniform Electric Field
Text lessonPreview
-
19.2 Electric Potential in a Uniform Electric Field - Check yourself
6 questionsPreview
-
19.3 Electrical Potential Due to a Point Charge
Text lessonPreview
-
19.3 Electrical Potential Due to a Point Charge - Check yourself
6 questionsPreview
-
19.3 Electrical Potential Due to a Point Charge
Text lessonPreview
-
19.3 Electrical Potential Due to a Point Charge - Check yourself
6 questionsPreview
-
19.4 Equipotential Lines
Text lessonPreview
-
19.4 Equipotential Lines - Check yourself
6 questionsPreview
-
Unit 19 review quiz: Electric Potential and Electric Field
10 questionsPreview
-
Unit 19 overview: Electric Potential and Electric Field
Text lessonPreview
-
19.4 Equipotential Lines
Text lessonPreview
-
19.4 Equipotential Lines - Check yourself
6 questionsPreview
-
19.5 Capacitors and Dielectrics
Text lessonPreview
-
19.5 Capacitors and Dielectrics - Check yourself
6 questionsPreview
-
19.5 Capacitors and Dielectrics
Text lessonPreview
-
19.5 Capacitors and Dielectrics - Check yourself
6 questionsPreview
-
19.6 Capacitors in Series and Parallel
Text lessonPreview
-
19.6 Capacitors in Series and Parallel - Check yourself
6 questionsPreview
-
19.6 Capacitors in Series and Parallel
Text lessonPreview
-
19.6 Capacitors in Series and Parallel - Check yourself
6 questionsPreview
-
19.7 Energy Stored in Capacitors
Text lessonPreview
-
19.7 Energy Stored in Capacitors - Check yourself
6 questionsPreview
-
19.7 Energy Stored in Capacitors
Text lessonPreview
-
19.7 Energy Stored in Capacitors - Check yourself
6 questionsPreview
-
Unit 19 review quiz: Electric Potential and Electric Field
10 questionsPreview
Unit 20: Electric Current, Resistance, and Ohm's Law
0/32
-
Unit 20 overview: Electric Current, Resistance, and Ohm's Law
Text lessonPreview
-
20.1 Current
Text lessonPreview
-
20.1 Current - Check yourself
6 questionsPreview
-
20.1 Current
Text lessonPreview
-
20.1 Current - Check yourself
6 questionsPreview
-
20.2 Ohm’s Law: Resistance and Simple Circuits
Text lessonPreview
-
20.2 Ohm’s Law: Resistance and Simple Circuits - Check yourself
6 questionsPreview
-
20.2 Ohm’s Law: Resistance and Simple Circuits
Text lessonPreview
-
20.2 Ohm’s Law: Resistance and Simple Circuits - Check yourself
6 questionsPreview
-
20.3 Resistance and Resistivity
Text lessonPreview
-
20.3 Resistance and Resistivity - Check yourself
6 questionsPreview
-
20.3 Resistance and Resistivity
Text lessonPreview
-
20.3 Resistance and Resistivity - Check yourself
6 questionsPreview
-
20.4 Electric Power and Energy
Text lessonPreview
-
20.4 Electric Power and Energy - Check yourself
6 questionsPreview
-
Unit 20 review quiz: Electric Current, Resistance, and Ohm's Law
10 questionsPreview
-
Unit 20 overview: Electric Current, Resistance, and Ohm's Law
Text lessonPreview
-
20.4 Electric Power and Energy
Text lessonPreview
-
20.4 Electric Power and Energy - Check yourself
6 questionsPreview
-
20.5 Alternating Current versus Direct Current
Text lessonPreview
-
20.5 Alternating Current versus Direct Current - Check yourself
6 questionsPreview
-
20.5 Alternating Current versus Direct Current
Text lessonPreview
-
20.5 Alternating Current versus Direct Current - Check yourself
6 questionsPreview
-
20.6 Electric Hazards and the Human Body
Text lessonPreview
-
20.6 Electric Hazards and the Human Body - Check yourself
6 questionsPreview
-
20.6 Electric Hazards and the Human Body
Text lessonPreview
-
20.6 Electric Hazards and the Human Body - Check yourself
6 questionsPreview
-
20.7 Nerve Conduction–Electrocardiograms
Text lessonPreview
-
20.7 Nerve Conduction–Electrocardiograms - Check yourself
6 questionsPreview
-
20.7 Nerve Conduction–Electrocardiograms
Text lessonPreview
-
20.7 Nerve Conduction–Electrocardiograms - Check yourself
6 questionsPreview
-
Unit 20 review quiz: Electric Current, Resistance, and Ohm's Law
10 questionsPreview
Unit 21: Circuits and DC Instruments
0/28
-
Unit 21 overview: Circuits and DC Instruments
Text lessonPreview
-
21.1 Resistors in Series and Parallel
Text lessonPreview
-
21.1 Resistors in Series and Parallel - Check yourself
6 questionsPreview
-
21.1 Resistors in Series and Parallel
Text lessonPreview
-
21.1 Resistors in Series and Parallel - Check yourself
6 questionsPreview
-
21.2 Electromotive Force: Terminal Voltage
Text lessonPreview
-
21.2 Electromotive Force: Terminal Voltage - Check yourself
6 questionsPreview
-
21.2 Electromotive Force: Terminal Voltage
Text lessonPreview
-
21.2 Electromotive Force: Terminal Voltage - Check yourself
6 questionsPreview
-
21.3 Kirchhoff’s Rules
Text lessonPreview
-
21.3 Kirchhoff’s Rules - Check yourself
6 questionsPreview
-
21.3 Kirchhoff’s Rules
Text lessonPreview
-
21.3 Kirchhoff’s Rules - Check yourself
6 questionsPreview
-
Unit 21 review quiz: Circuits and DC Instruments
10 questionsPreview
-
Unit 21 overview: Circuits and DC Instruments
Text lessonPreview
-
21.4 DC Voltmeters and Ammeters
Text lessonPreview
-
21.4 DC Voltmeters and Ammeters - Check yourself
6 questionsPreview
-
21.4 DC Voltmeters and Ammeters
Text lessonPreview
-
21.4 DC Voltmeters and Ammeters - Check yourself
6 questionsPreview
-
21.5 Null Measurements
Text lessonPreview
-
21.5 Null Measurements - Check yourself
6 questionsPreview
-
21.5 Null Measurements
Text lessonPreview
-
21.5 Null Measurements - Check yourself
6 questionsPreview
-
21.6 DC Circuits Containing Resistors and Capacitors
Text lessonPreview
-
21.6 DC Circuits Containing Resistors and Capacitors - Check yourself
6 questionsPreview
-
21.6 DC Circuits Containing Resistors and Capacitors
Text lessonPreview
-
21.6 DC Circuits Containing Resistors and Capacitors - Check yourself
6 questionsPreview
-
Unit 21 review quiz: Circuits and DC Instruments
10 questionsPreview
Unit 22: Magnetism
0/48
-
Unit 22 overview: Magnetism
Text lessonPreview
-
22.1 Magnets
Text lessonPreview
-
22.1 Magnets - Check yourself
6 questionsPreview
-
22.1 Magnets
Text lessonPreview
-
22.1 Magnets - Check yourself
6 questionsPreview
-
22.2 Ferromagnets and Electromagnets
Text lessonPreview
-
22.2 Ferromagnets and Electromagnets - Check yourself
6 questionsPreview
-
22.2 Ferromagnets and Electromagnets
Text lessonPreview
-
22.2 Ferromagnets and Electromagnets - Check yourself
6 questionsPreview
-
22.3 Magnetic Fields and Magnetic Field Lines
Text lessonPreview
-
22.3 Magnetic Fields and Magnetic Field Lines - Check yourself
6 questionsPreview
-
22.3 Magnetic Fields and Magnetic Field Lines
Text lessonPreview
-
22.3 Magnetic Fields and Magnetic Field Lines - Check yourself
6 questionsPreview
-
22.4 Magnetic Field Strength: Force on a Moving Charge in a Magnetic Field
Text lessonPreview
-
22.4 Magnetic Field Strength: Force on a Moving Charge in a Magnetic Field - Check yourself
6 questionsPreview
-
22.4 Magnetic Field Strength: Force on a Moving Charge in a Magnetic Field
Text lessonPreview
-
22.4 Magnetic Field Strength: Force on a Moving Charge in a Magnetic Field - Check yourself
6 questionsPreview
-
22.5 Force on a Moving Charge in a Magnetic Field: Examples and Applications
Text lessonPreview
-
22.5 Force on a Moving Charge in a Magnetic Field: Examples and Applications - Check yourself
6 questionsPreview
-
22.5 Force on a Moving Charge in a Magnetic Field: Examples and Applications
Text lessonPreview
-
22.5 Force on a Moving Charge in a Magnetic Field: Examples and Applications - Check yourself
6 questionsPreview
-
22.6 The Hall Effect
Text lessonPreview
-
22.6 The Hall Effect - Check yourself
6 questionsPreview
-
Unit 22 review quiz: Magnetism
10 questionsPreview
-
Unit 22 overview: Magnetism
Text lessonPreview
-
22.6 The Hall Effect
Text lessonPreview
-
22.6 The Hall Effect - Check yourself
6 questionsPreview
-
22.7 Magnetic Force on a Current-Carrying Conductor
Text lessonPreview
-
22.7 Magnetic Force on a Current-Carrying Conductor - Check yourself
6 questionsPreview
-
22.7 Magnetic Force on a Current-Carrying Conductor
Text lessonPreview
-
22.7 Magnetic Force on a Current-Carrying Conductor - Check yourself
6 questionsPreview
-
22.8 Torque on a Current Loop: Motors and Meters
Text lessonPreview
-
22.8 Torque on a Current Loop: Motors and Meters - Check yourself
6 questionsPreview
-
22.8 Torque on a Current Loop: Motors and Meters
Text lessonPreview
-
22.8 Torque on a Current Loop: Motors and Meters - Check yourself
6 questionsPreview
-
22.9 Magnetic Fields Produced by Currents: Ampere’s Law
Text lessonPreview
-
22.9 Magnetic Fields Produced by Currents: Ampere’s Law - Check yourself
6 questionsPreview
-
22.9 Magnetic Fields Produced by Currents: Ampere’s Law
Text lessonPreview
-
22.9 Magnetic Fields Produced by Currents: Ampere’s Law - Check yourself
6 questionsPreview
-
22.10 Magnetic Force between Two Parallel Conductors
Text lessonPreview
-
22.10 Magnetic Force between Two Parallel Conductors - Check yourself
6 questionsPreview
-
22.10 Magnetic Force between Two Parallel Conductors
Text lessonPreview
-
22.10 Magnetic Force between Two Parallel Conductors - Check yourself
6 questionsPreview
-
22.11 More Applications of Magnetism
Text lessonPreview
-
22.11 More Applications of Magnetism - Check yourself
6 questionsPreview
-
22.11 More Applications of Magnetism
Text lessonPreview
-
22.11 More Applications of Magnetism - Check yourself
6 questionsPreview
-
Unit 22 review quiz: Magnetism
10 questionsPreview
Unit 23: Electromagnetic Induction, AC Circuits, and Electrical Technologies
0/52
-
Unit 23 overview: Electromagnetic Induction, AC Circuits, and Electrical Technologies
Text lessonPreview
-
23.1 Induced Emf and Magnetic Flux
Text lessonPreview
-
23.1 Induced Emf and Magnetic Flux - Check yourself
6 questionsPreview
-
23.1 Induced Emf and Magnetic Flux
Text lessonPreview
-
23.1 Induced Emf and Magnetic Flux - Check yourself
6 questionsPreview
-
23.2 Faraday’s Law of Induction: Lenz’s Law
Text lessonPreview
-
23.2 Faraday’s Law of Induction: Lenz’s Law - Check yourself
6 questionsPreview
-
23.2 Faraday’s Law of Induction: Lenz’s Law
Text lessonPreview
-
23.2 Faraday’s Law of Induction: Lenz’s Law - Check yourself
6 questionsPreview
-
23.3 Motional Emf
Text lessonPreview
-
23.3 Motional Emf - Check yourself
6 questionsPreview
-
23.3 Motional Emf
Text lessonPreview
-
23.3 Motional Emf - Check yourself
6 questionsPreview
-
23.4 Eddy Currents and Magnetic Damping
Text lessonPreview
-
23.4 Eddy Currents and Magnetic Damping - Check yourself
6 questionsPreview
-
23.4 Eddy Currents and Magnetic Damping
Text lessonPreview
-
23.4 Eddy Currents and Magnetic Damping - Check yourself
6 questionsPreview
-
23.5 Electric Generators
Text lessonPreview
-
23.5 Electric Generators - Check yourself
6 questionsPreview
-
23.5 Electric Generators
Text lessonPreview
-
23.5 Electric Generators - Check yourself
6 questionsPreview
-
23.6 Back Emf
Text lessonPreview
-
23.6 Back Emf - Check yourself
6 questionsPreview
-
23.6 Back Emf
Text lessonPreview
-
23.6 Back Emf - Check yourself
6 questionsPreview
-
Unit 23 review quiz: Electromagnetic Induction, AC Circuits, and Electrical Technologies
10 questionsPreview
-
Unit 23 overview: Electromagnetic Induction, AC Circuits, and Electrical Technologies
Text lessonPreview
-
23.7 Transformers
Text lessonPreview
-
23.7 Transformers - Check yourself
6 questionsPreview
-
23.7 Transformers
Text lessonPreview
-
23.7 Transformers - Check yourself
6 questionsPreview
-
23.8 Electrical Safety: Systems and Devices
Text lessonPreview
-
23.8 Electrical Safety: Systems and Devices - Check yourself
6 questionsPreview
-
23.8 Electrical Safety: Systems and Devices
Text lessonPreview
-
23.8 Electrical Safety: Systems and Devices - Check yourself
6 questionsPreview
-
23.9 Inductance
Text lessonPreview
-
23.9 Inductance - Check yourself
6 questionsPreview
-
23.9 Inductance
Text lessonPreview
-
23.9 Inductance - Check yourself
6 questionsPreview
-
23.10 RL Circuits
Text lessonPreview
-
23.10 RL Circuits - Check yourself
6 questionsPreview
-
23.10 RL Circuits
Text lessonPreview
-
23.10 RL Circuits - Check yourself
6 questionsPreview
-
23.11 Reactance, Inductive and Capacitive
Text lessonPreview
-
23.11 Reactance, Inductive and Capacitive - Check yourself
6 questionsPreview
-
23.11 Reactance, Inductive and Capacitive
Text lessonPreview
-
23.11 Reactance, Inductive and Capacitive - Check yourself
6 questionsPreview
-
23.12 RLC Series AC Circuits
Text lessonPreview
-
23.12 RLC Series AC Circuits - Check yourself
6 questionsPreview
-
23.12 RLC Series AC Circuits
Text lessonPreview
-
23.12 RLC Series AC Circuits - Check yourself
6 questionsPreview
-
Unit 23 review quiz: Electromagnetic Induction, AC Circuits, and Electrical Technologies
10 questionsPreview
Unit 24: Electromagnetic Waves
0/20
-
Unit 24 overview: Electromagnetic Waves
Text lessonPreview
-
24.1 Maxwell’s Equations: Electromagnetic Waves Predicted and Observed
Text lessonPreview
-
24.1 Maxwell’s Equations: Electromagnetic Waves Predicted and Observed - Check yourself
6 questionsPreview
-
24.1 Maxwell’s Equations: Electromagnetic Waves Predicted and Observed
Text lessonPreview
-
24.1 Maxwell’s Equations: Electromagnetic Waves Predicted and Observed - Check yourself
6 questionsPreview
-
24.2 Production of Electromagnetic Waves
Text lessonPreview
-
24.2 Production of Electromagnetic Waves - Check yourself
6 questionsPreview
-
24.2 Production of Electromagnetic Waves
Text lessonPreview
-
24.2 Production of Electromagnetic Waves - Check yourself
6 questionsPreview
-
Unit 24 review quiz: Electromagnetic Waves
10 questionsPreview
-
Unit 24 overview: Electromagnetic Waves
Text lessonPreview
-
24.3 The Electromagnetic Spectrum
Text lessonPreview
-
24.3 The Electromagnetic Spectrum - Check yourself
6 questionsPreview
-
24.3 The Electromagnetic Spectrum
Text lessonPreview
-
24.3 The Electromagnetic Spectrum - Check yourself
6 questionsPreview
-
24.4 Energy in Electromagnetic Waves
Text lessonPreview
-
24.4 Energy in Electromagnetic Waves - Check yourself
6 questionsPreview
-
24.4 Energy in Electromagnetic Waves
Text lessonPreview
-
24.4 Energy in Electromagnetic Waves - Check yourself
6 questionsPreview
-
Unit 24 review quiz: Electromagnetic Waves
10 questionsPreview
Unit 25: Geometric Optics
0/32
-
Unit 25 overview: Geometric Optics
Text lessonPreview
-
25.1 The Ray Aspect of Light
Text lessonPreview
-
25.1 The Ray Aspect of Light - Check yourself
6 questionsPreview
-
25.1 The Ray Aspect of Light
Text lessonPreview
-
25.1 The Ray Aspect of Light - Check yourself
6 questionsPreview
-
25.2 The Law of Reflection
Text lessonPreview
-
25.2 The Law of Reflection - Check yourself
6 questionsPreview
-
25.2 The Law of Reflection
Text lessonPreview
-
25.2 The Law of Reflection - Check yourself
6 questionsPreview
-
25.3 The Law of Refraction
Text lessonPreview
-
25.3 The Law of Refraction - Check yourself
6 questionsPreview
-
25.3 The Law of Refraction
Text lessonPreview
-
25.3 The Law of Refraction - Check yourself
6 questionsPreview
-
25.4 Total Internal Reflection
Text lessonPreview
-
25.4 Total Internal Reflection - Check yourself
6 questionsPreview
-
Unit 25 review quiz: Geometric Optics
10 questionsPreview
-
Unit 25 overview: Geometric Optics
Text lessonPreview
-
25.4 Total Internal Reflection
Text lessonPreview
-
25.4 Total Internal Reflection - Check yourself
6 questionsPreview
-
25.5 Dispersion: The Rainbow and Prisms
Text lessonPreview
-
25.5 Dispersion: The Rainbow and Prisms - Check yourself
6 questionsPreview
-
25.5 Dispersion: The Rainbow and Prisms
Text lessonPreview
-
25.5 Dispersion: The Rainbow and Prisms - Check yourself
6 questionsPreview
-
25.6 Image Formation by Lenses
Text lessonPreview
-
25.6 Image Formation by Lenses - Check yourself
6 questionsPreview
-
25.6 Image Formation by Lenses
Text lessonPreview
-
25.6 Image Formation by Lenses - Check yourself
6 questionsPreview
-
25.7 Image Formation by Mirrors
Text lessonPreview
-
25.7 Image Formation by Mirrors - Check yourself
6 questionsPreview
-
25.7 Image Formation by Mirrors
Text lessonPreview
-
25.7 Image Formation by Mirrors - Check yourself
6 questionsPreview
-
Unit 25 review quiz: Geometric Optics
10 questionsPreview
Unit 26: Vision and Optical Instruments
0/28
-
Unit 26 overview: Vision and Optical Instruments
Text lessonPreview
-
26.1 Physics of the Eye
Text lessonPreview
-
26.1 Physics of the Eye - Check yourself
6 questionsPreview
-
26.1 Physics of the Eye
Text lessonPreview
-
26.1 Physics of the Eye - Check yourself
6 questionsPreview
-
26.2 Vision Correction
Text lessonPreview
-
26.2 Vision Correction - Check yourself
6 questionsPreview
-
26.2 Vision Correction
Text lessonPreview
-
26.2 Vision Correction - Check yourself
6 questionsPreview
-
26.3 Color and Color Vision
Text lessonPreview
-
26.3 Color and Color Vision - Check yourself
6 questionsPreview
-
26.3 Color and Color Vision
Text lessonPreview
-
26.3 Color and Color Vision - Check yourself
6 questionsPreview
-
Unit 26 review quiz: Vision and Optical Instruments
10 questionsPreview
-
Unit 26 overview: Vision and Optical Instruments
Text lessonPreview
-
26.4 Microscopes
Text lessonPreview
-
26.4 Microscopes - Check yourself
6 questionsPreview
-
26.4 Microscopes
Text lessonPreview
-
26.4 Microscopes - Check yourself
6 questionsPreview
-
26.5 Telescopes
Text lessonPreview
-
26.5 Telescopes - Check yourself
6 questionsPreview
-
26.5 Telescopes
Text lessonPreview
-
26.5 Telescopes - Check yourself
6 questionsPreview
-
26.6 Aberrations
Text lessonPreview
-
26.6 Aberrations - Check yourself
6 questionsPreview
-
26.6 Aberrations
Text lessonPreview
-
26.6 Aberrations - Check yourself
6 questionsPreview
-
Unit 26 review quiz: Vision and Optical Instruments
10 questionsPreview
Unit 27: Wave Optics
0/40
-
Unit 27 overview: Wave Optics
Text lessonPreview
-
27.1 The Wave Aspect of Light: Interference
Text lessonPreview
-
27.1 The Wave Aspect of Light: Interference - Check yourself
6 questionsPreview
-
27.1 The Wave Aspect of Light: Interference
Text lessonPreview
-
27.1 The Wave Aspect of Light: Interference - Check yourself
6 questionsPreview
-
27.2 Huygens's Principle: Diffraction
Text lessonPreview
-
27.2 Huygens's Principle: Diffraction - Check yourself
6 questionsPreview
-
27.2 Huygens's Principle: Diffraction
Text lessonPreview
-
27.2 Huygens's Principle: Diffraction - Check yourself
6 questionsPreview
-
27.3 Young’s Double Slit Experiment
Text lessonPreview
-
27.3 Young’s Double Slit Experiment - Check yourself
6 questionsPreview
-
27.3 Young’s Double Slit Experiment
Text lessonPreview
-
27.3 Young’s Double Slit Experiment - Check yourself
6 questionsPreview
-
27.4 Multiple Slit Diffraction
Text lessonPreview
-
27.4 Multiple Slit Diffraction - Check yourself
6 questionsPreview
-
27.4 Multiple Slit Diffraction
Text lessonPreview
-
27.4 Multiple Slit Diffraction - Check yourself
6 questionsPreview
-
27.5 Single Slit Diffraction
Text lessonPreview
-
27.5 Single Slit Diffraction - Check yourself
6 questionsPreview
-
Unit 27 review quiz: Wave Optics
10 questionsPreview
-
Unit 27 overview: Wave Optics
Text lessonPreview
-
27.5 Single Slit Diffraction
Text lessonPreview
-
27.5 Single Slit Diffraction - Check yourself
6 questionsPreview
-
27.6 Limits of Resolution: The Rayleigh Criterion
Text lessonPreview
-
27.6 Limits of Resolution: The Rayleigh Criterion - Check yourself
6 questionsPreview
-
27.6 Limits of Resolution: The Rayleigh Criterion
Text lessonPreview
-
27.6 Limits of Resolution: The Rayleigh Criterion - Check yourself
6 questionsPreview
-
27.7 Thin Film Interference
Text lessonPreview
-
27.7 Thin Film Interference - Check yourself
6 questionsPreview
-
27.7 Thin Film Interference
Text lessonPreview
-
27.7 Thin Film Interference - Check yourself
6 questionsPreview
-
27.8 Polarization
Text lessonPreview
-
27.8 Polarization - Check yourself
6 questionsPreview
-
27.8 Polarization
Text lessonPreview
-
27.8 Polarization - Check yourself
6 questionsPreview
-
27.9 *Extended Topic* Microscopy Enhanced by the Wave Characteristics of Light
Text lessonPreview
-
27.9 *Extended Topic* Microscopy Enhanced by the Wave Characteristics of Light - Check yourself
6 questionsPreview
-
27.9 *Extended Topic* Microscopy Enhanced by the Wave Characteristics of Light
Text lessonPreview
-
27.9 *Extended Topic* Microscopy Enhanced by the Wave Characteristics of Light - Check yourself
6 questionsPreview
-
Unit 27 review quiz: Wave Optics
10 questionsPreview
Unit 28: Special Relativity
0/28
-
Unit 28 overview: Special Relativity
Text lessonPreview
-
28.1 Einstein’s Postulates
Text lessonPreview
-
28.1 Einstein’s Postulates - Check yourself
6 questionsPreview
-
28.1 Einstein’s Postulates
Text lessonPreview
-
28.1 Einstein’s Postulates - Check yourself
6 questionsPreview
-
28.2 Simultaneity And Time Dilation
Text lessonPreview
-
28.2 Simultaneity And Time Dilation - Check yourself
6 questionsPreview
-
28.2 Simultaneity And Time Dilation
Text lessonPreview
-
28.2 Simultaneity And Time Dilation - Check yourself
6 questionsPreview
-
28.3 Length Contraction
Text lessonPreview
-
28.3 Length Contraction - Check yourself
6 questionsPreview
-
28.3 Length Contraction
Text lessonPreview
-
28.3 Length Contraction - Check yourself
6 questionsPreview
-
Unit 28 review quiz: Special Relativity
10 questionsPreview
-
Unit 28 overview: Special Relativity
Text lessonPreview
-
28.4 Relativistic Addition of Velocities
Text lessonPreview
-
28.4 Relativistic Addition of Velocities - Check yourself
6 questionsPreview
-
28.4 Relativistic Addition of Velocities
Text lessonPreview
-
28.4 Relativistic Addition of Velocities - Check yourself
6 questionsPreview
-
28.5 Relativistic Momentum
Text lessonPreview
-
28.5 Relativistic Momentum - Check yourself
6 questionsPreview
-
28.5 Relativistic Momentum
Text lessonPreview
-
28.5 Relativistic Momentum - Check yourself
6 questionsPreview
-
28.6 Relativistic Energy
Text lessonPreview
-
28.6 Relativistic Energy - Check yourself
6 questionsPreview
-
28.6 Relativistic Energy
Text lessonPreview
-
28.6 Relativistic Energy - Check yourself
6 questionsPreview
-
Unit 28 review quiz: Special Relativity
10 questionsPreview
Unit 29: Quantum Physics
0/35
-
Unit 29 overview: Quantum Physics
Text lessonPreview
-
29.1 Quantization of Energy
Text lessonPreview
-
29.1 Quantization of Energy - Check yourself
6 questionsPreview
-
29.1 Quantization of Energy
Text lessonPreview
-
29.1 Quantization of Energy - Check yourself
6 questionsPreview
-
29.2 The Photoelectric Effect
Text lessonPreview
-
29.2 The Photoelectric Effect - Check yourself
6 questionsPreview
-
29.2 The Photoelectric Effect
Text lessonPreview
-
29.2 The Photoelectric Effect - Check yourself
6 questionsPreview
-
29.3 Photon Energies and the Electromagnetic Spectrum
Text lessonPreview
-
29.3 Photon Energies and the Electromagnetic Spectrum - Check yourself
6 questionsPreview
-
29.3 Photon Energies and the Electromagnetic Spectrum
Text lessonPreview
-
29.3 Photon Energies and the Electromagnetic Spectrum - Check yourself
6 questionsPreview
-
29.4 Photon Momentum
Text lessonPreview
-
29.4 Photon Momentum - Check yourself
6 questionsPreview
-
29.4 Photon Momentum
Text lessonPreview
-
29.4 Photon Momentum - Check yourself
6 questionsPreview
-
Unit 29 review quiz: Quantum Physics
10 questionsPreview
-
Unit 29 overview: Quantum Physics
Text lessonPreview
-
29.5 The Particle-Wave Duality
Text lessonPreview
-
29.5 The Particle-Wave Duality - Check yourself
6 questionsPreview
-
29.5 The Particle-Wave Duality
Text lessonPreview
-
29.5 The Particle-Wave Duality - Check yourself
6 questionsPreview
-
29.6 The Wave Nature of Matter
Text lessonPreview
-
29.6 The Wave Nature of Matter - Check yourself
6 questionsPreview
-
29.6 The Wave Nature of Matter
Text lessonPreview
-
29.6 The Wave Nature of Matter - Check yourself
6 questionsPreview
-
29.7 Probability: The Heisenberg Uncertainty Principle
Text lessonPreview
-
29.7 Probability: The Heisenberg Uncertainty Principle - Check yourself
6 questionsPreview
-
29.7 Probability: The Heisenberg Uncertainty Principle
Text lessonPreview
-
29.7 Probability: The Heisenberg Uncertainty Principle - Check yourself
6 questionsPreview
-
29.8 The Particle-Wave Duality Reviewed
Text lessonPreview
-
29.8 The Particle-Wave Duality Reviewed - Check yourself
6 questionsPreview
-
29.8 The Particle-Wave Duality Reviewed
Text lessonPreview
-
29.8 The Particle-Wave Duality Reviewed - Check yourself
6 questionsPreview
Unit 30: Atomic Physics
0/20
-
Unit 30 overview: Atomic Physics
Text lessonPreview
-
30.1 Discovery of the Atom
Text lessonPreview
-
30.1 Discovery of the Atom - Check yourself
6 questionsPreview
-
30.2 Discovery of the Parts of the Atom: Electrons and Nuclei
Text lessonPreview
-
30.2 Discovery of the Parts of the Atom: Electrons and Nuclei - Check yourself
6 questionsPreview
-
30.3 Bohr’s Theory of the Hydrogen Atom
Text lessonPreview
-
30.3 Bohr’s Theory of the Hydrogen Atom - Check yourself
6 questionsPreview
-
30.4 X Rays: Atomic Origins and Applications
Text lessonPreview
-
30.4 X Rays: Atomic Origins and Applications - Check yourself
6 questionsPreview
-
30.5 Applications of Atomic Excitations and De-Excitations
Text lessonPreview
-
30.5 Applications of Atomic Excitations and De-Excitations - Check yourself
6 questionsPreview
-
30.6 The Wave Nature of Matter Causes Quantization
Text lessonPreview
-
30.6 The Wave Nature of Matter Causes Quantization - Check yourself
6 questionsPreview
-
30.7 Patterns in Spectra Reveal More Quantization
Text lessonPreview
-
30.7 Patterns in Spectra Reveal More Quantization - Check yourself
6 questionsPreview
-
30.8 Quantum Numbers and Rules
Text lessonPreview
-
30.8 Quantum Numbers and Rules - Check yourself
6 questionsPreview
-
30.9 The Pauli Exclusion Principle
Text lessonPreview
-
30.9 The Pauli Exclusion Principle - Check yourself
6 questionsPreview
-
Unit 30 review quiz: Atomic Physics
10 questionsPreview
Unit 31: Radioactivity and Nuclear Physics
0/16
-
Unit 31 overview: Radioactivity and Nuclear Physics
Text lessonPreview
-
31.1 Nuclear Radioactivity
Text lessonPreview
-
31.1 Nuclear Radioactivity - Check yourself
6 questionsPreview
-
31.2 Radiation Detection and Detectors
Text lessonPreview
-
31.2 Radiation Detection and Detectors - Check yourself
6 questionsPreview
-
31.3 Substructure of the Nucleus
Text lessonPreview
-
31.3 Substructure of the Nucleus - Check yourself
6 questionsPreview
-
31.4 Nuclear Decay and Conservation Laws
Text lessonPreview
-
31.4 Nuclear Decay and Conservation Laws - Check yourself
6 questionsPreview
-
31.5 Half-Life and Activity
Text lessonPreview
-
31.5 Half-Life and Activity - Check yourself
6 questionsPreview
-
31.6 Binding Energy
Text lessonPreview
-
31.6 Binding Energy - Check yourself
6 questionsPreview
-
31.7 Tunneling
Text lessonPreview
-
31.7 Tunneling - Check yourself
6 questionsPreview
-
Unit 31 review quiz: Radioactivity and Nuclear Physics
10 questionsPreview
Unit 32: Medical Applications of Nuclear Physics
0/16
-
Unit 32 overview: Medical Applications of Nuclear Physics
Text lessonPreview
-
32.1 Diagnostics and Medical Imaging
Text lessonPreview
-
32.1 Diagnostics and Medical Imaging - Check yourself
6 questionsPreview
-
32.2 Biological Effects of Ionizing Radiation
Text lessonPreview
-
32.2 Biological Effects of Ionizing Radiation - Check yourself
6 questionsPreview
-
32.3 Therapeutic Uses of Ionizing Radiation
Text lessonPreview
-
32.3 Therapeutic Uses of Ionizing Radiation - Check yourself
6 questionsPreview
-
32.4 Food Irradiation
Text lessonPreview
-
32.4 Food Irradiation - Check yourself
6 questionsPreview
-
32.5 Fusion
Text lessonPreview
-
32.5 Fusion - Check yourself
6 questionsPreview
-
32.6 Fission
Text lessonPreview
-
32.6 Fission - Check yourself
6 questionsPreview
-
32.7 Nuclear Weapons
Text lessonPreview
-
32.7 Nuclear Weapons - Check yourself
6 questionsPreview
-
Unit 32 review quiz: Medical Applications of Nuclear Physics
10 questionsPreview
Unit 33: Particle Physics
0/14
-
Unit 33 overview: Particle Physics
Text lessonPreview
-
33.1 The Yukawa Particle and the Heisenberg Uncertainty Principle Revisited
Text lessonPreview
-
33.1 The Yukawa Particle and the Heisenberg Uncertainty Principle Revisited - Check yourself
6 questionsPreview
-
33.2 The Four Basic Forces
Text lessonPreview
-
33.2 The Four Basic Forces - Check yourself
6 questionsPreview
-
33.3 Accelerators Create Matter from Energy
Text lessonPreview
-
33.3 Accelerators Create Matter from Energy - Check yourself
6 questionsPreview
-
33.4 Particles, Patterns, and Conservation Laws
Text lessonPreview
-
33.4 Particles, Patterns, and Conservation Laws - Check yourself
6 questionsPreview
-
33.5 Quarks: Is That All There Is?
Text lessonPreview
-
33.5 Quarks: Is That All There Is? - Check yourself
6 questionsPreview
-
33.6 GUTs: The Unification of Forces
Text lessonPreview
-
33.6 GUTs: The Unification of Forces - Check yourself
6 questionsPreview
-
Unit 33 review quiz: Particle Physics
10 questionsPreview
Unit 34: Frontiers of Physics
0/16
-
Unit 34 overview: Frontiers of Physics
Text lessonPreview
-
34.1 Cosmology and Particle Physics
Text lessonPreview
-
34.1 Cosmology and Particle Physics - Check yourself
6 questionsPreview
-
34.2 General Relativity and Quantum Gravity
Text lessonPreview
-
34.2 General Relativity and Quantum Gravity - Check yourself
6 questionsPreview
-
34.3 Superstrings
Text lessonPreview
-
34.3 Superstrings - Check yourself
6 questionsPreview
-
34.4 Dark Matter and Closure
Text lessonPreview
-
34.4 Dark Matter and Closure - Check yourself
6 questionsPreview
-
34.5 Complexity and Chaos
Text lessonPreview
-
34.5 Complexity and Chaos - Check yourself
6 questionsPreview
-
34.6 High-temperature Superconductors
Text lessonPreview
-
34.6 High-temperature Superconductors - Check yourself
6 questionsPreview
-
34.7 Some Questions We Know to Ask
Text lessonPreview
-
34.7 Some Questions We Know to Ask - Check yourself
6 questionsPreview
-
Unit 34 review quiz: Frontiers of Physics
10 questionsPreview
Text lesson
13.5 Phase Changes
13.5 Phase Changes — COLLEGE PHYSICS FOR AP COURSES notes: You will be able to interpret a phase diagram, state Dalton’s law of partial pressures, identify the triple point of a substance, and describe equilibrium between a liquid and a gas, a liquid and a solid, and a gas and a solid.
1Real gases and liquefaction2Real gases and liquefaction
Real gases and liquefaction
Real gases and liquefaction
An ideal gas is a useful model, and real gases behave almost ideally at high temperatures.
At lower temperatures, however, the attractions between molecules and the volume the molecules themselves occupy can no longer be ignored.
The molecules come close enough to condense
so the volume drops sharply and the substance changes from a gas to a liquid.
If the liquid is cooled further, it becomes a solid.
The volume never reaches zero
because molecules always occupy a finite volume.
1 / 2Next ▶
Volume plotted against temperature for a real gas at constant pressure. The straight part follows ideal-gas behavior, the volume then drops suddenly when the gas liquefies, and it drops only slightly once the substance is solid. Image: OpenStax, College Physics for AP Courses 2e, CC BY 4.0.
Real gases and liquefaction
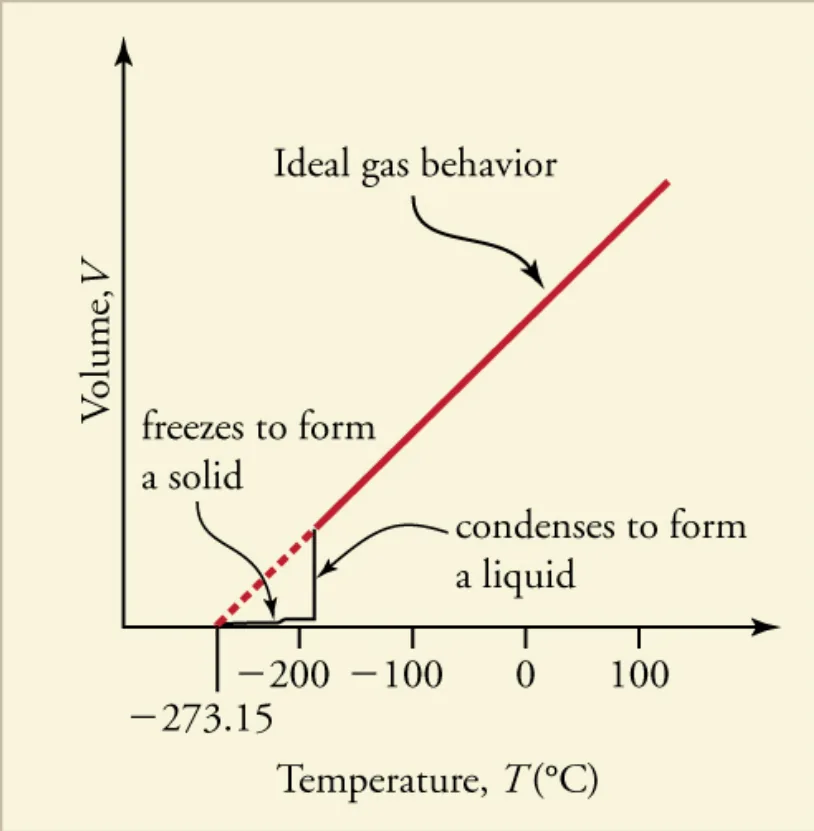 ⤢ Enlarge
1
A gas can also be turned into a liquid by raising its pressure. Carbon dioxide is a gas at room temperature and normal atmospheric pressure
but under high pressure it becomes a liquid. If the pressure is then reduced, the liquid evaporates rapidly, cools, and solidifies into a snow-like substance at about −78 °C. This solid is called dry ice.
2
Liquid nitrogen is another substance that is used in the liquid state.
3
It is made by liquefying atmospheric air through compression and cooling, and it boils at 77 K (−196 °C) at atmospheric pressure.
4
Because it is extremely cold, liquid nitrogen is used as a refrigerant to preserve blood, sperm and other biological materials.
5
It also reduces electrical noise in sensors and equipment, and it cools the current-carrying wires of such equipment.
6
In dermatology, liquid nitrogen is used to freeze and painlessly remove warts and other skin growths.
◀ Previous2 / 2
1PV diagrams2PV diagrams3PV diagrams
PV diagrams
PV diagrams
A PV diagram is a graph of pressure against volume that shows how a substance behaves.
When the substance acts as an ideal gas, the ideal gas law PV = NkT relates its pressure and volume.
Here P is the pressure in pascals (Pa), V is the volume in cubic metres (m3), N is the number of molecules (a pure number), k is the Boltzmann constant (1.38 × 10⁻²³ J/K),
and T is the absolute temperature in kelvin (K).
If the number of molecules and the temperature are fixed, the product PV stays constant
so the volume of the gas decreases as its pressure increases.
If the relationship between pressure and volume at a fixed temperature is plotted on a PV diagram, the result is a hyperbola.
Each such curve is called an isotherm.
1 / 3Next ▶
PV diagrams for a substance. Part (a) shows isotherms at several temperatures, and part (b) enlarges the low-temperature region where the gas can change into a liquid. Image: OpenStax, College Physics for AP Courses 2e, CC BY 4.0.
PV diagrams
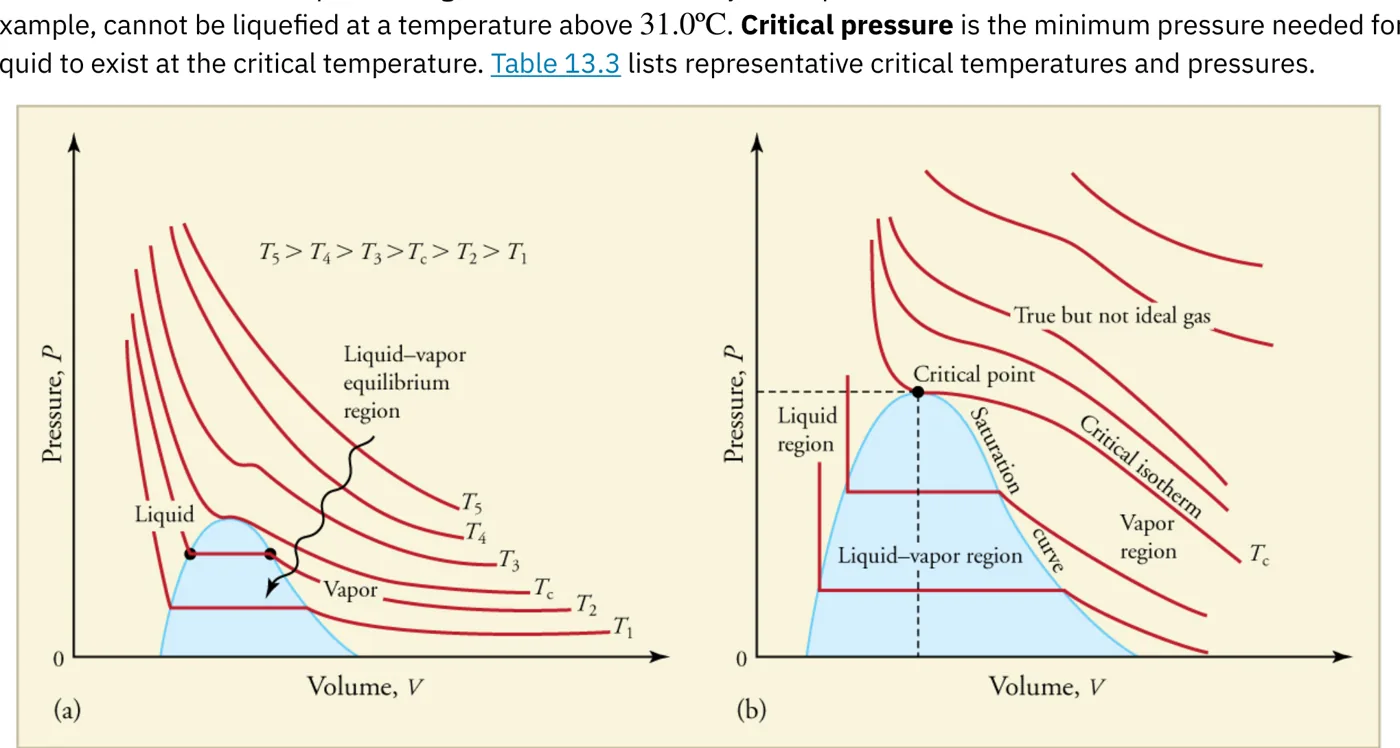 ⤢ Enlarge
PV diagrams
The upper isotherms, at higher temperatures, are hyperbolas and represent ideal-gas behavior.
The lower isotherms, at lower temperatures, bend away from hyperbolas because the gas is no longer ideal,
and they may even pass through a region where liquid is present.
Each isotherm has a critical point.
Above the critical temperature, a liquid cannot exist at any pressure.
At sufficiently high pressure above the critical temperature, the gas reaches the density of a liquid but does not condense.
The critical pressure is the minimum pressure needed for a liquid to exist at the critical temperature.
◀ Previous2 / 3Next ▶
PV diagrams
1
Carbon dioxide, for example, cannot be liquefied at any temperature above 31.1 °C (304.2 K).
2
In the low-temperature part of the diagram, a gas below its boiling temperature is called a vapor.
3
Table 13.3 lists the critical temperatures and pressures of several common substances.
| Substance | Critical temperature (K) | Critical temperature (°C) | Critical pressure (atm) |
|---|---|---|---|
| Water | 647.4 | 374.3 | 219.0 |
| Sulfur dioxide | 430.7 | 157.6 | 78.0 |
| Ammonia | 405.5 | 132.4 | 111.7 |
| Carbon dioxide | 304.2 | 31.1 | 73.2 |
| Oxygen | 154.8 | −118.4 | 50.3 |
| Nitrogen | 126.2 | −146.9 | 33.6 |
| Hydrogen | 33.3 | −239.9 | 12.9 |
| Helium | 5.3 | −267.9 | 2.27 |
◀ Previous3 / 3
1Phase diagrams2Phase diagrams3Phase diagrams
Phase diagrams
1
A plot of pressure against temperature is called a phase diagram.
2
Its regions show the conditions under which each phase of matter is stable.
3
Given a pressure and a temperature, the phase diagram tells you whether the substance is a solid, a liquid or a gas.
4
The solid lines between the regions are the boundaries where two phases coexist, existing together in amounts that depend on pressure and temperature.
5
The figure below is the phase diagram of water.
6
The boiling point of water is 100 °C (373 K) at 1.00 atm.
1 / 3Next ▶
Phase diagrams
Phase diagrams
As the pressure increases, the boiling temperature rises steadily, reaching about 374 °C at 218 atm.
A pressure cooker, or even a covered pot, cooks food faster because the water stays liquid at temperatures above 100 °C without boiling away.
The boiling curve ends at the critical point
because at higher temperatures the liquid phase cannot exist at any pressure.
The critical point occurs at the critical temperature
which for water is 647.4 K (374.3 °C) from Table 13.3.The critical temperature of oxygen is −118.4 °C (154.8 K), so oxygen cannot be liquefied above that temperature.
◀ Previous2 / 3Next ▶
Phase diagram of water, with pressure plotted against temperature. The axes are not linear and the diagram is not to scale, and it omits several exotic phases of ice that exist at very high pressure. Image: OpenStax, College Physics for AP Courses 2e, CC BY 4.0.
Phase diagrams
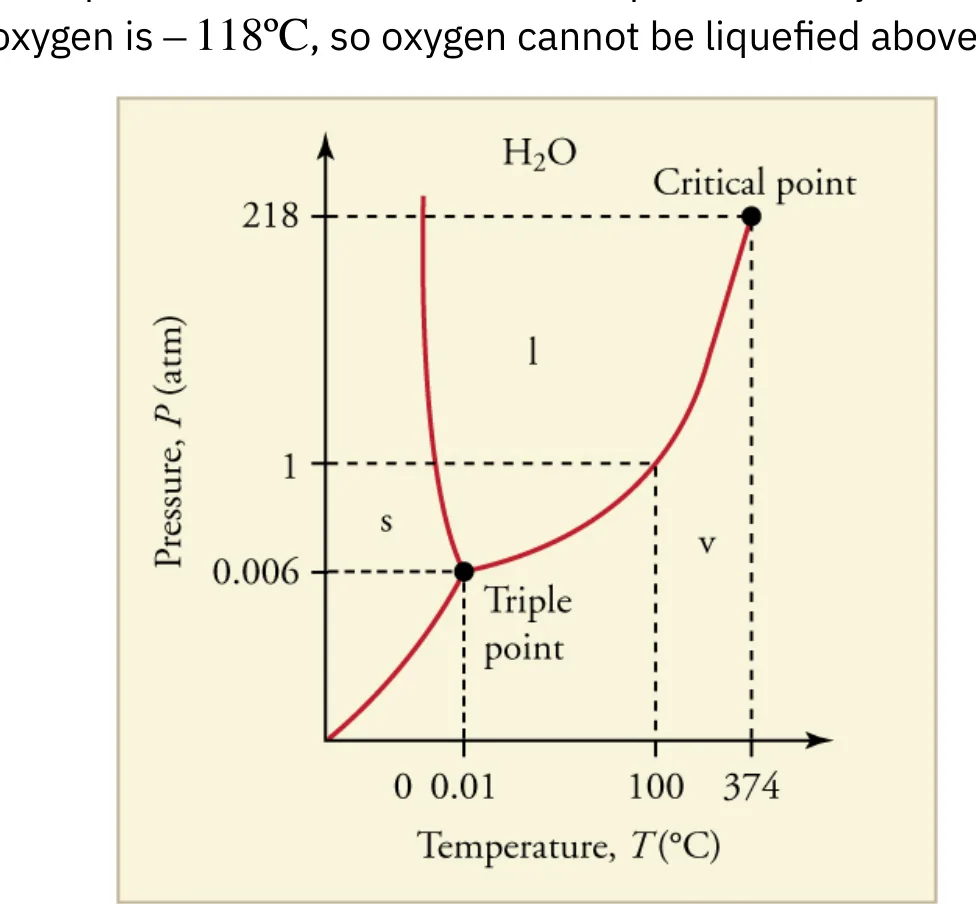 ⤢ Enlarge
1
The curve between the solid and liquid regions gives the melting temperature at each pressure.
2
At 1.00 atm the melting point of ice is 0 °C (273.15 K), as expected.
3
At a fixed temperature, you can change ice into water by increasing the pressure.
4
This is why ice can melt under the pressure of a snowball maker’s hands.
5
The melting curve of water leans backward: as the pressure rises, the melting temperature of ice falls.
6
This is why the weight and pressure of a car’s tires on snow melts the snowflakes
the water refreezes later and forms a layer of ice on the road.
◀ Previous3 / 3
1Sublimation and the triple point2Sublimation and the triple point
Sublimation and the triple point
Sublimation and the triple point
At pressures below 0.00600 atm, water has no liquid phase and can exist only as a solid or a gas.
The direct change from solid to gas is called sublimation.
Sublimation accounts for large losses of snowpack that never reach a river, for the automatic defrosting of a freezer,
and for the freeze-drying of many foods.
Carbon dioxide sublimates at the standard atmospheric pressure of 1 atm
because its triple point pressure, 5.11 atm, is higher than that.
Solid carbon dioxide is called dry ice because it does not melt
it passes directly from solid to gas.
All three curves on a phase diagram meet at a single point, the triple point
where solid, liquid and gas exist together in equilibrium.
1 / 2Next ▶
Sublimation and the triple point
Sublimation and the triple point
For water, the triple point occurs at 273.16 K (0.01 °C) and a pressure of 0.00600 atm.
This temperature is a more accurate calibration point for thermometers than the melting point of water at 1.00 atm
which is 273.15 K.
Table 13.4 gives the triple point values of other substances.
| Substance | Temperature (K) | Temperature (°C) | Pressure (atm) |
|---|---|---|---|
| Water | 273.16 | 0.01 | 0.00600 |
| Carbon dioxide | 216.55 | −56.60 | 5.11 |
| Sulfur dioxide | 197.68 | −75.47 | 0.0167 |
| Ammonia | 195.40 | −77.75 | 0.0600 |
| Nitrogen | 63.18 | −210.0 | 0.124 |
| Oxygen | 54.36 | −218.8 | 0.00151 |
| Hydrogen | 13.84 | −259.3 | 0.0697 |
◀ Previous2 / 2
1Equilibrium2Equilibrium
Equilibrium
1
A liquid and its gas are in equilibrium at the boiling temperature.
2
In a closed container at the boiling point, molecules escape from the liquid as a gas at the same rate at which gas molecules strike the liquid surface and rejoin it.
3
The amounts of liquid and gas therefore do not change.
4
The combination of temperature and pressure must be just right for this balance.
5
If the temperature and pressure both increase, the boiling and condensation rates increase together and equilibrium is maintained.
6
The figure below compares two equilibria at different temperatures.
1 / 2Next ▶
A liquid and its gas in a closed container at two temperatures. In both cases boiling and condensation occur at equal rates, and at the higher temperature both rates are faster and the gas pressure is higher. Image: OpenStax, College Physics for AP Courses 2e, CC BY 4.0.
Equilibrium
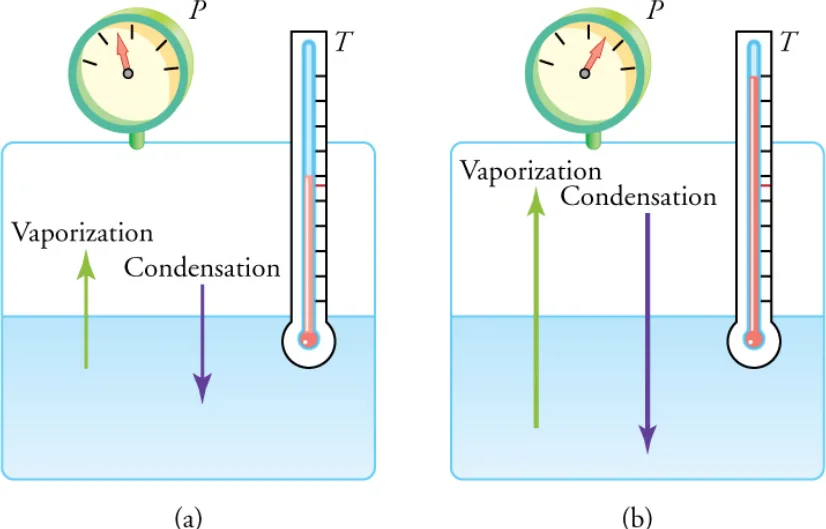 ⤢ Enlarge
1
Pure water at 100 °C and 1.00 atm can coexist with pure steam.
2
In an open pot, however, the water boils away completely
because the gas above the pot is mixed with air rather than being pure steam.
3
With air present, fewer water molecules return to the liquid.
4
Similarly, water at 25 °C and 1.00 atm lies in the liquid region, yet an open glass of it evaporates,
because the air around it is not saturated with water vapor.
5
If the glass is sealed, the liquid remains.
6
At 25 °C the gas phase of water is called a vapor
because the temperature is below the boiling temperature.
◀ Previous2 / 2
1Vapor pressure, partial pressure and Dalton’s law2Vapor pressure, partial pressure and Dalton’s law
Vapor pressure, partial pressure and Dalton’s law
Vapor pressure, partial pressure and Dalton’s law
Vapor pressure is the pressure at which a gas coexists with its solid or liquid phase. It is created by the fastest molecules
which break away from the liquid or solid and enter the gas phase. The vapor pressure of a substance depends on the substance and on its temperature, and it increases as the temperature increases.
Partial pressure is the pressure a gas would create if it occupied the whole volume available to the mixture alone.
In a mixture of gases that behave ideally and do not react chemically, the total pressure equals the sum of the partial pressures of the components.
This is Dalton’s law of partial pressures, named after the English scientist John Dalton (1766–1844), who proposed it.
Dalton’s law follows from kinetic theory: each gas produces its own pressure through molecular collisions, independent of the other gases present.
It is also consistent with the fact that pressures add according to Pascal’s principle.
1 / 2Next ▶
Vapor pressure, partial pressure and Dalton’s law
Vapor pressure, partial pressure and Dalton’s law
Water evaporates, and ice sublimates, when their vapor pressure is greater than the partial pressure of water vapor in the surrounding gas. If the vapor pressure is smaller than the partial pressure of water vapor in the surrounding gas, liquid droplets or ice crystals (frost) form instead.
◀ Previous2 / 2
Energy in phase changes and the PhET simulation
Energy in phase changes and the PhET simulation
Molecules in a solid or a liquid are bound to each other
because a force is required to separate them.
In a phase change from solid to liquid or from liquid to gas, a force must be exerted, perhaps by collisions, to pull the particles apart.
A force exerted through a distance is work
so energy must be supplied to do the work that separates the particles.
This is consistent with the need for energy to melt ice or boil water.
The converse is also true: going from gas to liquid or from liquid to solid involves particles pushing together,
so the particles do work and release energy.
The PhET simulation States of Matter lets you heat, cool and compress atoms and molecules and watch them change between solid, liquid and gas phases. It is a good way to see the energy changes described in this section.
1Check your understanding 1: a cup of ice water2Check your understanding 2: energy and phase changes3Worked example: partial pressure of the dry air in the atmos
Check your understanding 1: a cup of ice water
Check your understanding 1: a cup of ice water
Question: Why does a cup of water, or soda, with ice cubes stay at 0 °C even on a hot summer day?
Answer: The ice and the liquid water are in thermal equilibrium
so the temperature stays at the melting point for as long as ice remains. Only after all the ice has melted does the temperature of the drink start to rise.
1 / 3Next ▶
Check your understanding 2: energy and phase changes
1
Question: Is energy transfer involved in a phase change? Does energy have to be supplied to go from solid to liquid and from liquid to gas? What about gas to liquid and liquid to solid? Why are orange trees in Florida sprayed with water when the temperature is near or just below freezing?
2
Answer: Yes.
3
Melting and boiling require energy to be supplied
because the molecules must gain enough energy to break away from their neighbors.
4
Freezing and condensation release energy
because the molecules slow down and bind more tightly.
5
The orange trees are sprayed because water freezing on the blossoms and fruit releases energy,
which keeps the tissue at about 0 °C while the ice forms.
◀ Previous2 / 3Next ▶
Worked example: partial pressure of the dry air in the atmosphere
1
Air at a total pressure of 1.00 atm contains water vapor with a partial pressure of 0.0313 atm at 25 °C.
2
Using Dalton’s law, the partial pressure of the rest of the air is Pair = Ptotal − Pwater = 1.00 atm − 0.0313 atm = 0.969 atm.
3
The water vapor contributes only about 3 percent of the total pressure.
◀ Previous3 / 3
Key terms
| Term | Meaning |
|---|---|
| Real gas | A real gas is a gas whose molecules attract each other and occupy a finite volume, so it departs from ideal behavior at low temperatures. |
| Liquefaction | Liquefaction is the change of a gas into a liquid, which happens when the gas is cooled or compressed enough. |
| PV diagram | A PV diagram is a graph of pressure against volume that shows how a substance behaves at fixed conditions. |
| Isotherm | An isotherm is a curve on a PV diagram that shows how pressure and volume are related at one fixed temperature. |
| Critical temperature | The critical temperature is the temperature above which a liquid cannot exist at any pressure. |
| Critical pressure | The critical pressure is the minimum pressure needed for a liquid to exist at the critical temperature. |
| Critical point | The critical point is the end of a boiling curve, defined by the critical temperature and the critical pressure of a substance. |
| Phase diagram | A phase diagram is a graph of pressure against temperature that shows the regions where each phase of a substance is stable. |
| Boiling temperature | The boiling temperature is the temperature at which a liquid and its gas coexist in equilibrium at a given pressure. |
| Melting temperature | The melting temperature is the temperature at which a solid and its liquid coexist in equilibrium at a given pressure. |
| Sublimation | Sublimation is the direct change of a substance from the solid phase to the gas phase. |
| Dry ice | Dry ice is solid carbon dioxide, which sublimates at atmospheric pressure instead of melting. |
| Triple point | The triple point is the single combination of temperature and pressure at which solid, liquid and gas coexist in equilibrium. |
| Equilibrium | Equilibrium is the state in which two phases exchange molecules at equal rates, so their relative amounts do not change. |
| Vapor | A vapor is the gas phase of a substance at a temperature below its boiling temperature. |
| Vapor pressure | The vapor pressure is the pressure at which a gas coexists with its solid or liquid phase at a given temperature. |
| Partial pressure | The partial pressure of a gas is the pressure that gas would produce if it alone occupied the total volume. |
| Dalton’s law of partial pressures | Dalton’s law states that the total pressure of an ideal, non-reacting gas mixture equals the sum of the partial pressures of its components. |
1Avoid these mistakes2Avoid these mistakes3Avoid these mistakes
Avoid these mistakes
1Avoid this
Assuming water always boils at 100 °C. The boiling temperature depends on pressure: it is higher in a pressure cooker and lower at high altitude.Avoid this
2Avoid this
Believing that a gas can be liquefied at any temperature by compression alone. Above the critical temperature, no liquid can exist at any pressure.Avoid this
3Avoid this
Thinking the melting curve of water slopes upward. For water, the melting temperature falls as the pressure increases.Avoid this
1 / 3Next ▶
Avoid these mistakes
4Avoid this
Assuming the temperature of an ice-water mixture rises immediately. It stays at 0 °C until all the ice has melted.Avoid this
5Avoid this
Thinking an open glass of water at room temperature remains unchanged. It evaporates because the surrounding air is not saturated with water vapor.Avoid this
6Avoid this
Calling a solid-to-gas change melting. Dry ice sublimates at 1 atm because no liquid phase exists at that pressure.Avoid this
◀ Previous2 / 3Next ▶
Avoid these mistakes
7Avoid this
Using the total pressure in place of the partial pressure of one gas in a mixture when applying Dalton’s law.Avoid this
◀ Previous3 / 3