Curriculum
AQA A Level Physics 7408
1. Measurements and Their Errors
0/15
-
1. Measurements and Their Errors
 Text lessonPreview
-
1.1.2 Powers of Ten
Text lessonPreview
-
1.1.2 Powers of Ten - Check yourself
 6 questionsPreview
-
1.1.3 Estimating Physical Quantities
Text lessonPreview
-
1.1.3 Estimating Physical Quantities - Check yourself
6 questionsPreview
-
1.2.1 SI Units
Text lessonPreview
-
1.2.1 SI Units - Check yourself
6 questionsPreview
-
1.2.1 Sources of Uncertainty
Text lessonPreview
-
1.2.1 Sources of Uncertainty - Check yourself
6 questionsPreview
-
1.2.3 Determining Uncertainties from Graphs
Text lessonPreview
-
1.2.3 Determining Uncertainties from Graphs - Check yourself
6 questionsPreview
-
1.3.2 Calculating Uncertainties
Text lessonPreview
-
1.3.2 Calculating Uncertainties - Check yourself
6 questionsPreview
-
1.1.1 SI Units
Text lessonPreview
-
1.2.2 Calculating Uncertainties
Text lessonPreview
2. Particles and Radiation
0/58
-
2. Particles and Radiation
Text lessonPreview
-
2.1.3 Strong Nuclear Force
Text lessonPreview
-
2.1.3 Strong Nuclear Force - Check yourself
6 questionsPreview
-
2.1.4 Alpha and Beta Decay
Text lessonPreview
-
2.1.4 Alpha and Beta Decay - Check yourself
6 questionsPreview
-
2.1.5 Particles, Antiparticles and Photons
Text lessonPreview
-
2.1.5 Particles, Antiparticles and Photons - Check yourself
6 questionsPreview
-
2.2.1 Hadrons
Text lessonPreview
-
2.2.1 Hadrons - Check yourself
6 questionsPreview
-
2.2.2 Baryons
Text lessonPreview
-
2.2.2 Baryons - Check yourself
6 questionsPreview
-
2.2.3 Mesons
Text lessonPreview
-
2.2.3 Mesons - Check yourself
6 questionsPreview
-
2.2.4 Leptons
Text lessonPreview
-
2.2.4 Leptons - Check yourself
6 questionsPreview
-
2.2.5 Quarks and Antiquarks
Text lessonPreview
-
2.2.5 Quarks and Antiquarks - Check yourself
6 questionsPreview
-
2.2.6 Strange Quarks
Text lessonPreview
-
2.2.6 Strange Quarks - Check yourself
6 questionsPreview
-
2.2.7 Collaborative Efforts in Particle Physics
Text lessonPreview
-
2.2.7 Collaborative Efforts in Particle Physics - Check yourself
6 questionsPreview
-
2.3.1 The Four Fundamental Interactions
Text lessonPreview
-
2.3.1 The Four Fundamental Interactions - Check yourself
6 questionsPreview
-
2.3.2 The Electromagnetic and Strong Force
Text lessonPreview
-
2.3.2 The Electromagnetic and Strong Force - Check yourself
6 questionsPreview
-
2.3.3 The Weak Interaction
Text lessonPreview
-
2.3.3 The Weak Interaction - Check yourself
6 questionsPreview
-
2.3.4 Feynman Diagrams
Text lessonPreview
-
2.3.4 Feynman Diagrams - Check yourself
6 questionsPreview
-
2.3.5 Application of Conservation Laws
Text lessonPreview
-
2.3.5 Application of Conservation Laws - Check yourself
6 questionsPreview
-
2.4.2 Threshold Frequency and Work Function
Text lessonPreview
-
2.4.2 Threshold Frequency and Work Function - Check yourself
6 questionsPreview
-
2.5.1 Collisions of Electrons with Atoms
Text lessonPreview
-
2.5.1 Collisions of Electrons with Atoms - Check yourself
6 questionsPreview
-
2.5.2 The Photoelectric Equation
Text lessonPreview
-
2.5.2 The Photoelectric Equation - Check yourself
6 questionsPreview
-
2.5.2 Energy Levels and Photon Emission
Text lessonPreview
-
2.5.2 Energy Levels and Photon Emission - Check yourself
6 questionsPreview
-
2.5.5 Diffraction Effects of Momentum
Text lessonPreview
-
2.5.5 Diffraction Effects of Momentum - Check yourself
6 questionsPreview
-
2.5.6 Analysis of the Nature of Matter
Text lessonPreview
-
2.5.6 Analysis of the Nature of Matter - Check yourself
6 questionsPreview
-
11.1.2 Atomic Structure
Text lessonPreview
-
11.1.2 Atomic Structure - Check yourself
6 questionsPreview
-
11.1.3 Nucleon and Proton Number
Text lessonPreview
-
22.1.3 The Electronvolt
Text lessonPreview
-
22.1.3 The Electronvolt - Check yourself
6 questionsPreview
-
22.3.1 Wave-Particle Duality
Text lessonPreview
-
22.3.1 Wave-Particle Duality - Check yourself
6 questionsPreview
-
22.3.2 The de Broglie Wavelength
Text lessonPreview
-
22.3.2 The de Broglie Wavelength - Check yourself
6 questionsPreview
-
2.1.1 Atomic Structure
Text lessonPreview
-
2.1.2 Nucleon and Proton Number
Text lessonPreview
-
2.4.1 The Electronvolt
Text lessonPreview
-
2.4.3 The Photoelectric Equation
Text lessonPreview
-
2.5.3 Wave-Particle Duality
Text lessonPreview
-
2.5.4 The de Broglie Wavelength
Text lessonPreview
3. Waves
0/39
-
3. Waves
Text lessonPreview
-
3.1.2 Longitudinal and Transverse Waves
Text lessonPreview
-
3.1.2 Longitudinal and Transverse Waves - Check yourself
6 questionsPreview
-
3.2.2 Formation of Stationary Waves
Text lessonPreview
-
3.2.2 Formation of Stationary Waves - Check yourself
6 questionsPreview
-
3.2.3 Harmonics
Text lessonPreview
-
3.2.3 Harmonics - Check yourself
6 questionsPreview
-
3.2.4 Required Practical- Investigating Stationary Waves
Text lessonPreview
-
3.2.4 Required Practical- Investigating Stationary Waves - Check yourself
6 questionsPreview
-
3.3.1 Path Difference and Coherence
Text lessonPreview
-
3.3.1 Path Difference and Coherence - Check yourself
6 questionsPreview
-
3.3.2 Demonstrating Interference
Text lessonPreview
-
3.3.2 Demonstrating Interference - Check yourself
6 questionsPreview
-
3.3.4 Developing Theories of EM Radiation
Text lessonPreview
-
3.3.4 Developing Theories of EM Radiation - Check yourself
6 questionsPreview
-
3.3.5 Required Practical- Young's Slit Experiment and Diffraction Gratings
Text lessonPreview
-
3.3.5 Required Practical- Young's Slit Experiment and Diffraction Gratings - Check yourself
6 questionsPreview
-
3.4.1 Single Slit Diffraction
Text lessonPreview
-
3.4.1 Single Slit Diffraction - Check yourself
6 questionsPreview
-
3.5.1 Refraction at a Plane Surface
Text lessonPreview
-
3.5.1 Refraction at a Plane Surface - Check yourself
6 questionsPreview
-
3.5.2 Snell's Law
Text lessonPreview
-
3.5.2 Snell's Law - Check yourself
6 questionsPreview
-
3.5.3 Fibre Optics
Text lessonPreview
-
3.5.3 Fibre Optics - Check yourself
6 questionsPreview
-
7.1.1 Progressive Waves
Text lessonPreview
-
7.1.1 Progressive Waves - Check yourself
6 questionsPreview
-
7.5.1 Polarisation
Text lessonPreview
-
7.5.1 Polarisation - Check yourself
6 questionsPreview
-
8.1.2 Stationary Waves
Text lessonPreview
-
8.1.2 Stationary Waves - Check yourself
6 questionsPreview
-
8.3.3 Young's Double Slit Experiment
Text lessonPreview
-
8.3.3 Young's Double Slit Experiment - Check yourself
6 questionsPreview
-
8.4.1 The Diffraction Grating
Text lessonPreview
-
8.4.1 The Diffraction Grating - Check yourself
6 questionsPreview
-
3.1.1 Progressive Waves
Text lessonPreview
-
3.1.3 Polarisation
Text lessonPreview
-
3.3.3 Young's Double-Slit Experiment
Text lessonPreview
-
3.4.2 The Diffraction Grating
Text lessonPreview
4. Mechanics and Materials
0/77
-
4. Mechanics and Materials
Text lessonPreview
-
1.1.5 Resolving Vectors
Text lessonPreview
-
1.1.5 Resolving Vectors - Check yourself
6 questionsPreview
-
1.4.1 Scalars and Vectors
Text lessonPreview
-
1.4.1 Scalars and Vectors - Check yourself
6 questionsPreview
-
1.6.6 Elastic Strain Energy
Text lessonPreview
-
1.6.6 Elastic Strain Energy - Check yourself
6 questionsPreview
-
2.1.2 Motion Graphs
Text lessonPreview
-
2.1.9 Projectile Motion
Text lessonPreview
-
2.1.9 Projectile Motion - Check yourself
6 questionsPreview
-
3.1.3 Linear Momentum
Text lessonPreview
-
3.1.3 Linear Momentum - Check yourself
6 questionsPreview
-
3.2.2 Terminal Velocity
Text lessonPreview
-
3.2.2 Terminal Velocity - Check yourself
6 questionsPreview
-
3.3.1 Conservation of Momentum
Text lessonPreview
-
3.3.1 Conservation of Momentum - Check yourself
6 questionsPreview
-
4.1.1 Impulse
Text lessonPreview
-
4.1.1 Impulse - Check yourself
6 questionsPreview
-
4.1.2 Moments
Text lessonPreview
-
4.1.2 Moments - Check yourself
6 questionsPreview
-
4.2.2 Couples
Text lessonPreview
-
4.2.2 Couples - Check yourself
6 questionsPreview
-
4.2.3 Centre of Mass
Text lessonPreview
-
4.2.3 Centre of Mass - Check yourself
6 questionsPreview
-
4.3.1 Motion Along a Straight Line
Text lessonPreview
-
4.3.1 Motion Along a Straight Line - Check yourself
6 questionsPreview
-
4.3.1 Density
Text lessonPreview
-
4.3.1 Density - Check yourself
6 questionsPreview
-
4.3.3 SUVAT Equations
Text lessonPreview
-
4.3.3 SUVAT Equations - Check yourself
6 questionsPreview
-
4.3.5 Drag Forces
Text lessonPreview
-
4.3.5 Drag Forces - Check yourself
6 questionsPreview
-
4.3.7 Required Practical- Determination of g
Text lessonPreview
-
4.3.7 Required Practical- Determination of g - Check yourself
6 questionsPreview
-
4.4.1 Newton’s First Law
Text lessonPreview
-
4.4.1 Newton’s First Law - Check yourself
6 questionsPreview
-
4.4.2 Newton's Second Law
Text lessonPreview
-
4.4.2 Newton's Second Law - Check yourself
6 questionsPreview
-
4.4.3 Newton's Third Law
Text lessonPreview
-
4.4.3 Newton's Third Law - Check yourself
6 questionsPreview
-
4.5.4 Impulse on a Force-Time Graph
Text lessonPreview
-
4.5.4 Impulse on a Force-Time Graph - Check yourself
6 questionsPreview
-
4.5.5 Collisions
Text lessonPreview
-
4.5.5 Collisions - Check yourself
6 questionsPreview
-
4.6.1 Work and Power
Text lessonPreview
-
4.6.1 Work and Power - Check yourself
6 questionsPreview
-
4.6.2 Area Under a Force-Displacement Graph
Text lessonPreview
-
4.6.2 Area Under a Force-Displacement Graph - Check yourself
6 questionsPreview
-
4.6.4 Conservation of Energy
Text lessonPreview
-
4.6.4 Conservation of Energy - Check yourself
6 questionsPreview
-
4.6.5 Kinetic and Gravitational Potential Energy
Text lessonPreview
-
4.6.5 Kinetic and Gravitational Potential Energy - Check yourself
6 questionsPreview
-
4.7.3 Stress and Strain
Text lessonPreview
-
4.7.3 Stress and Strain - Check yourself
6 questionsPreview
-
4.7.6 Energy Conservation
Text lessonPreview
-
4.7.6 Energy Conservation - Check yourself
6 questionsPreview
-
4.8.2 Required Practical- The Young Modulus
Text lessonPreview
-
4.8.2 Required Practical- The Young Modulus - Check yourself
6 questionsPreview
-
5.1.3 Efficiency
Text lessonPreview
-
5.1.3 Efficiency - Check yourself
6 questionsPreview
-
6.1.2 Hooke's Law
Text lessonPreview
-
6.1.2 Hooke's Law - Check yourself
6 questionsPreview
-
6.1.3 The Young Modulus
Text lessonPreview
-
6.1.3 The Young Modulus - Check yourself
6 questionsPreview
-
6.2.1 Elastic and Plastic Behaviour
Text lessonPreview
-
6.2.1 Elastic and Plastic Behaviour - Check yourself
6 questionsPreview
-
4.1.1 Scalars and Vectors
Text lessonPreview
-
4.1.2 Resolving Vectors
Text lessonPreview
-
4.2.1 Moments
Text lessonPreview
-
4.3.2 Motion Graphs
Text lessonPreview
-
4.3.4 Projectile Motion
Text lessonPreview
-
4.3.6 Terminal Velocity
Text lessonPreview
-
4.5.1 Linear Momentum
Text lessonPreview
-
4.5.2 Conservation of Momentum
Text lessonPreview
-
4.7.2 Hooke's Law
Text lessonPreview
-
4.7.4 Elastic Strain Energy
Text lessonPreview
-
4.7.5 Elastic and Plastic Behaviour
Text lessonPreview
5. Electricity
0/25
-
5. Electricity
Text lessonPreview
-
5.1.1 Basics of Electricity
Text lessonPreview
-
5.1.1 Basics of Electricity - Check yourself
6 questionsPreview
-
5.1.2 Current–Voltage Characteristics
Text lessonPreview
-
5.1.2 Current–Voltage Characteristics - Check yourself
6 questionsPreview
-
5.2.2 Resistance in a Thermistor
Text lessonPreview
-
5.2.2 Resistance in a Thermistor - Check yourself
6 questionsPreview
-
5.2.3 Superconductivity
Text lessonPreview
-
5.2.3 Superconductivity - Check yourself
6 questionsPreview
-
5.2.4 Required Practical- Investigating Resistivity
Text lessonPreview
-
5.2.4 Required Practical- Investigating Resistivity - Check yourself
6 questionsPreview
-
5.3.1 Resistors in Series and Parallel
Text lessonPreview
-
5.3.1 Resistors in Series and Parallel - Check yourself
6 questionsPreview
-
5.3.2 Series and Parallel Circuits
Text lessonPreview
-
5.3.2 Series and Parallel Circuits - Check yourself
6 questionsPreview
-
5.3.3 Electrical Energy and Power
Text lessonPreview
-
5.3.3 Electrical Energy and Power - Check yourself
6 questionsPreview
-
5.3.4 Potential Divider Circuits
Text lessonPreview
-
5.3.4 Potential Divider Circuits - Check yourself
6 questionsPreview
-
5.4.1 Electromotive Force and Internal Resistance
Text lessonPreview
-
5.4.1 Electromotive Force and Internal Resistance - Check yourself
6 questionsPreview
-
5.4.2 Required Practical- Investigating EMF and Internal Resistance
Text lessonPreview
-
5.4.2 Required Practical- Investigating EMF and Internal Resistance - Check yourself
6 questionsPreview
-
9.3.4 Resistivity
Text lessonPreview
-
9.3.4 Resistivity - Check yourself
6 questionsPreview
6. Further Mechanics and Thermal Physics
0/77
-
6. Further Mechanics and Thermal Physics
Text lessonPreview
-
4.2.5 Centripetal Force
Text lessonPreview
-
4.2.5 Centripetal Force - Check yourself
6 questionsPreview
-
5.2.5 Average Molecular Kinetic Energy
Text lessonPreview
-
5.2.5 Average Molecular Kinetic Energy - Check yourself
6 questionsPreview
-
5.5.1 Conditions for Simple Harmonic Motion
Text lessonPreview
-
5.5.1 Conditions for Simple Harmonic Motion - Check yourself
6 questionsPreview
-
5.6.4 Free and Forced Oscillations
Text lessonPreview
-
5.6.4 Free and Forced Oscillations - Check yourself
6 questionsPreview
-
6.1.1 Circular Motion
Text lessonPreview
-
6.1.1 Circular Motion - Check yourself
6 questionsPreview
-
6.1.2 Radians
Text lessonPreview
-
6.1.2 Radians - Check yourself
6 questionsPreview
-
6.2.3 Calculating Maximum Speed and Acceleration
Text lessonPreview
-
6.2.3 Calculating Maximum Speed and Acceleration - Check yourself
6 questionsPreview
-
6.2.4 Period of Mass-Spring System
Text lessonPreview
-
6.2.4 Period of Mass-Spring System - Check yourself
6 questionsPreview
-
6.2.5 Period of Simple Pendulum
Text lessonPreview
-
6.2.5 Period of Simple Pendulum - Check yourself
6 questionsPreview
-
6.2.6 Harmonic Oscillators in Context
Text lessonPreview
-
6.2.6 Harmonic Oscillators in Context - Check yourself
6 questionsPreview
-
6.2.8 Required Practical- Investigating SHM
Text lessonPreview
-
6.2.8 Required Practical- Investigating SHM - Check yourself
6 questionsPreview
-
6.4.4 Latent Heat Capacity
Text lessonPreview
-
6.4.4 Latent Heat Capacity - Check yourself
6 questionsPreview
-
6.5.1 The Kelvin Scale and Absolute Zero
Text lessonPreview
-
6.5.1 The Kelvin Scale and Absolute Zero - Check yourself
6 questionsPreview
-
6.5.2 Gas Laws
Text lessonPreview
-
6.5.2 Gas Laws - Check yourself
6 questionsPreview
-
6.5.5 Avogadro, Molar Gas and Boltzmann Constant
Text lessonPreview
-
6.5.5 Avogadro, Molar Gas and Boltzmann Constant - Check yourself
6 questionsPreview
-
6.5.6 Required Practical- Investigating Gas Laws
Text lessonPreview
-
6.5.6 Required Practical- Investigating Gas Laws - Check yourself
6 questionsPreview
-
6.6.1 Gas Laws v Kinetic Theory
Text lessonPreview
-
6.6.1 Gas Laws v Kinetic Theory - Check yourself
6 questionsPreview
-
6.6.4 Brownian Motion
Text lessonPreview
-
6.6.4 Brownian Motion - Check yourself
6 questionsPreview
-
6.6.5 Evolving Models of Gas Behaviour
Text lessonPreview
-
6.6.5 Evolving Models of Gas Behaviour - Check yourself
6 questionsPreview
-
9.2.3 Kinetic Theory of Gases Equation
Text lessonPreview
-
9.2.3 Kinetic Theory of Gases Equation - Check yourself
6 questionsPreview
-
12.1.2 Angular Speed
Text lessonPreview
-
12.1.2 Angular Speed - Check yourself
6 questionsPreview
-
12.2.1 Centripetal Acceleration
Text lessonPreview
-
14.3.1 Specific Heat Capacity
Text lessonPreview
-
14.3.1 Specific Heat Capacity - Check yourself
6 questionsPreview
-
15.2.2 Ideal Gas Equation
Text lessonPreview
-
15.2.2 Ideal Gas Equation - Check yourself
12 questionsPreview
-
16.1.1 Internal energy
Text lessonPreview
-
16.1.1 Internal energy - Check yourself
6 questionsPreview
-
16.2.1 Work Done by a Gas
Text lessonPreview
-
16.2.1 Work Done by a Gas - Check yourself
6 questionsPreview
-
16.2.2 The First Law of Thermodynamics
Text lessonPreview
-
16.2.2 The First Law of Thermodynamics - Check yourself
6 questionsPreview
-
17.1.5 SHM Graphs
Text lessonPreview
-
17.1.5 SHM Graphs - Check yourself
6 questionsPreview
-
17.2.1 Energy in SHM
Text lessonPreview
-
17.2.1 Energy in SHM - Check yourself
6 questionsPreview
-
17.3.1 Damping
Text lessonPreview
-
17.3.1 Damping - Check yourself
6 questionsPreview
-
17.3.2 Resonance
Text lessonPreview
-
17.3.2 Resonance - Check yourself
6 questionsPreview
-
6.1.3 Angular Speed
Text lessonPreview
-
6.1.4 Centripetal Acceleration
Text lessonPreview
-
6.1.5 Centripetal Force
Text lessonPreview
-
6.2.1 Conditions for Simple Harmonic Motion
Text lessonPreview
-
6.2.2 SHM Graphs
Text lessonPreview
-
6.2.7 Energy in SHM
Text lessonPreview
-
6.3.1 Damping
Text lessonPreview
-
6.3.2 Free and Forced Oscillations
Text lessonPreview
-
6.4.1 Internal Energy
Text lessonPreview
-
6.4.2 The First Law of Thermodynamics
Text lessonPreview
-
6.4.3 Specific Heat Capacity
Text lessonPreview
-
6.5.3 Ideal Gas Equation
Text lessonPreview
-
6.5.4 Work Done by a Gas
Text lessonPreview
-
6.6.2 Kinetic Theory of Gases Equation
Text lessonPreview
-
6.6.3 Average Molecular Kinetic Energy
Text lessonPreview
7. Fields and Their Consequences
0/111
-
7. Fields and Their Consequences
Text lessonPreview
-
4.3.2 Electric Field Strength
Text lessonPreview
-
4.3.2 Electric Field Strength - Check yourself
6 questionsPreview
-
4.4.2 Energy Stored by a Capacitor
Text lessonPreview
-
4.4.2 Energy Stored by a Capacitor - Check yourself
6 questionsPreview
-
4.5.3 Magnetic Force on a Current-Carrying Conductor
Text lessonPreview
-
4.5.3 Magnetic Force on a Current-Carrying Conductor - Check yourself
6 questionsPreview
-
7.1.1 Force Fields
Text lessonPreview
-
7.1.1 Force Fields - Check yourself
6 questionsPreview
-
7.1.3 Representing Gravitational Fields
Text lessonPreview
-
7.1.3 Representing Gravitational Fields - Check yourself
6 questionsPreview
-
7.1.4 Newton's Law of Gravitation
Text lessonPreview
-
7.1.4 Newton's Law of Gravitation - Check yourself
6 questionsPreview
-
7.1.5 Gravitational Field Strength in a Radial Field
Text lessonPreview
-
7.1.5 Gravitational Field Strength in a Radial Field - Check yourself
6 questionsPreview
-
7.2.2 Calculating Gravitational Potential
Text lessonPreview
-
7.2.2 Calculating Gravitational Potential - Check yourself
6 questionsPreview
-
7.2.3 Graphical Representation of Gravitational Potential
Text lessonPreview
-
7.2.3 Graphical Representation of Gravitational Potential - Check yourself
6 questionsPreview
-
7.2.4 Work Done on a Mass
Text lessonPreview
-
7.2.4 Work Done on a Mass - Check yourself
6 questionsPreview
-
7.3.2 Energy of an Orbiting Satellite
Text lessonPreview
-
7.3.2 Energy of an Orbiting Satellite - Check yourself
6 questionsPreview
-
7.3.3 Escape Velocity
Text lessonPreview
-
7.3.3 Escape Velocity - Check yourself
6 questionsPreview
-
7.4.1 Coulomb's Law
Text lessonPreview
-
7.4.1 Coulomb's Law - Check yourself
6 questionsPreview
-
7.4.4 Uniform Electric Field
Text lessonPreview
-
7.4.4 Uniform Electric Field - Check yourself
6 questionsPreview
-
7.4.6 Radial Electric Field
Text lessonPreview
-
7.4.6 Radial Electric Field - Check yourself
6 questionsPreview
-
7.4.7 Comparing Gravitational and Electrostatic Forces
Text lessonPreview
-
7.4.7 Comparing Gravitational and Electrostatic Forces - Check yourself
6 questionsPreview
-
7.5.2 Graphical Representation of Electric Potential
Text lessonPreview
-
7.5.2 Graphical Representation of Electric Potential - Check yourself
6 questionsPreview
-
7.5.3 Work Done on a Charge
Text lessonPreview
-
7.5.3 Work Done on a Charge - Check yourself
6 questionsPreview
-
7.6.2 Parallel Plate Capacitor
Text lessonPreview
-
7.6.2 Parallel Plate Capacitor - Check yourself
6 questionsPreview
-
7.7.1 Charge and Discharge Graphs
Text lessonPreview
-
7.7.1 Charge and Discharge Graphs - Check yourself
6 questionsPreview
-
7.7.2 The Time Constant
Text lessonPreview
-
7.7.2 The Time Constant - Check yourself
6 questionsPreview
-
7.7.3 Charge and Discharge Equations
Text lessonPreview
-
7.7.3 Charge and Discharge Equations - Check yourself
6 questionsPreview
-
7.7.4 Required Practical- Charging and Discharging Capacitors
Text lessonPreview
-
7.7.4 Required Practical- Charging and Discharging Capacitors - Check yourself
6 questionsPreview
-
7.8.5 Circular Path of Particles
Text lessonPreview
-
7.8.5 Circular Path of Particles - Check yourself
6 questionsPreview
-
7.8.6 Required Practical- Investigating Magnetic Fields in Wires
Text lessonPreview
-
7.8.6 Required Practical- Investigating Magnetic Fields in Wires - Check yourself
6 questionsPreview
-
7.9.5 Applications of EM Induction
Text lessonPreview
-
7.9.5 Applications of EM Induction - Check yourself
6 questionsPreview
-
7.9.6 Required Practical- Investigating Flux Linkage on a Search Coil
Text lessonPreview
-
7.9.6 Required Practical- Investigating Flux Linkage on a Search Coil - Check yourself
6 questionsPreview
-
7.10.2 The Operation of an Oscilloscope
Text lessonPreview
-
7.10.2 The Operation of an Oscilloscope - Check yourself
6 questionsPreview
-
7.10.3 The Operation of a Transformer
Text lessonPreview
-
7.10.3 The Operation of a Transformer - Check yourself
6 questionsPreview
-
7.10.4 Transformer Efficiency
Text lessonPreview
-
7.10.4 Transformer Efficiency - Check yourself
6 questionsPreview
-
7.10.5 Transformer Inefficiencies
Text lessonPreview
-
7.10.5 Transformer Inefficiencies - Check yourself
6 questionsPreview
-
13.2.3 Circular Orbits in Gravitational Fields
Text lessonPreview
-
13.2.3 Circular Orbits in Gravitational Fields - Check yourself
6 questionsPreview
-
13.2.4 Geostationary Orbits
Text lessonPreview
-
13.2.4 Geostationary Orbits - Check yourself
6 questionsPreview
-
13.3.1 Gravitational Field Strength
Text lessonPreview
-
13.3.1 Gravitational Field Strength - Check yourself
6 questionsPreview
-
13.4.1 Gravitational Potential
Text lessonPreview
-
13.4.1 Gravitational Potential - Check yourself
6 questionsPreview
-
18.1.2 Electric Field Lines
Text lessonPreview
-
18.1.2 Electric Field Lines - Check yourself
6 questionsPreview
-
18.2.2 Motion of Charged Particles
Text lessonPreview
-
18.2.2 Motion of Charged Particles - Check yourself
6 questionsPreview
-
18.5.1 Electric Potential
Text lessonPreview
-
18.5.1 Electric Potential - Check yourself
6 questionsPreview
-
19.1.1 Capacitance
Text lessonPreview
-
19.1.1 Capacitance - Check yourself
6 questionsPreview
-
20.2.1 Magnetic Flux Density
Text lessonPreview
-
20.2.1 Magnetic Flux Density - Check yourself
6 questionsPreview
-
20.3.1 Fleming's Left-Hand Rule
Text lessonPreview
-
20.3.1 Fleming's Left-Hand Rule - Check yourself
6 questionsPreview
-
20.3.2 Force on a Moving Charge
Text lessonPreview
-
20.3.2 Force on a Moving Charge - Check yourself
6 questionsPreview
-
20.5.1 Magnetic Flux
Text lessonPreview
-
20.5.1 Magnetic Flux - Check yourself
6 questionsPreview
-
20.5.2 Magnetic Flux Linkage
Text lessonPreview
-
20.5.2 Magnetic Flux Linkage - Check yourself
6 questionsPreview
-
20.5.3 Principles of Electromagnetic Induction
Text lessonPreview
-
20.5.3 Principles of Electromagnetic Induction - Check yourself
6 questionsPreview
-
20.5.4 Faraday's and Lenz's Laws
Text lessonPreview
-
20.5.4 Faraday's and Lenz's Laws - Check yourself
6 questionsPreview
-
21.1.1 Alternating Current and Voltage
Text lessonPreview
-
21.1.1 Alternating Current and Voltage - Check yourself
6 questionsPreview
-
7.10.1 Alternating Current and Voltage
Text lessonPreview
-
7.3.1 Circular Orbits in Gravitational Fields
Text lessonPreview
-
7.3.4 Geostationary Orbits
Text lessonPreview
-
7.4.2 Electric Field Lines
Text lessonPreview
-
7.4.3 Electric Field Strength
Text lessonPreview
-
7.4.5 Motion of Charged Particles
Text lessonPreview
-
7.6.1 Capacitance
Text lessonPreview
-
7.6.3 Energy Stored by a Capacitor
Text lessonPreview
-
7.8.1 Magnetic Flux Density
Text lessonPreview
-
7.8.2 Magnetic Force on a Current-Carrying Conductor
Text lessonPreview
-
7.8.3 Fleming's Left Hand Rule
Text lessonPreview
-
7.8.4 Force on a Moving Charge
Text lessonPreview
-
7.9.1 Magnetic Flux
Text lessonPreview
-
7.9.2 Magnetic Flux Linkage
Text lessonPreview
-
7.9.3 Principles of Electromagnetic Induction
Text lessonPreview
-
7.9.4 Faraday's and Lenz's Laws
Text lessonPreview
8. Nuclear Physics
0/56
-
8. Nuclear Physics
Text lessonPreview
-
5.4.1 Background Radiation
Text lessonPreview
-
5.4.1 Background Radiation - Check yourself
6 questionsPreview
-
5.4.2 Alpha, Beta and Gamma Radiation
Text lessonPreview
-
5.4.2 Alpha, Beta and Gamma Radiation - Check yourself
6 questionsPreview
-
8.1.1 Rutherford Scattering
Text lessonPreview
-
8.1.1 Rutherford Scattering - Check yourself
6 questionsPreview
-
8.1.2 Changing Models of the Nucleus
Text lessonPreview
-
8.1.2 Changing Models of the Nucleus - Check yourself
6 questionsPreview
-
8.1.4 Inverse-Square Law of Gamma Radiation
Text lessonPreview
-
8.1.4 Inverse-Square Law of Gamma Radiation - Check yourself
6 questionsPreview
-
8.1.6 Radiation Safety
Text lessonPreview
-
8.1.6 Radiation Safety - Check yourself
6 questionsPreview
-
8.1.7 Required Practical- Inverse Square-Law for Gamma Radiation
Text lessonPreview
-
8.1.7 Required Practical- Inverse Square-Law for Gamma Radiation - Check yourself
6 questionsPreview
-
8.2.1 Radioactive Decay
Text lessonPreview
-
8.2.1 Radioactive Decay - Check yourself
6 questionsPreview
-
8.2.2 Exponential Decay
Text lessonPreview
-
8.2.2 Exponential Decay - Check yourself
6 questionsPreview
-
8.2.4 Applications of Radioactivity
Text lessonPreview
-
8.2.4 Applications of Radioactivity - Check yourself
6 questionsPreview
-
8.3.1 Nuclear Instability
Text lessonPreview
-
8.3.1 Nuclear Instability - Check yourself
6 questionsPreview
-
8.3.3 Nuclear Excited States
Text lessonPreview
-
8.3.3 Nuclear Excited States - Check yourself
6 questionsPreview
-
8.3.4 Nuclear Radius
Text lessonPreview
-
8.3.4 Nuclear Radius - Check yourself
6 questionsPreview
-
8.3.5 Closest Approach Estimate
Text lessonPreview
-
8.3.5 Closest Approach Estimate - Check yourself
6 questionsPreview
-
8.3.6 Nuclear Radius Equation
Text lessonPreview
-
8.3.6 Nuclear Radius Equation - Check yourself
6 questionsPreview
-
8.3.7 Nuclear Density
Text lessonPreview
-
8.3.7 Nuclear Density - Check yourself
6 questionsPreview
-
8.4.2 Mass Difference and Binding Energy
Text lessonPreview
-
8.4.2 Mass Difference and Binding Energy - Check yourself
6 questionsPreview
-
8.4.4 Binding Energy
Text lessonPreview
-
8.4.4 Binding Energy - Check yourself
6 questionsPreview
-
8.4.5 Induced Fission
Text lessonPreview
-
8.4.5 Induced Fission - Check yourself
6 questionsPreview
-
8.4.6 Operation of a Nuclear Reactor
Text lessonPreview
-
8.4.6 Operation of a Nuclear Reactor - Check yourself
6 questionsPreview
-
8.4.7 Safety Aspects of Nuclear Reactors
Text lessonPreview
-
8.4.7 Safety Aspects of Nuclear Reactors - Check yourself
6 questionsPreview
-
11.1.5 Decay Equations
Text lessonPreview
-
11.1.5 Decay Equations - Check yourself
6 questionsPreview
-
23.1.1 Energy and Mass Equivalence
Text lessonPreview
-
23.1.1 Energy and Mass Equivalence - Check yourself
6 questionsPreview
-
23.1.4 Nuclear Fusion and Fission
Text lessonPreview
-
23.1.4 Nuclear Fusion and Fission - Check yourself
6 questionsPreview
-
23.2.3 Half-Life
Text lessonPreview
-
23.2.3 Half-Life - Check yourself
6 questionsPreview
-
8.1.3 Alpha, Beta and Gamma Radiation
Text lessonPreview
-
8.1.5 Background Radiation
Text lessonPreview
-
8.3.2 Decay Equations
Text lessonPreview
-
8.4.1 Energy and Mass Equivalence
Text lessonPreview
-
8.4.3 Nuclear Fusion and Fission
Text lessonPreview
9. Astrophysics
0/65
-
9. Astrophysics
Text lessonPreview
-
5.9.4 The Hertzsprung-Russell Diagram
Text lessonPreview
-
5.9.4 The Hertzsprung-Russell Diagram - Check yourself
6 questionsPreview
-
9.1.1 Lenses and Ray Diagrams for Telescopes
Text lessonPreview
-
9.1.1 Lenses and Ray Diagrams for Telescopes - Check yourself
6 questionsPreview
-
9.1.2 Refracting Telescopes
Text lessonPreview
-
9.1.2 Refracting Telescopes - Check yourself
6 questionsPreview
-
9.1.3 Reflecting Telescopes
Text lessonPreview
-
9.1.3 Reflecting Telescopes - Check yourself
6 questionsPreview
-
9.1.4 Reflecting vs Refracting Telescopes
Text lessonPreview
-
9.1.4 Reflecting vs Refracting Telescopes - Check yourself
6 questionsPreview
-
9.1.5 Resolving Power of Telescopes
Text lessonPreview
-
9.1.5 Resolving Power of Telescopes - Check yourself
6 questionsPreview
-
9.1.6 Collecting Power of Telescopes
Text lessonPreview
-
9.1.6 Collecting Power of Telescopes - Check yourself
6 questionsPreview
-
9.1.7 Radio, IR, UV and X-Ray Telescopes
Text lessonPreview
-
9.1.7 Radio, IR, UV and X-Ray Telescopes - Check yourself
6 questionsPreview
-
9.1.8 Charge-Coupled Devices (CCDs) in Astronomy
Text lessonPreview
-
9.1.8 Charge-Coupled Devices (CCDs) in Astronomy - Check yourself
6 questionsPreview
-
9.2.1 Brightness and Apparent Magnitude
Text lessonPreview
-
9.2.1 Brightness and Apparent Magnitude - Check yourself
6 questionsPreview
-
9.2.2 Inverse Square Law of Radiation
Text lessonPreview
-
9.2.2 Inverse Square Law of Radiation - Check yourself
6 questionsPreview
-
9.2.3 Astronomical Distances
Text lessonPreview
-
9.2.3 Astronomical Distances - Check yourself
6 questionsPreview
-
9.2.4 Absolute Magnitude
Text lessonPreview
-
9.2.4 Absolute Magnitude - Check yourself
6 questionsPreview
-
9.2.6 Stefan's Law
Text lessonPreview
-
9.2.6 Stefan's Law - Check yourself
6 questionsPreview
-
9.2.7 Emission and Absorption Spectra in Stars
Text lessonPreview
-
9.2.7 Emission and Absorption Spectra in Stars - Check yourself
6 questionsPreview
-
9.2.8 Stellar Spectral Classes
Text lessonPreview
-
9.2.8 Stellar Spectral Classes - Check yourself
6 questionsPreview
-
9.2.9 Star Formation
Text lessonPreview
-
9.2.9 Star Formation - Check yourself
6 questionsPreview
-
9.2.10 Life Cycle of a Low Mass Star
Text lessonPreview
-
9.2.10 Life Cycle of a Low Mass Star - Check yourself
6 questionsPreview
-
9.2.11 Life Cycle of a High Mass Star
Text lessonPreview
-
9.2.11 Life Cycle of a High Mass Star - Check yourself
6 questionsPreview
-
9.2.12 Supernovae and Gamma Ray Bursts (GRBs)
Text lessonPreview
-
9.2.12 Supernovae and Gamma Ray Bursts (GRBs) - Check yourself
6 questionsPreview
-
9.2.13 Supernovae as Standard Candles
Text lessonPreview
-
9.2.13 Supernovae as Standard Candles - Check yourself
6 questionsPreview
-
9.2.14 Neutron Stars and Black Holes
Text lessonPreview
-
9.2.14 Neutron Stars and Black Holes - Check yourself
6 questionsPreview
-
9.3.1 The Doppler Effect of Light
Text lessonPreview
-
9.3.1 The Doppler Effect of Light - Check yourself
6 questionsPreview
-
9.3.2 Binary Star Systems
Text lessonPreview
-
9.3.2 Binary Star Systems - Check yourself
6 questionsPreview
-
9.3.3 Galactic Redshift
Text lessonPreview
-
9.3.3 Galactic Redshift - Check yourself
6 questionsPreview
-
9.3.4 Hubble's Law
Text lessonPreview
-
9.3.4 Hubble's Law - Check yourself
6 questionsPreview
-
9.3.5 Evidence for the Big Bang
Text lessonPreview
-
9.3.5 Evidence for the Big Bang - Check yourself
6 questionsPreview
-
9.3.6 Dark Energy
Text lessonPreview
-
9.3.6 Dark Energy - Check yourself
6 questionsPreview
-
9.3.7 Quasars
Text lessonPreview
-
9.3.7 Quasars - Check yourself
6 questionsPreview
-
9.3.8 Exoplanets
Text lessonPreview
-
9.3.8 Exoplanets - Check yourself
6 questionsPreview
-
25.2.1 Wien's Displacement Law
Text lessonPreview
-
25.2.1 Wien's Displacement Law - Check yourself
6 questionsPreview
-
9.2.15 The Hertzsprung–Russell Diagram
Text lessonPreview
-
9.2.5 Wien's Displacement Law
Text lessonPreview
10. Medical Physics
0/64
-
10. Medical Physics
Text lessonPreview
-
5.3.6 Converging and Diverging Lenses
Text lessonPreview
-
5.3.6 Converging and Diverging Lenses - Check yourself
6 questionsPreview
-
10.1.2 Lens Calculations
Text lessonPreview
-
10.1.2 Lens Calculations - Check yourself
6 questionsPreview
-
10.1.3 Structure of the Eye
Text lessonPreview
-
10.1.3 Structure of the Eye - Check yourself
6 questionsPreview
-
10.1.4 Sensitivity of the Eye
Text lessonPreview
-
10.1.4 Sensitivity of the Eye - Check yourself
6 questionsPreview
-
10.1.5 Spatial Resolution of the Eye
Text lessonPreview
-
10.1.5 Spatial Resolution of the Eye - Check yourself
6 questionsPreview
-
10.1.6 Defects of Vision
Text lessonPreview
-
10.1.6 Defects of Vision - Check yourself
6 questionsPreview
-
10.2.1 Structure of the Ear
Text lessonPreview
-
10.2.1 Structure of the Ear - Check yourself
6 questionsPreview
-
10.2.2 The Decibel Scale
Text lessonPreview
-
10.2.2 The Decibel Scale - Check yourself
6 questionsPreview
-
10.2.3 Equal Loudness Curves
Text lessonPreview
-
10.2.3 Equal Loudness Curves - Check yourself
6 questionsPreview
-
10.2.4 Defects of Hearing
Text lessonPreview
-
10.2.4 Defects of Hearing - Check yourself
6 questionsPreview
-
10.3.1 ECG Machines
Text lessonPreview
-
10.3.1 ECG Machines - Check yourself
6 questionsPreview
-
10.4.2 Generation and Detection of Ultrasound
Text lessonPreview
-
10.4.2 Generation and Detection of Ultrasound - Check yourself
6 questionsPreview
-
10.4.3 Ultrasound Imaging
Text lessonPreview
-
10.4.3 Ultrasound Imaging - Check yourself
6 questionsPreview
-
10.4.4 Applications of Ultrasound
Text lessonPreview
-
10.4.4 Applications of Ultrasound - Check yourself
6 questionsPreview
-
10.4.5 Fibre Optics and Endoscopy
Text lessonPreview
-
10.4.5 Fibre Optics and Endoscopy - Check yourself
6 questionsPreview
-
10.4.6 Magnetic Resonance Imaging
Text lessonPreview
-
10.4.6 Magnetic Resonance Imaging - Check yourself
6 questionsPreview
-
10.5.1 Production of X-rays
Text lessonPreview
-
10.5.1 Production of X-rays - Check yourself
6 questionsPreview
-
10.5.2 Rotating-Anode X-ray Tube
Text lessonPreview
-
10.5.2 Rotating-Anode X-ray Tube - Check yourself
6 questionsPreview
-
10.5.3 Using X-rays in Medical Imaging
Text lessonPreview
-
10.5.3 Using X-rays in Medical Imaging - Check yourself
6 questionsPreview
-
10.5.4 X-ray Detection
Text lessonPreview
-
10.5.4 X-ray Detection - Check yourself
6 questionsPreview
-
10.5.5 Attenuation of X-rays
Text lessonPreview
-
10.5.5 Attenuation of X-rays - Check yourself
6 questionsPreview
-
10.5.6 The CT Scanner
Text lessonPreview
-
10.5.6 The CT Scanner - Check yourself
6 questionsPreview
-
10.6.2 The Molybdenum-Technetium Generator
Text lessonPreview
-
10.6.2 The Molybdenum-Technetium Generator - Check yourself
6 questionsPreview
-
10.6.3 The PET Scanner
Text lessonPreview
-
10.6.3 The PET Scanner - Check yourself
6 questionsPreview
-
10.6.4 Physical, Biological and Effective Half Life
Text lessonPreview
-
10.6.4 Physical, Biological and Effective Half Life - Check yourself
6 questionsPreview
-
10.6.5 Gamma Camera
Text lessonPreview
-
10.6.5 Gamma Camera - Check yourself
6 questionsPreview
-
10.6.6 Radiotherapy
Text lessonPreview
-
10.6.6 Radiotherapy - Check yourself
6 questionsPreview
-
10.6.7 Comparing Imaging Techniques
Text lessonPreview
-
10.6.7 Comparing Imaging Techniques - Check yourself
6 questionsPreview
-
24.1.1 The Piezoelectric Transducer
Text lessonPreview
-
24.1.1 The Piezoelectric Transducer - Check yourself
6 questionsPreview
-
24.3.1 Radioactive Tracers
Text lessonPreview
-
24.3.1 Radioactive Tracers - Check yourself
6 questionsPreview
-
10.1.1 Converging and Diverging Lenses
Text lessonPreview
-
10.4.1 The Piezoelectric Transducer
Text lessonPreview
-
10.6.1 Radioactive Tracers
Text lessonPreview
11. Engineering Physics
0/46
-
11. Engineering Physics
Text lessonPreview
-
11.1.1 Rotational Motion
Text lessonPreview
-
11.1.1 Rotational Motion - Check yourself
6 questionsPreview
-
11.1.2 Angular Acceleration Equations
Text lessonPreview
-
11.1.2 Angular Acceleration Equations - Check yourself
6 questionsPreview
-
11.1.3 Torque
Text lessonPreview
-
11.1.3 Torque - Check yourself
6 questionsPreview
-
11.1.4 Moment of Inertia
Text lessonPreview
-
11.1.4 Moment of Inertia - Check yourself
6 questionsPreview
-
11.1.5 Newton’s Second Law for Rotation
Text lessonPreview
-
11.1.5 Newton’s Second Law for Rotation - Check yourself
6 questionsPreview
-
11.1.6 Angular Momentum
Text lessonPreview
-
11.1.6 Angular Momentum - Check yourself
6 questionsPreview
-
11.1.7 Angular Impulse
Text lessonPreview
-
11.1.7 Angular Impulse - Check yourself
6 questionsPreview
-
11.1.8 Rotational Work and Power
Text lessonPreview
-
11.1.8 Rotational Work and Power - Check yourself
6 questionsPreview
-
11.1.9 Rotational Kinetic Energy
Text lessonPreview
-
11.1.9 Rotational Kinetic Energy - Check yourself
6 questionsPreview
-
11.1.10 Flywheels in Machines
Text lessonPreview
-
11.1.10 Flywheels in Machines - Check yourself
6 questionsPreview
-
11.2.2 p–V Diagrams
Text lessonPreview
-
11.2.2 p–V Diagrams - Check yourself
6 questionsPreview
-
11.2.3 Thermodynamic Processes
Text lessonPreview
-
11.2.3 Thermodynamic Processes - Check yourself
6 questionsPreview
-
11.2.4 Petrol Engine Cycle
Text lessonPreview
-
11.2.4 Petrol Engine Cycle - Check yourself
6 questionsPreview
-
11.2.5 Diesel Engine Cycle
Text lessonPreview
-
11.2.5 Diesel Engine Cycle - Check yourself
6 questionsPreview
-
11.2.6 Comparing Petrol and Diesel Engines
Text lessonPreview
-
11.2.6 Comparing Petrol and Diesel Engines - Check yourself
6 questionsPreview
-
11.2.7 Power Output of an Engine
Text lessonPreview
-
11.2.7 Power Output of an Engine - Check yourself
6 questionsPreview
-
11.2.8 Engine Efficiency
Text lessonPreview
-
11.2.8 Engine Efficiency - Check yourself
6 questionsPreview
-
11.2.9 The Second Law of Thermodynamics
Text lessonPreview
-
11.2.9 The Second Law of Thermodynamics - Check yourself
6 questionsPreview
-
11.2.10 Heat Engines
Text lessonPreview
-
11.2.10 Heat Engines - Check yourself
6 questionsPreview
-
11.2.11 Limitations of Real Heat Engines
Text lessonPreview
-
11.2.11 Limitations of Real Heat Engines - Check yourself
6 questionsPreview
-
11.2.12 Reversed Heat Engines
Text lessonPreview
-
11.2.12 Reversed Heat Engines - Check yourself
6 questionsPreview
-
11.2.13 Coefficients of Performance
Text lessonPreview
-
11.2.13 Coefficients of Performance - Check yourself
6 questionsPreview
-
11.2.1 The First Law of Thermodynamics
Text lessonPreview
12. Turning Points in Physics
0/56
-
12. Turning Points in Physics
Text lessonPreview
-
4.6.3 Thermionic Emission
Text lessonPreview
-
4.6.3 Thermionic Emission - Check yourself
6 questionsPreview
-
12.1.1 Cathode Rays
Text lessonPreview
-
12.1.1 Cathode Rays - Check yourself
6 questionsPreview
-
12.1.3 Specific Charge Experiments
Text lessonPreview
-
12.1.3 Specific Charge Experiments - Check yourself
6 questionsPreview
-
12.1.4 Significance of Thomson's Experiment
Text lessonPreview
-
12.1.4 Significance of Thomson's Experiment - Check yourself
6 questionsPreview
-
12.1.5 Millikan’s Oil Drop Experiment
Text lessonPreview
-
12.1.5 Millikan’s Oil Drop Experiment - Check yourself
6 questionsPreview
-
12.1.6 Stokes' Law
Text lessonPreview
-
12.1.6 Stokes' Law - Check yourself
6 questionsPreview
-
12.2.1 Theories of Light
Text lessonPreview
-
12.2.1 Theories of Light - Check yourself
6 questionsPreview
-
12.2.2 Young's Double Slit Interference
Text lessonPreview
-
12.2.2 Young's Double Slit Interference - Check yourself
6 questionsPreview
-
12.2.3 Maxwell's Wave Equation
Text lessonPreview
-
12.2.3 Maxwell's Wave Equation - Check yourself
6 questionsPreview
-
12.2.4 Hertz's Discovery of Radio Waves
Text lessonPreview
-
12.2.4 Hertz's Discovery of Radio Waves - Check yourself
6 questionsPreview
-
12.2.5 Fizeau's Speed of Light Experiment
Text lessonPreview
-
12.2.5 Fizeau's Speed of Light Experiment - Check yourself
6 questionsPreview
-
12.2.6 UV Catastrophe and Black-Body Radiation
Text lessonPreview
-
12.2.6 UV Catastrophe and Black-Body Radiation - Check yourself
6 questionsPreview
-
12.2.7 The Discovery of Photoelectricity
Text lessonPreview
-
12.2.7 The Discovery of Photoelectricity - Check yourself
6 questionsPreview
-
12.2.8 De Broglie's Hypothesis
Text lessonPreview
-
12.2.8 De Broglie's Hypothesis - Check yourself
6 questionsPreview
-
12.2.9 Electron Diffraction
Text lessonPreview
-
12.2.9 Electron Diffraction - Check yourself
6 questionsPreview
-
12.2.10 Transmission Electron Microscope
Text lessonPreview
-
12.2.10 Transmission Electron Microscope - Check yourself
6 questionsPreview
-
12.2.11 Scanning Tunnelling Microscope
Text lessonPreview
-
12.2.11 Scanning Tunnelling Microscope - Check yourself
6 questionsPreview
-
12.3.1 The Michelson-Morley Interferometer
Text lessonPreview
-
12.3.1 The Michelson-Morley Interferometer - Check yourself
6 questionsPreview
-
12.3.2 The Invariance of the Speed of Light
Text lessonPreview
-
12.3.2 The Invariance of the Speed of Light - Check yourself
6 questionsPreview
-
12.3.3 Inertial Frames of Reference
Text lessonPreview
-
12.3.3 Inertial Frames of Reference - Check yourself
6 questionsPreview
-
12.3.4 Einstein's Postulates
Text lessonPreview
-
12.3.4 Einstein's Postulates - Check yourself
6 questionsPreview
-
12.3.5 Time Dilation
Text lessonPreview
-
12.3.5 Time Dilation - Check yourself
6 questionsPreview
-
12.3.6 Muon Lifetime Experiment
Text lessonPreview
-
12.3.6 Muon Lifetime Experiment - Check yourself
6 questionsPreview
-
12.3.7 Length Contraction
Text lessonPreview
-
12.3.7 Length Contraction - Check yourself
6 questionsPreview
-
12.3.8 Relativistic Mass
Text lessonPreview
-
12.3.8 Relativistic Mass - Check yourself
6 questionsPreview
-
12.3.9 Relativistic Energy
Text lessonPreview
-
12.3.9 Relativistic Energy - Check yourself
6 questionsPreview
-
12.3.10 Bertozzi's Experiment
Text lessonPreview
-
12.3.10 Bertozzi's Experiment - Check yourself
6 questionsPreview
-
12.1.2 Thermionic Emission
Text lessonPreview
Text lesson
4.3.2 Motion Graphs
4.3.2 Motion Graphs: Interpret displacement–time, velocity–time and acceleration–time graphs using gradients and areas.
1Gradient2Straight line · Curve3Negative gradient
Gradient
 ⤢ Enlarge
Gradient
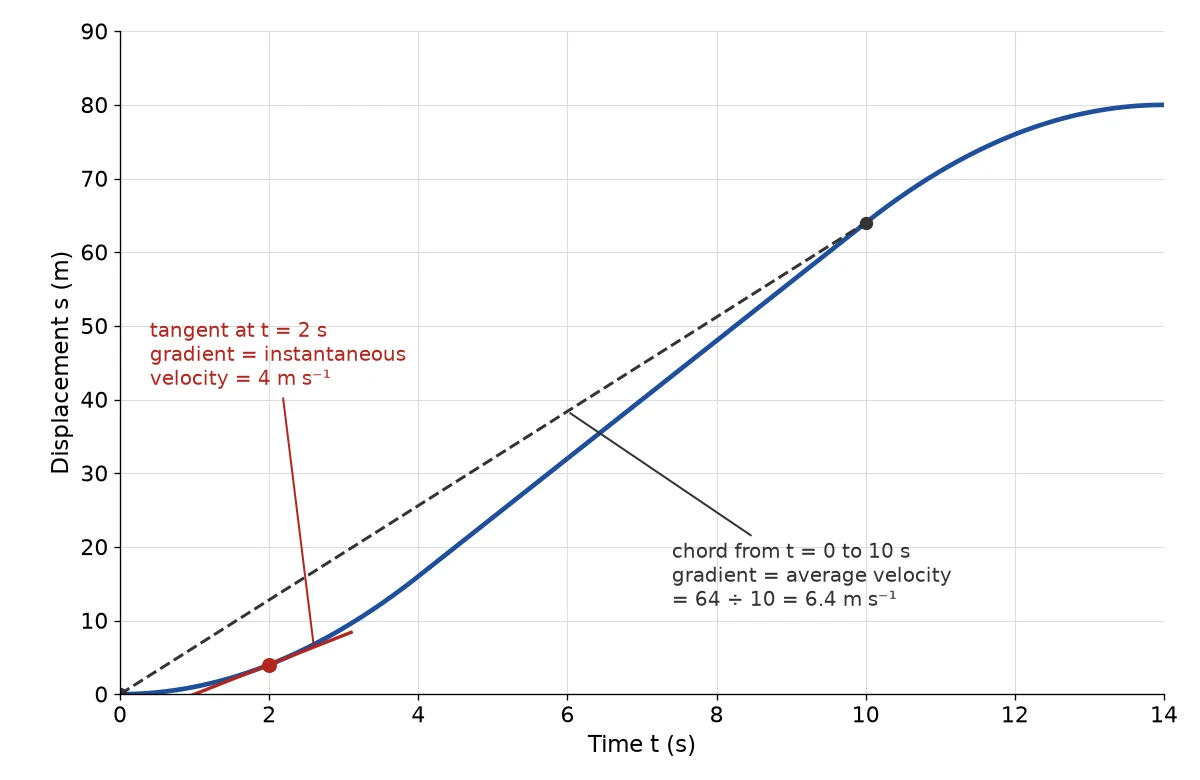
The gradient of a displacement–time graph at any point equals the velocity at that moment.
1 / 3Next ▶
Straight line · Curve
Straight line
A straight sloping line means constant velocity, and a flat line means the object is at rest.
Curve
A curve whose gradient is increasing shows an object that is accelerating.
◀ Previous2 / 3Next ▶
Displacement-time curve with a tangent at t = 2 s and a dashed chord from t = 0 s to t = 10 s
Negative gradient
 ⤢ Enlarge
Negative gradient
A line sloping downwards represents motion back towards the starting point in the negative direction.
◀ Previous3 / 3
1Gradient · Area · Horizontal line2Below the axis
Gradient · Area · Horizontal line
Gradient
The gradient of a velocity–time graph gives the acceleration of the object.
Area
The area between the line and the time axis gives the displacement over that time interval.
Horizontal line
A horizontal line indicates constant velocity and therefore zero acceleration.
1 / 2Next ▶
Velocity-time graph forming a trapezium, with the area split into two triangles and a rectangle labelled in metres
Below the axis
 ⤢ Enlarge
Below the axis
Areas below the time axis represent motion in the negative direction
so they subtract from the total displacement.
| Graph | Gradient gives | Area gives |
|---|---|---|
| Displacement–time | Velocity | Nothing useful |
| Velocity–time | Acceleration | Displacement |
| Acceleration–time | Rate of change of acceleration | Change in velocity |
◀ Previous2 / 2
1Analysing a Journey Graph2Analysing a Journey Graph
Analysing a Journey Graph
1
1
2
Divide the graph into sections wherever the gradient changes
so that each section is a straight line or a simple shape.
3
2
4
In each section calculate the gradient by taking rise over run using a large triangle to reduce error.
5
3
6
Calculate the area of each section as a triangle, rectangle or trapezium.
1 / 2Next ▶
Analysing a Journey Graph
Analysing a Journey Graph
4
Add areas above the axis and subtract areas below it to find the total displacement.
5
Divide total displacement by total time to find the average velocity, remembering it may differ from the average speed.
◀ Previous2 / 2
1Curves and Tangents2Curves and Tangents
Curves and Tangents
1
For a curved graph the gradient at a point is found by drawing a tangent that just touches the curve there.
2
For irregular shapes the area is estimated by counting squares and multiplying by the value of one square.
3
Gradient units are the y-axis unit divided by the x-axis unit
which helps to confirm the quantity found.
4
A ball thrown upwards has a straight sloping velocity–time line with a negative gradient of about 9.8 m/s2 (taken as g).
5
The y-intercept of a displacement–time graph gives the object’s initial displacement.
6
A distance–time graph has only positive values, whereas a displacement–time graph can show negative values too.
1 / 2Next ▶
Curves and Tangents
Curves and Tangents
The y-intercept of a velocity–time graph gives the object’s initial velocity.
A straight line on a velocity–time graph means uniform acceleration
while a curved line means non-uniform acceleration.
The y-intercept of an acceleration–time graph gives the initial acceleration of the object.
A horizontal line on an acceleration–time graph means the object has constant acceleration.
A bouncing ball has zero velocity at its highest point, yet its acceleration stays constant and points downwards.
The chosen positive direction must stay consistent throughout a problem so that the signs of velocity remain meaningful.
◀ Previous2 / 2
Worked Example
Worked Example
Question: A cyclist accelerates uniformly from rest to 12 m/s in 4.0 s, travels at 12 m/s for 6.0 s and then decelerates uniformly to rest in 3.0 s. Find the initial acceleration and the total distance.
Initial acceleration = change in velocity / time = 12⁄4.0 = 3.0 m/s2.
Area of first triangle = ½ × 4.0 × 12 = 24 m
rectangle = 12 × 6.0 = 72 mfinal triangle = ½ × 3.0 × 12 = 18 m.
Total distance = 24 + 72 + 18 = 114 m.
Answer: The acceleration is 3.0 m/s2 and the cyclist travels 114 m in total.
14.3.2 – Main ideas for the Exam2Common Mistakes
4.3.2 – Main ideas for the Exam
1
Gradient: The slope of a graph, change in y divided by change in x.
2
Acceleration: The rate of change of velocity.
3
Displacement: The change in position of an object in a stated direction.
4
Tangent: A straight line that touches a curve at one point and has the same gradient as the curve there.
5
Uniform acceleration: Acceleration that is constant in size and direction.
1 / 2Next ▶
Common Mistakes
1
Reading the height of a displacement–time graph as the speed rather than its gradient.
2
Treating the area under a displacement–time graph as meaningful.
3
Forgetting to subtract area below the axis on velocity–time graphs when finding displacement.
4
Using a very small triangle to find a gradient
which increases the percentage uncertainty.
◀ Previous2 / 2