Curriculum
AQA A Level Physics 7408
1. Measurements and Their Errors
0/15
-
1. Measurements and Their Errors
 Text lessonPreview
-
1.1.2 Powers of Ten
Text lessonPreview
-
1.1.2 Powers of Ten - Check yourself
 6 questionsPreview
-
1.1.3 Estimating Physical Quantities
Text lessonPreview
-
1.1.3 Estimating Physical Quantities - Check yourself
6 questionsPreview
-
1.2.1 SI Units
Text lessonPreview
-
1.2.1 SI Units - Check yourself
6 questionsPreview
-
1.2.1 Sources of Uncertainty
Text lessonPreview
-
1.2.1 Sources of Uncertainty - Check yourself
6 questionsPreview
-
1.2.3 Determining Uncertainties from Graphs
Text lessonPreview
-
1.2.3 Determining Uncertainties from Graphs - Check yourself
6 questionsPreview
-
1.3.2 Calculating Uncertainties
Text lessonPreview
-
1.3.2 Calculating Uncertainties - Check yourself
6 questionsPreview
-
1.1.1 SI Units
Text lessonPreview
-
1.2.2 Calculating Uncertainties
Text lessonPreview
2. Particles and Radiation
0/58
-
2. Particles and Radiation
Text lessonPreview
-
2.1.3 Strong Nuclear Force
Text lessonPreview
-
2.1.3 Strong Nuclear Force - Check yourself
6 questionsPreview
-
2.1.4 Alpha and Beta Decay
Text lessonPreview
-
2.1.4 Alpha and Beta Decay - Check yourself
6 questionsPreview
-
2.1.5 Particles, Antiparticles and Photons
Text lessonPreview
-
2.1.5 Particles, Antiparticles and Photons - Check yourself
6 questionsPreview
-
2.2.1 Hadrons
Text lessonPreview
-
2.2.1 Hadrons - Check yourself
6 questionsPreview
-
2.2.2 Baryons
Text lessonPreview
-
2.2.2 Baryons - Check yourself
6 questionsPreview
-
2.2.3 Mesons
Text lessonPreview
-
2.2.3 Mesons - Check yourself
6 questionsPreview
-
2.2.4 Leptons
Text lessonPreview
-
2.2.4 Leptons - Check yourself
6 questionsPreview
-
2.2.5 Quarks and Antiquarks
Text lessonPreview
-
2.2.5 Quarks and Antiquarks - Check yourself
6 questionsPreview
-
2.2.6 Strange Quarks
Text lessonPreview
-
2.2.6 Strange Quarks - Check yourself
6 questionsPreview
-
2.2.7 Collaborative Efforts in Particle Physics
Text lessonPreview
-
2.2.7 Collaborative Efforts in Particle Physics - Check yourself
6 questionsPreview
-
2.3.1 The Four Fundamental Interactions
Text lessonPreview
-
2.3.1 The Four Fundamental Interactions - Check yourself
6 questionsPreview
-
2.3.2 The Electromagnetic and Strong Force
Text lessonPreview
-
2.3.2 The Electromagnetic and Strong Force - Check yourself
6 questionsPreview
-
2.3.3 The Weak Interaction
Text lessonPreview
-
2.3.3 The Weak Interaction - Check yourself
6 questionsPreview
-
2.3.4 Feynman Diagrams
Text lessonPreview
-
2.3.4 Feynman Diagrams - Check yourself
6 questionsPreview
-
2.3.5 Application of Conservation Laws
Text lessonPreview
-
2.3.5 Application of Conservation Laws - Check yourself
6 questionsPreview
-
2.4.2 Threshold Frequency and Work Function
Text lessonPreview
-
2.4.2 Threshold Frequency and Work Function - Check yourself
6 questionsPreview
-
2.5.1 Collisions of Electrons with Atoms
Text lessonPreview
-
2.5.1 Collisions of Electrons with Atoms - Check yourself
6 questionsPreview
-
2.5.2 The Photoelectric Equation
Text lessonPreview
-
2.5.2 The Photoelectric Equation - Check yourself
6 questionsPreview
-
2.5.2 Energy Levels and Photon Emission
Text lessonPreview
-
2.5.2 Energy Levels and Photon Emission - Check yourself
6 questionsPreview
-
2.5.5 Diffraction Effects of Momentum
Text lessonPreview
-
2.5.5 Diffraction Effects of Momentum - Check yourself
6 questionsPreview
-
2.5.6 Analysis of the Nature of Matter
Text lessonPreview
-
2.5.6 Analysis of the Nature of Matter - Check yourself
6 questionsPreview
-
11.1.2 Atomic Structure
Text lessonPreview
-
11.1.2 Atomic Structure - Check yourself
6 questionsPreview
-
11.1.3 Nucleon and Proton Number
Text lessonPreview
-
22.1.3 The Electronvolt
Text lessonPreview
-
22.1.3 The Electronvolt - Check yourself
6 questionsPreview
-
22.3.1 Wave-Particle Duality
Text lessonPreview
-
22.3.1 Wave-Particle Duality - Check yourself
6 questionsPreview
-
22.3.2 The de Broglie Wavelength
Text lessonPreview
-
22.3.2 The de Broglie Wavelength - Check yourself
6 questionsPreview
-
2.1.1 Atomic Structure
Text lessonPreview
-
2.1.2 Nucleon and Proton Number
Text lessonPreview
-
2.4.1 The Electronvolt
Text lessonPreview
-
2.4.3 The Photoelectric Equation
Text lessonPreview
-
2.5.3 Wave-Particle Duality
Text lessonPreview
-
2.5.4 The de Broglie Wavelength
Text lessonPreview
3. Waves
0/39
-
3. Waves
Text lessonPreview
-
3.1.2 Longitudinal and Transverse Waves
Text lessonPreview
-
3.1.2 Longitudinal and Transverse Waves - Check yourself
6 questionsPreview
-
3.2.2 Formation of Stationary Waves
Text lessonPreview
-
3.2.2 Formation of Stationary Waves - Check yourself
6 questionsPreview
-
3.2.3 Harmonics
Text lessonPreview
-
3.2.3 Harmonics - Check yourself
6 questionsPreview
-
3.2.4 Required Practical- Investigating Stationary Waves
Text lessonPreview
-
3.2.4 Required Practical- Investigating Stationary Waves - Check yourself
6 questionsPreview
-
3.3.1 Path Difference and Coherence
Text lessonPreview
-
3.3.1 Path Difference and Coherence - Check yourself
6 questionsPreview
-
3.3.2 Demonstrating Interference
Text lessonPreview
-
3.3.2 Demonstrating Interference - Check yourself
6 questionsPreview
-
3.3.4 Developing Theories of EM Radiation
Text lessonPreview
-
3.3.4 Developing Theories of EM Radiation - Check yourself
6 questionsPreview
-
3.3.5 Required Practical- Young's Slit Experiment and Diffraction Gratings
Text lessonPreview
-
3.3.5 Required Practical- Young's Slit Experiment and Diffraction Gratings - Check yourself
6 questionsPreview
-
3.4.1 Single Slit Diffraction
Text lessonPreview
-
3.4.1 Single Slit Diffraction - Check yourself
6 questionsPreview
-
3.5.1 Refraction at a Plane Surface
Text lessonPreview
-
3.5.1 Refraction at a Plane Surface - Check yourself
6 questionsPreview
-
3.5.2 Snell's Law
Text lessonPreview
-
3.5.2 Snell's Law - Check yourself
6 questionsPreview
-
3.5.3 Fibre Optics
Text lessonPreview
-
3.5.3 Fibre Optics - Check yourself
6 questionsPreview
-
7.1.1 Progressive Waves
Text lessonPreview
-
7.1.1 Progressive Waves - Check yourself
6 questionsPreview
-
7.5.1 Polarisation
Text lessonPreview
-
7.5.1 Polarisation - Check yourself
6 questionsPreview
-
8.1.2 Stationary Waves
Text lessonPreview
-
8.1.2 Stationary Waves - Check yourself
6 questionsPreview
-
8.3.3 Young's Double Slit Experiment
Text lessonPreview
-
8.3.3 Young's Double Slit Experiment - Check yourself
6 questionsPreview
-
8.4.1 The Diffraction Grating
Text lessonPreview
-
8.4.1 The Diffraction Grating - Check yourself
6 questionsPreview
-
3.1.1 Progressive Waves
Text lessonPreview
-
3.1.3 Polarisation
Text lessonPreview
-
3.3.3 Young's Double-Slit Experiment
Text lessonPreview
-
3.4.2 The Diffraction Grating
Text lessonPreview
4. Mechanics and Materials
0/77
-
4. Mechanics and Materials
Text lessonPreview
-
1.1.5 Resolving Vectors
Text lessonPreview
-
1.1.5 Resolving Vectors - Check yourself
6 questionsPreview
-
1.4.1 Scalars and Vectors
Text lessonPreview
-
1.4.1 Scalars and Vectors - Check yourself
6 questionsPreview
-
1.6.6 Elastic Strain Energy
Text lessonPreview
-
1.6.6 Elastic Strain Energy - Check yourself
6 questionsPreview
-
2.1.2 Motion Graphs
Text lessonPreview
-
2.1.9 Projectile Motion
Text lessonPreview
-
2.1.9 Projectile Motion - Check yourself
6 questionsPreview
-
3.1.3 Linear Momentum
Text lessonPreview
-
3.1.3 Linear Momentum - Check yourself
6 questionsPreview
-
3.2.2 Terminal Velocity
Text lessonPreview
-
3.2.2 Terminal Velocity - Check yourself
6 questionsPreview
-
3.3.1 Conservation of Momentum
Text lessonPreview
-
3.3.1 Conservation of Momentum - Check yourself
6 questionsPreview
-
4.1.1 Impulse
Text lessonPreview
-
4.1.1 Impulse - Check yourself
6 questionsPreview
-
4.1.2 Moments
Text lessonPreview
-
4.1.2 Moments - Check yourself
6 questionsPreview
-
4.2.2 Couples
Text lessonPreview
-
4.2.2 Couples - Check yourself
6 questionsPreview
-
4.2.3 Centre of Mass
Text lessonPreview
-
4.2.3 Centre of Mass - Check yourself
6 questionsPreview
-
4.3.1 Motion Along a Straight Line
Text lessonPreview
-
4.3.1 Motion Along a Straight Line - Check yourself
6 questionsPreview
-
4.3.1 Density
Text lessonPreview
-
4.3.1 Density - Check yourself
6 questionsPreview
-
4.3.3 SUVAT Equations
Text lessonPreview
-
4.3.3 SUVAT Equations - Check yourself
6 questionsPreview
-
4.3.5 Drag Forces
Text lessonPreview
-
4.3.5 Drag Forces - Check yourself
6 questionsPreview
-
4.3.7 Required Practical- Determination of g
Text lessonPreview
-
4.3.7 Required Practical- Determination of g - Check yourself
6 questionsPreview
-
4.4.1 Newton’s First Law
Text lessonPreview
-
4.4.1 Newton’s First Law - Check yourself
6 questionsPreview
-
4.4.2 Newton's Second Law
Text lessonPreview
-
4.4.2 Newton's Second Law - Check yourself
6 questionsPreview
-
4.4.3 Newton's Third Law
Text lessonPreview
-
4.4.3 Newton's Third Law - Check yourself
6 questionsPreview
-
4.5.4 Impulse on a Force-Time Graph
Text lessonPreview
-
4.5.4 Impulse on a Force-Time Graph - Check yourself
6 questionsPreview
-
4.5.5 Collisions
Text lessonPreview
-
4.5.5 Collisions - Check yourself
6 questionsPreview
-
4.6.1 Work and Power
Text lessonPreview
-
4.6.1 Work and Power - Check yourself
6 questionsPreview
-
4.6.2 Area Under a Force-Displacement Graph
Text lessonPreview
-
4.6.2 Area Under a Force-Displacement Graph - Check yourself
6 questionsPreview
-
4.6.4 Conservation of Energy
Text lessonPreview
-
4.6.4 Conservation of Energy - Check yourself
6 questionsPreview
-
4.6.5 Kinetic and Gravitational Potential Energy
Text lessonPreview
-
4.6.5 Kinetic and Gravitational Potential Energy - Check yourself
6 questionsPreview
-
4.7.3 Stress and Strain
Text lessonPreview
-
4.7.3 Stress and Strain - Check yourself
6 questionsPreview
-
4.7.6 Energy Conservation
Text lessonPreview
-
4.7.6 Energy Conservation - Check yourself
6 questionsPreview
-
4.8.2 Required Practical- The Young Modulus
Text lessonPreview
-
4.8.2 Required Practical- The Young Modulus - Check yourself
6 questionsPreview
-
5.1.3 Efficiency
Text lessonPreview
-
5.1.3 Efficiency - Check yourself
6 questionsPreview
-
6.1.2 Hooke's Law
Text lessonPreview
-
6.1.2 Hooke's Law - Check yourself
6 questionsPreview
-
6.1.3 The Young Modulus
Text lessonPreview
-
6.1.3 The Young Modulus - Check yourself
6 questionsPreview
-
6.2.1 Elastic and Plastic Behaviour
Text lessonPreview
-
6.2.1 Elastic and Plastic Behaviour - Check yourself
6 questionsPreview
-
4.1.1 Scalars and Vectors
Text lessonPreview
-
4.1.2 Resolving Vectors
Text lessonPreview
-
4.2.1 Moments
Text lessonPreview
-
4.3.2 Motion Graphs
Text lessonPreview
-
4.3.4 Projectile Motion
Text lessonPreview
-
4.3.6 Terminal Velocity
Text lessonPreview
-
4.5.1 Linear Momentum
Text lessonPreview
-
4.5.2 Conservation of Momentum
Text lessonPreview
-
4.7.2 Hooke's Law
Text lessonPreview
-
4.7.4 Elastic Strain Energy
Text lessonPreview
-
4.7.5 Elastic and Plastic Behaviour
Text lessonPreview
5. Electricity
0/25
-
5. Electricity
Text lessonPreview
-
5.1.1 Basics of Electricity
Text lessonPreview
-
5.1.1 Basics of Electricity - Check yourself
6 questionsPreview
-
5.1.2 Current–Voltage Characteristics
Text lessonPreview
-
5.1.2 Current–Voltage Characteristics - Check yourself
6 questionsPreview
-
5.2.2 Resistance in a Thermistor
Text lessonPreview
-
5.2.2 Resistance in a Thermistor - Check yourself
6 questionsPreview
-
5.2.3 Superconductivity
Text lessonPreview
-
5.2.3 Superconductivity - Check yourself
6 questionsPreview
-
5.2.4 Required Practical- Investigating Resistivity
Text lessonPreview
-
5.2.4 Required Practical- Investigating Resistivity - Check yourself
6 questionsPreview
-
5.3.1 Resistors in Series and Parallel
Text lessonPreview
-
5.3.1 Resistors in Series and Parallel - Check yourself
6 questionsPreview
-
5.3.2 Series and Parallel Circuits
Text lessonPreview
-
5.3.2 Series and Parallel Circuits - Check yourself
6 questionsPreview
-
5.3.3 Electrical Energy and Power
Text lessonPreview
-
5.3.3 Electrical Energy and Power - Check yourself
6 questionsPreview
-
5.3.4 Potential Divider Circuits
Text lessonPreview
-
5.3.4 Potential Divider Circuits - Check yourself
6 questionsPreview
-
5.4.1 Electromotive Force and Internal Resistance
Text lessonPreview
-
5.4.1 Electromotive Force and Internal Resistance - Check yourself
6 questionsPreview
-
5.4.2 Required Practical- Investigating EMF and Internal Resistance
Text lessonPreview
-
5.4.2 Required Practical- Investigating EMF and Internal Resistance - Check yourself
6 questionsPreview
-
9.3.4 Resistivity
Text lessonPreview
-
9.3.4 Resistivity - Check yourself
6 questionsPreview
6. Further Mechanics and Thermal Physics
0/77
-
6. Further Mechanics and Thermal Physics
Text lessonPreview
-
4.2.5 Centripetal Force
Text lessonPreview
-
4.2.5 Centripetal Force - Check yourself
6 questionsPreview
-
5.2.5 Average Molecular Kinetic Energy
Text lessonPreview
-
5.2.5 Average Molecular Kinetic Energy - Check yourself
6 questionsPreview
-
5.5.1 Conditions for Simple Harmonic Motion
Text lessonPreview
-
5.5.1 Conditions for Simple Harmonic Motion - Check yourself
6 questionsPreview
-
5.6.4 Free and Forced Oscillations
Text lessonPreview
-
5.6.4 Free and Forced Oscillations - Check yourself
6 questionsPreview
-
6.1.1 Circular Motion
Text lessonPreview
-
6.1.1 Circular Motion - Check yourself
6 questionsPreview
-
6.1.2 Radians
Text lessonPreview
-
6.1.2 Radians - Check yourself
6 questionsPreview
-
6.2.3 Calculating Maximum Speed and Acceleration
Text lessonPreview
-
6.2.3 Calculating Maximum Speed and Acceleration - Check yourself
6 questionsPreview
-
6.2.4 Period of Mass-Spring System
Text lessonPreview
-
6.2.4 Period of Mass-Spring System - Check yourself
6 questionsPreview
-
6.2.5 Period of Simple Pendulum
Text lessonPreview
-
6.2.5 Period of Simple Pendulum - Check yourself
6 questionsPreview
-
6.2.6 Harmonic Oscillators in Context
Text lessonPreview
-
6.2.6 Harmonic Oscillators in Context - Check yourself
6 questionsPreview
-
6.2.8 Required Practical- Investigating SHM
Text lessonPreview
-
6.2.8 Required Practical- Investigating SHM - Check yourself
6 questionsPreview
-
6.4.4 Latent Heat Capacity
Text lessonPreview
-
6.4.4 Latent Heat Capacity - Check yourself
6 questionsPreview
-
6.5.1 The Kelvin Scale and Absolute Zero
Text lessonPreview
-
6.5.1 The Kelvin Scale and Absolute Zero - Check yourself
6 questionsPreview
-
6.5.2 Gas Laws
Text lessonPreview
-
6.5.2 Gas Laws - Check yourself
6 questionsPreview
-
6.5.5 Avogadro, Molar Gas and Boltzmann Constant
Text lessonPreview
-
6.5.5 Avogadro, Molar Gas and Boltzmann Constant - Check yourself
6 questionsPreview
-
6.5.6 Required Practical- Investigating Gas Laws
Text lessonPreview
-
6.5.6 Required Practical- Investigating Gas Laws - Check yourself
6 questionsPreview
-
6.6.1 Gas Laws v Kinetic Theory
Text lessonPreview
-
6.6.1 Gas Laws v Kinetic Theory - Check yourself
6 questionsPreview
-
6.6.4 Brownian Motion
Text lessonPreview
-
6.6.4 Brownian Motion - Check yourself
6 questionsPreview
-
6.6.5 Evolving Models of Gas Behaviour
Text lessonPreview
-
6.6.5 Evolving Models of Gas Behaviour - Check yourself
6 questionsPreview
-
9.2.3 Kinetic Theory of Gases Equation
Text lessonPreview
-
9.2.3 Kinetic Theory of Gases Equation - Check yourself
6 questionsPreview
-
12.1.2 Angular Speed
Text lessonPreview
-
12.1.2 Angular Speed - Check yourself
6 questionsPreview
-
12.2.1 Centripetal Acceleration
Text lessonPreview
-
14.3.1 Specific Heat Capacity
Text lessonPreview
-
14.3.1 Specific Heat Capacity - Check yourself
6 questionsPreview
-
15.2.2 Ideal Gas Equation
Text lessonPreview
-
15.2.2 Ideal Gas Equation - Check yourself
12 questionsPreview
-
16.1.1 Internal energy
Text lessonPreview
-
16.1.1 Internal energy - Check yourself
6 questionsPreview
-
16.2.1 Work Done by a Gas
Text lessonPreview
-
16.2.1 Work Done by a Gas - Check yourself
6 questionsPreview
-
16.2.2 The First Law of Thermodynamics
Text lessonPreview
-
16.2.2 The First Law of Thermodynamics - Check yourself
6 questionsPreview
-
17.1.5 SHM Graphs
Text lessonPreview
-
17.1.5 SHM Graphs - Check yourself
6 questionsPreview
-
17.2.1 Energy in SHM
Text lessonPreview
-
17.2.1 Energy in SHM - Check yourself
6 questionsPreview
-
17.3.1 Damping
Text lessonPreview
-
17.3.1 Damping - Check yourself
6 questionsPreview
-
17.3.2 Resonance
Text lessonPreview
-
17.3.2 Resonance - Check yourself
6 questionsPreview
-
6.1.3 Angular Speed
Text lessonPreview
-
6.1.4 Centripetal Acceleration
Text lessonPreview
-
6.1.5 Centripetal Force
Text lessonPreview
-
6.2.1 Conditions for Simple Harmonic Motion
Text lessonPreview
-
6.2.2 SHM Graphs
Text lessonPreview
-
6.2.7 Energy in SHM
Text lessonPreview
-
6.3.1 Damping
Text lessonPreview
-
6.3.2 Free and Forced Oscillations
Text lessonPreview
-
6.4.1 Internal Energy
Text lessonPreview
-
6.4.2 The First Law of Thermodynamics
Text lessonPreview
-
6.4.3 Specific Heat Capacity
Text lessonPreview
-
6.5.3 Ideal Gas Equation
Text lessonPreview
-
6.5.4 Work Done by a Gas
Text lessonPreview
-
6.6.2 Kinetic Theory of Gases Equation
Text lessonPreview
-
6.6.3 Average Molecular Kinetic Energy
Text lessonPreview
7. Fields and Their Consequences
0/111
-
7. Fields and Their Consequences
Text lessonPreview
-
4.3.2 Electric Field Strength
Text lessonPreview
-
4.3.2 Electric Field Strength - Check yourself
6 questionsPreview
-
4.4.2 Energy Stored by a Capacitor
Text lessonPreview
-
4.4.2 Energy Stored by a Capacitor - Check yourself
6 questionsPreview
-
4.5.3 Magnetic Force on a Current-Carrying Conductor
Text lessonPreview
-
4.5.3 Magnetic Force on a Current-Carrying Conductor - Check yourself
6 questionsPreview
-
7.1.1 Force Fields
Text lessonPreview
-
7.1.1 Force Fields - Check yourself
6 questionsPreview
-
7.1.3 Representing Gravitational Fields
Text lessonPreview
-
7.1.3 Representing Gravitational Fields - Check yourself
6 questionsPreview
-
7.1.4 Newton's Law of Gravitation
Text lessonPreview
-
7.1.4 Newton's Law of Gravitation - Check yourself
6 questionsPreview
-
7.1.5 Gravitational Field Strength in a Radial Field
Text lessonPreview
-
7.1.5 Gravitational Field Strength in a Radial Field - Check yourself
6 questionsPreview
-
7.2.2 Calculating Gravitational Potential
Text lessonPreview
-
7.2.2 Calculating Gravitational Potential - Check yourself
6 questionsPreview
-
7.2.3 Graphical Representation of Gravitational Potential
Text lessonPreview
-
7.2.3 Graphical Representation of Gravitational Potential - Check yourself
6 questionsPreview
-
7.2.4 Work Done on a Mass
Text lessonPreview
-
7.2.4 Work Done on a Mass - Check yourself
6 questionsPreview
-
7.3.2 Energy of an Orbiting Satellite
Text lessonPreview
-
7.3.2 Energy of an Orbiting Satellite - Check yourself
6 questionsPreview
-
7.3.3 Escape Velocity
Text lessonPreview
-
7.3.3 Escape Velocity - Check yourself
6 questionsPreview
-
7.4.1 Coulomb's Law
Text lessonPreview
-
7.4.1 Coulomb's Law - Check yourself
6 questionsPreview
-
7.4.4 Uniform Electric Field
Text lessonPreview
-
7.4.4 Uniform Electric Field - Check yourself
6 questionsPreview
-
7.4.6 Radial Electric Field
Text lessonPreview
-
7.4.6 Radial Electric Field - Check yourself
6 questionsPreview
-
7.4.7 Comparing Gravitational and Electrostatic Forces
Text lessonPreview
-
7.4.7 Comparing Gravitational and Electrostatic Forces - Check yourself
6 questionsPreview
-
7.5.2 Graphical Representation of Electric Potential
Text lessonPreview
-
7.5.2 Graphical Representation of Electric Potential - Check yourself
6 questionsPreview
-
7.5.3 Work Done on a Charge
Text lessonPreview
-
7.5.3 Work Done on a Charge - Check yourself
6 questionsPreview
-
7.6.2 Parallel Plate Capacitor
Text lessonPreview
-
7.6.2 Parallel Plate Capacitor - Check yourself
6 questionsPreview
-
7.7.1 Charge and Discharge Graphs
Text lessonPreview
-
7.7.1 Charge and Discharge Graphs - Check yourself
6 questionsPreview
-
7.7.2 The Time Constant
Text lessonPreview
-
7.7.2 The Time Constant - Check yourself
6 questionsPreview
-
7.7.3 Charge and Discharge Equations
Text lessonPreview
-
7.7.3 Charge and Discharge Equations - Check yourself
6 questionsPreview
-
7.7.4 Required Practical- Charging and Discharging Capacitors
Text lessonPreview
-
7.7.4 Required Practical- Charging and Discharging Capacitors - Check yourself
6 questionsPreview
-
7.8.5 Circular Path of Particles
Text lessonPreview
-
7.8.5 Circular Path of Particles - Check yourself
6 questionsPreview
-
7.8.6 Required Practical- Investigating Magnetic Fields in Wires
Text lessonPreview
-
7.8.6 Required Practical- Investigating Magnetic Fields in Wires - Check yourself
6 questionsPreview
-
7.9.5 Applications of EM Induction
Text lessonPreview
-
7.9.5 Applications of EM Induction - Check yourself
6 questionsPreview
-
7.9.6 Required Practical- Investigating Flux Linkage on a Search Coil
Text lessonPreview
-
7.9.6 Required Practical- Investigating Flux Linkage on a Search Coil - Check yourself
6 questionsPreview
-
7.10.2 The Operation of an Oscilloscope
Text lessonPreview
-
7.10.2 The Operation of an Oscilloscope - Check yourself
6 questionsPreview
-
7.10.3 The Operation of a Transformer
Text lessonPreview
-
7.10.3 The Operation of a Transformer - Check yourself
6 questionsPreview
-
7.10.4 Transformer Efficiency
Text lessonPreview
-
7.10.4 Transformer Efficiency - Check yourself
6 questionsPreview
-
7.10.5 Transformer Inefficiencies
Text lessonPreview
-
7.10.5 Transformer Inefficiencies - Check yourself
6 questionsPreview
-
13.2.3 Circular Orbits in Gravitational Fields
Text lessonPreview
-
13.2.3 Circular Orbits in Gravitational Fields - Check yourself
6 questionsPreview
-
13.2.4 Geostationary Orbits
Text lessonPreview
-
13.2.4 Geostationary Orbits - Check yourself
6 questionsPreview
-
13.3.1 Gravitational Field Strength
Text lessonPreview
-
13.3.1 Gravitational Field Strength - Check yourself
6 questionsPreview
-
13.4.1 Gravitational Potential
Text lessonPreview
-
13.4.1 Gravitational Potential - Check yourself
6 questionsPreview
-
18.1.2 Electric Field Lines
Text lessonPreview
-
18.1.2 Electric Field Lines - Check yourself
6 questionsPreview
-
18.2.2 Motion of Charged Particles
Text lessonPreview
-
18.2.2 Motion of Charged Particles - Check yourself
6 questionsPreview
-
18.5.1 Electric Potential
Text lessonPreview
-
18.5.1 Electric Potential - Check yourself
6 questionsPreview
-
19.1.1 Capacitance
Text lessonPreview
-
19.1.1 Capacitance - Check yourself
6 questionsPreview
-
20.2.1 Magnetic Flux Density
Text lessonPreview
-
20.2.1 Magnetic Flux Density - Check yourself
6 questionsPreview
-
20.3.1 Fleming's Left-Hand Rule
Text lessonPreview
-
20.3.1 Fleming's Left-Hand Rule - Check yourself
6 questionsPreview
-
20.3.2 Force on a Moving Charge
Text lessonPreview
-
20.3.2 Force on a Moving Charge - Check yourself
6 questionsPreview
-
20.5.1 Magnetic Flux
Text lessonPreview
-
20.5.1 Magnetic Flux - Check yourself
6 questionsPreview
-
20.5.2 Magnetic Flux Linkage
Text lessonPreview
-
20.5.2 Magnetic Flux Linkage - Check yourself
6 questionsPreview
-
20.5.3 Principles of Electromagnetic Induction
Text lessonPreview
-
20.5.3 Principles of Electromagnetic Induction - Check yourself
6 questionsPreview
-
20.5.4 Faraday's and Lenz's Laws
Text lessonPreview
-
20.5.4 Faraday's and Lenz's Laws - Check yourself
6 questionsPreview
-
21.1.1 Alternating Current and Voltage
Text lessonPreview
-
21.1.1 Alternating Current and Voltage - Check yourself
6 questionsPreview
-
7.10.1 Alternating Current and Voltage
Text lessonPreview
-
7.3.1 Circular Orbits in Gravitational Fields
Text lessonPreview
-
7.3.4 Geostationary Orbits
Text lessonPreview
-
7.4.2 Electric Field Lines
Text lessonPreview
-
7.4.3 Electric Field Strength
Text lessonPreview
-
7.4.5 Motion of Charged Particles
Text lessonPreview
-
7.6.1 Capacitance
Text lessonPreview
-
7.6.3 Energy Stored by a Capacitor
Text lessonPreview
-
7.8.1 Magnetic Flux Density
Text lessonPreview
-
7.8.2 Magnetic Force on a Current-Carrying Conductor
Text lessonPreview
-
7.8.3 Fleming's Left Hand Rule
Text lessonPreview
-
7.8.4 Force on a Moving Charge
Text lessonPreview
-
7.9.1 Magnetic Flux
Text lessonPreview
-
7.9.2 Magnetic Flux Linkage
Text lessonPreview
-
7.9.3 Principles of Electromagnetic Induction
Text lessonPreview
-
7.9.4 Faraday's and Lenz's Laws
Text lessonPreview
8. Nuclear Physics
0/56
-
8. Nuclear Physics
Text lessonPreview
-
5.4.1 Background Radiation
Text lessonPreview
-
5.4.1 Background Radiation - Check yourself
6 questionsPreview
-
5.4.2 Alpha, Beta and Gamma Radiation
Text lessonPreview
-
5.4.2 Alpha, Beta and Gamma Radiation - Check yourself
6 questionsPreview
-
8.1.1 Rutherford Scattering
Text lessonPreview
-
8.1.1 Rutherford Scattering - Check yourself
6 questionsPreview
-
8.1.2 Changing Models of the Nucleus
Text lessonPreview
-
8.1.2 Changing Models of the Nucleus - Check yourself
6 questionsPreview
-
8.1.4 Inverse-Square Law of Gamma Radiation
Text lessonPreview
-
8.1.4 Inverse-Square Law of Gamma Radiation - Check yourself
6 questionsPreview
-
8.1.6 Radiation Safety
Text lessonPreview
-
8.1.6 Radiation Safety - Check yourself
6 questionsPreview
-
8.1.7 Required Practical- Inverse Square-Law for Gamma Radiation
Text lessonPreview
-
8.1.7 Required Practical- Inverse Square-Law for Gamma Radiation - Check yourself
6 questionsPreview
-
8.2.1 Radioactive Decay
Text lessonPreview
-
8.2.1 Radioactive Decay - Check yourself
6 questionsPreview
-
8.2.2 Exponential Decay
Text lessonPreview
-
8.2.2 Exponential Decay - Check yourself
6 questionsPreview
-
8.2.4 Applications of Radioactivity
Text lessonPreview
-
8.2.4 Applications of Radioactivity - Check yourself
6 questionsPreview
-
8.3.1 Nuclear Instability
Text lessonPreview
-
8.3.1 Nuclear Instability - Check yourself
6 questionsPreview
-
8.3.3 Nuclear Excited States
Text lessonPreview
-
8.3.3 Nuclear Excited States - Check yourself
6 questionsPreview
-
8.3.4 Nuclear Radius
Text lessonPreview
-
8.3.4 Nuclear Radius - Check yourself
6 questionsPreview
-
8.3.5 Closest Approach Estimate
Text lessonPreview
-
8.3.5 Closest Approach Estimate - Check yourself
6 questionsPreview
-
8.3.6 Nuclear Radius Equation
Text lessonPreview
-
8.3.6 Nuclear Radius Equation - Check yourself
6 questionsPreview
-
8.3.7 Nuclear Density
Text lessonPreview
-
8.3.7 Nuclear Density - Check yourself
6 questionsPreview
-
8.4.2 Mass Difference and Binding Energy
Text lessonPreview
-
8.4.2 Mass Difference and Binding Energy - Check yourself
6 questionsPreview
-
8.4.4 Binding Energy
Text lessonPreview
-
8.4.4 Binding Energy - Check yourself
6 questionsPreview
-
8.4.5 Induced Fission
Text lessonPreview
-
8.4.5 Induced Fission - Check yourself
6 questionsPreview
-
8.4.6 Operation of a Nuclear Reactor
Text lessonPreview
-
8.4.6 Operation of a Nuclear Reactor - Check yourself
6 questionsPreview
-
8.4.7 Safety Aspects of Nuclear Reactors
Text lessonPreview
-
8.4.7 Safety Aspects of Nuclear Reactors - Check yourself
6 questionsPreview
-
11.1.5 Decay Equations
Text lessonPreview
-
11.1.5 Decay Equations - Check yourself
6 questionsPreview
-
23.1.1 Energy and Mass Equivalence
Text lessonPreview
-
23.1.1 Energy and Mass Equivalence - Check yourself
6 questionsPreview
-
23.1.4 Nuclear Fusion and Fission
Text lessonPreview
-
23.1.4 Nuclear Fusion and Fission - Check yourself
6 questionsPreview
-
23.2.3 Half-Life
Text lessonPreview
-
23.2.3 Half-Life - Check yourself
6 questionsPreview
-
8.1.3 Alpha, Beta and Gamma Radiation
Text lessonPreview
-
8.1.5 Background Radiation
Text lessonPreview
-
8.3.2 Decay Equations
Text lessonPreview
-
8.4.1 Energy and Mass Equivalence
Text lessonPreview
-
8.4.3 Nuclear Fusion and Fission
Text lessonPreview
9. Astrophysics
0/65
-
9. Astrophysics
Text lessonPreview
-
5.9.4 The Hertzsprung-Russell Diagram
Text lessonPreview
-
5.9.4 The Hertzsprung-Russell Diagram - Check yourself
6 questionsPreview
-
9.1.1 Lenses and Ray Diagrams for Telescopes
Text lessonPreview
-
9.1.1 Lenses and Ray Diagrams for Telescopes - Check yourself
6 questionsPreview
-
9.1.2 Refracting Telescopes
Text lessonPreview
-
9.1.2 Refracting Telescopes - Check yourself
6 questionsPreview
-
9.1.3 Reflecting Telescopes
Text lessonPreview
-
9.1.3 Reflecting Telescopes - Check yourself
6 questionsPreview
-
9.1.4 Reflecting vs Refracting Telescopes
Text lessonPreview
-
9.1.4 Reflecting vs Refracting Telescopes - Check yourself
6 questionsPreview
-
9.1.5 Resolving Power of Telescopes
Text lessonPreview
-
9.1.5 Resolving Power of Telescopes - Check yourself
6 questionsPreview
-
9.1.6 Collecting Power of Telescopes
Text lessonPreview
-
9.1.6 Collecting Power of Telescopes - Check yourself
6 questionsPreview
-
9.1.7 Radio, IR, UV and X-Ray Telescopes
Text lessonPreview
-
9.1.7 Radio, IR, UV and X-Ray Telescopes - Check yourself
6 questionsPreview
-
9.1.8 Charge-Coupled Devices (CCDs) in Astronomy
Text lessonPreview
-
9.1.8 Charge-Coupled Devices (CCDs) in Astronomy - Check yourself
6 questionsPreview
-
9.2.1 Brightness and Apparent Magnitude
Text lessonPreview
-
9.2.1 Brightness and Apparent Magnitude - Check yourself
6 questionsPreview
-
9.2.2 Inverse Square Law of Radiation
Text lessonPreview
-
9.2.2 Inverse Square Law of Radiation - Check yourself
6 questionsPreview
-
9.2.3 Astronomical Distances
Text lessonPreview
-
9.2.3 Astronomical Distances - Check yourself
6 questionsPreview
-
9.2.4 Absolute Magnitude
Text lessonPreview
-
9.2.4 Absolute Magnitude - Check yourself
6 questionsPreview
-
9.2.6 Stefan's Law
Text lessonPreview
-
9.2.6 Stefan's Law - Check yourself
6 questionsPreview
-
9.2.7 Emission and Absorption Spectra in Stars
Text lessonPreview
-
9.2.7 Emission and Absorption Spectra in Stars - Check yourself
6 questionsPreview
-
9.2.8 Stellar Spectral Classes
Text lessonPreview
-
9.2.8 Stellar Spectral Classes - Check yourself
6 questionsPreview
-
9.2.9 Star Formation
Text lessonPreview
-
9.2.9 Star Formation - Check yourself
6 questionsPreview
-
9.2.10 Life Cycle of a Low Mass Star
Text lessonPreview
-
9.2.10 Life Cycle of a Low Mass Star - Check yourself
6 questionsPreview
-
9.2.11 Life Cycle of a High Mass Star
Text lessonPreview
-
9.2.11 Life Cycle of a High Mass Star - Check yourself
6 questionsPreview
-
9.2.12 Supernovae and Gamma Ray Bursts (GRBs)
Text lessonPreview
-
9.2.12 Supernovae and Gamma Ray Bursts (GRBs) - Check yourself
6 questionsPreview
-
9.2.13 Supernovae as Standard Candles
Text lessonPreview
-
9.2.13 Supernovae as Standard Candles - Check yourself
6 questionsPreview
-
9.2.14 Neutron Stars and Black Holes
Text lessonPreview
-
9.2.14 Neutron Stars and Black Holes - Check yourself
6 questionsPreview
-
9.3.1 The Doppler Effect of Light
Text lessonPreview
-
9.3.1 The Doppler Effect of Light - Check yourself
6 questionsPreview
-
9.3.2 Binary Star Systems
Text lessonPreview
-
9.3.2 Binary Star Systems - Check yourself
6 questionsPreview
-
9.3.3 Galactic Redshift
Text lessonPreview
-
9.3.3 Galactic Redshift - Check yourself
6 questionsPreview
-
9.3.4 Hubble's Law
Text lessonPreview
-
9.3.4 Hubble's Law - Check yourself
6 questionsPreview
-
9.3.5 Evidence for the Big Bang
Text lessonPreview
-
9.3.5 Evidence for the Big Bang - Check yourself
6 questionsPreview
-
9.3.6 Dark Energy
Text lessonPreview
-
9.3.6 Dark Energy - Check yourself
6 questionsPreview
-
9.3.7 Quasars
Text lessonPreview
-
9.3.7 Quasars - Check yourself
6 questionsPreview
-
9.3.8 Exoplanets
Text lessonPreview
-
9.3.8 Exoplanets - Check yourself
6 questionsPreview
-
25.2.1 Wien's Displacement Law
Text lessonPreview
-
25.2.1 Wien's Displacement Law - Check yourself
6 questionsPreview
-
9.2.15 The Hertzsprung–Russell Diagram
Text lessonPreview
-
9.2.5 Wien's Displacement Law
Text lessonPreview
10. Medical Physics
0/64
-
10. Medical Physics
Text lessonPreview
-
5.3.6 Converging and Diverging Lenses
Text lessonPreview
-
5.3.6 Converging and Diverging Lenses - Check yourself
6 questionsPreview
-
10.1.2 Lens Calculations
Text lessonPreview
-
10.1.2 Lens Calculations - Check yourself
6 questionsPreview
-
10.1.3 Structure of the Eye
Text lessonPreview
-
10.1.3 Structure of the Eye - Check yourself
6 questionsPreview
-
10.1.4 Sensitivity of the Eye
Text lessonPreview
-
10.1.4 Sensitivity of the Eye - Check yourself
6 questionsPreview
-
10.1.5 Spatial Resolution of the Eye
Text lessonPreview
-
10.1.5 Spatial Resolution of the Eye - Check yourself
6 questionsPreview
-
10.1.6 Defects of Vision
Text lessonPreview
-
10.1.6 Defects of Vision - Check yourself
6 questionsPreview
-
10.2.1 Structure of the Ear
Text lessonPreview
-
10.2.1 Structure of the Ear - Check yourself
6 questionsPreview
-
10.2.2 The Decibel Scale
Text lessonPreview
-
10.2.2 The Decibel Scale - Check yourself
6 questionsPreview
-
10.2.3 Equal Loudness Curves
Text lessonPreview
-
10.2.3 Equal Loudness Curves - Check yourself
6 questionsPreview
-
10.2.4 Defects of Hearing
Text lessonPreview
-
10.2.4 Defects of Hearing - Check yourself
6 questionsPreview
-
10.3.1 ECG Machines
Text lessonPreview
-
10.3.1 ECG Machines - Check yourself
6 questionsPreview
-
10.4.2 Generation and Detection of Ultrasound
Text lessonPreview
-
10.4.2 Generation and Detection of Ultrasound - Check yourself
6 questionsPreview
-
10.4.3 Ultrasound Imaging
Text lessonPreview
-
10.4.3 Ultrasound Imaging - Check yourself
6 questionsPreview
-
10.4.4 Applications of Ultrasound
Text lessonPreview
-
10.4.4 Applications of Ultrasound - Check yourself
6 questionsPreview
-
10.4.5 Fibre Optics and Endoscopy
Text lessonPreview
-
10.4.5 Fibre Optics and Endoscopy - Check yourself
6 questionsPreview
-
10.4.6 Magnetic Resonance Imaging
Text lessonPreview
-
10.4.6 Magnetic Resonance Imaging - Check yourself
6 questionsPreview
-
10.5.1 Production of X-rays
Text lessonPreview
-
10.5.1 Production of X-rays - Check yourself
6 questionsPreview
-
10.5.2 Rotating-Anode X-ray Tube
Text lessonPreview
-
10.5.2 Rotating-Anode X-ray Tube - Check yourself
6 questionsPreview
-
10.5.3 Using X-rays in Medical Imaging
Text lessonPreview
-
10.5.3 Using X-rays in Medical Imaging - Check yourself
6 questionsPreview
-
10.5.4 X-ray Detection
Text lessonPreview
-
10.5.4 X-ray Detection - Check yourself
6 questionsPreview
-
10.5.5 Attenuation of X-rays
Text lessonPreview
-
10.5.5 Attenuation of X-rays - Check yourself
6 questionsPreview
-
10.5.6 The CT Scanner
Text lessonPreview
-
10.5.6 The CT Scanner - Check yourself
6 questionsPreview
-
10.6.2 The Molybdenum-Technetium Generator
Text lessonPreview
-
10.6.2 The Molybdenum-Technetium Generator - Check yourself
6 questionsPreview
-
10.6.3 The PET Scanner
Text lessonPreview
-
10.6.3 The PET Scanner - Check yourself
6 questionsPreview
-
10.6.4 Physical, Biological and Effective Half Life
Text lessonPreview
-
10.6.4 Physical, Biological and Effective Half Life - Check yourself
6 questionsPreview
-
10.6.5 Gamma Camera
Text lessonPreview
-
10.6.5 Gamma Camera - Check yourself
6 questionsPreview
-
10.6.6 Radiotherapy
Text lessonPreview
-
10.6.6 Radiotherapy - Check yourself
6 questionsPreview
-
10.6.7 Comparing Imaging Techniques
Text lessonPreview
-
10.6.7 Comparing Imaging Techniques - Check yourself
6 questionsPreview
-
24.1.1 The Piezoelectric Transducer
Text lessonPreview
-
24.1.1 The Piezoelectric Transducer - Check yourself
6 questionsPreview
-
24.3.1 Radioactive Tracers
Text lessonPreview
-
24.3.1 Radioactive Tracers - Check yourself
6 questionsPreview
-
10.1.1 Converging and Diverging Lenses
Text lessonPreview
-
10.4.1 The Piezoelectric Transducer
Text lessonPreview
-
10.6.1 Radioactive Tracers
Text lessonPreview
11. Engineering Physics
0/46
-
11. Engineering Physics
Text lessonPreview
-
11.1.1 Rotational Motion
Text lessonPreview
-
11.1.1 Rotational Motion - Check yourself
6 questionsPreview
-
11.1.2 Angular Acceleration Equations
Text lessonPreview
-
11.1.2 Angular Acceleration Equations - Check yourself
6 questionsPreview
-
11.1.3 Torque
Text lessonPreview
-
11.1.3 Torque - Check yourself
6 questionsPreview
-
11.1.4 Moment of Inertia
Text lessonPreview
-
11.1.4 Moment of Inertia - Check yourself
6 questionsPreview
-
11.1.5 Newton’s Second Law for Rotation
Text lessonPreview
-
11.1.5 Newton’s Second Law for Rotation - Check yourself
6 questionsPreview
-
11.1.6 Angular Momentum
Text lessonPreview
-
11.1.6 Angular Momentum - Check yourself
6 questionsPreview
-
11.1.7 Angular Impulse
Text lessonPreview
-
11.1.7 Angular Impulse - Check yourself
6 questionsPreview
-
11.1.8 Rotational Work and Power
Text lessonPreview
-
11.1.8 Rotational Work and Power - Check yourself
6 questionsPreview
-
11.1.9 Rotational Kinetic Energy
Text lessonPreview
-
11.1.9 Rotational Kinetic Energy - Check yourself
6 questionsPreview
-
11.1.10 Flywheels in Machines
Text lessonPreview
-
11.1.10 Flywheels in Machines - Check yourself
6 questionsPreview
-
11.2.2 p–V Diagrams
Text lessonPreview
-
11.2.2 p–V Diagrams - Check yourself
6 questionsPreview
-
11.2.3 Thermodynamic Processes
Text lessonPreview
-
11.2.3 Thermodynamic Processes - Check yourself
6 questionsPreview
-
11.2.4 Petrol Engine Cycle
Text lessonPreview
-
11.2.4 Petrol Engine Cycle - Check yourself
6 questionsPreview
-
11.2.5 Diesel Engine Cycle
Text lessonPreview
-
11.2.5 Diesel Engine Cycle - Check yourself
6 questionsPreview
-
11.2.6 Comparing Petrol and Diesel Engines
Text lessonPreview
-
11.2.6 Comparing Petrol and Diesel Engines - Check yourself
6 questionsPreview
-
11.2.7 Power Output of an Engine
Text lessonPreview
-
11.2.7 Power Output of an Engine - Check yourself
6 questionsPreview
-
11.2.8 Engine Efficiency
Text lessonPreview
-
11.2.8 Engine Efficiency - Check yourself
6 questionsPreview
-
11.2.9 The Second Law of Thermodynamics
Text lessonPreview
-
11.2.9 The Second Law of Thermodynamics - Check yourself
6 questionsPreview
-
11.2.10 Heat Engines
Text lessonPreview
-
11.2.10 Heat Engines - Check yourself
6 questionsPreview
-
11.2.11 Limitations of Real Heat Engines
Text lessonPreview
-
11.2.11 Limitations of Real Heat Engines - Check yourself
6 questionsPreview
-
11.2.12 Reversed Heat Engines
Text lessonPreview
-
11.2.12 Reversed Heat Engines - Check yourself
6 questionsPreview
-
11.2.13 Coefficients of Performance
Text lessonPreview
-
11.2.13 Coefficients of Performance - Check yourself
6 questionsPreview
-
11.2.1 The First Law of Thermodynamics
Text lessonPreview
12. Turning Points in Physics
0/56
-
12. Turning Points in Physics
Text lessonPreview
-
4.6.3 Thermionic Emission
Text lessonPreview
-
4.6.3 Thermionic Emission - Check yourself
6 questionsPreview
-
12.1.1 Cathode Rays
Text lessonPreview
-
12.1.1 Cathode Rays - Check yourself
6 questionsPreview
-
12.1.3 Specific Charge Experiments
Text lessonPreview
-
12.1.3 Specific Charge Experiments - Check yourself
6 questionsPreview
-
12.1.4 Significance of Thomson's Experiment
Text lessonPreview
-
12.1.4 Significance of Thomson's Experiment - Check yourself
6 questionsPreview
-
12.1.5 Millikan’s Oil Drop Experiment
Text lessonPreview
-
12.1.5 Millikan’s Oil Drop Experiment - Check yourself
6 questionsPreview
-
12.1.6 Stokes' Law
Text lessonPreview
-
12.1.6 Stokes' Law - Check yourself
6 questionsPreview
-
12.2.1 Theories of Light
Text lessonPreview
-
12.2.1 Theories of Light - Check yourself
6 questionsPreview
-
12.2.2 Young's Double Slit Interference
Text lessonPreview
-
12.2.2 Young's Double Slit Interference - Check yourself
6 questionsPreview
-
12.2.3 Maxwell's Wave Equation
Text lessonPreview
-
12.2.3 Maxwell's Wave Equation - Check yourself
6 questionsPreview
-
12.2.4 Hertz's Discovery of Radio Waves
Text lessonPreview
-
12.2.4 Hertz's Discovery of Radio Waves - Check yourself
6 questionsPreview
-
12.2.5 Fizeau's Speed of Light Experiment
Text lessonPreview
-
12.2.5 Fizeau's Speed of Light Experiment - Check yourself
6 questionsPreview
-
12.2.6 UV Catastrophe and Black-Body Radiation
Text lessonPreview
-
12.2.6 UV Catastrophe and Black-Body Radiation - Check yourself
6 questionsPreview
-
12.2.7 The Discovery of Photoelectricity
Text lessonPreview
-
12.2.7 The Discovery of Photoelectricity - Check yourself
6 questionsPreview
-
12.2.8 De Broglie's Hypothesis
Text lessonPreview
-
12.2.8 De Broglie's Hypothesis - Check yourself
6 questionsPreview
-
12.2.9 Electron Diffraction
Text lessonPreview
-
12.2.9 Electron Diffraction - Check yourself
6 questionsPreview
-
12.2.10 Transmission Electron Microscope
Text lessonPreview
-
12.2.10 Transmission Electron Microscope - Check yourself
6 questionsPreview
-
12.2.11 Scanning Tunnelling Microscope
Text lessonPreview
-
12.2.11 Scanning Tunnelling Microscope - Check yourself
6 questionsPreview
-
12.3.1 The Michelson-Morley Interferometer
Text lessonPreview
-
12.3.1 The Michelson-Morley Interferometer - Check yourself
6 questionsPreview
-
12.3.2 The Invariance of the Speed of Light
Text lessonPreview
-
12.3.2 The Invariance of the Speed of Light - Check yourself
6 questionsPreview
-
12.3.3 Inertial Frames of Reference
Text lessonPreview
-
12.3.3 Inertial Frames of Reference - Check yourself
6 questionsPreview
-
12.3.4 Einstein's Postulates
Text lessonPreview
-
12.3.4 Einstein's Postulates - Check yourself
6 questionsPreview
-
12.3.5 Time Dilation
Text lessonPreview
-
12.3.5 Time Dilation - Check yourself
6 questionsPreview
-
12.3.6 Muon Lifetime Experiment
Text lessonPreview
-
12.3.6 Muon Lifetime Experiment - Check yourself
6 questionsPreview
-
12.3.7 Length Contraction
Text lessonPreview
-
12.3.7 Length Contraction - Check yourself
6 questionsPreview
-
12.3.8 Relativistic Mass
Text lessonPreview
-
12.3.8 Relativistic Mass - Check yourself
6 questionsPreview
-
12.3.9 Relativistic Energy
Text lessonPreview
-
12.3.9 Relativistic Energy - Check yourself
6 questionsPreview
-
12.3.10 Bertozzi's Experiment
Text lessonPreview
-
12.3.10 Bertozzi's Experiment - Check yourself
6 questionsPreview
-
12.1.2 Thermionic Emission
Text lessonPreview
Text lesson
2.4.2 Threshold Frequency and Work Function
2.4.2 Threshold Frequency and Work Function — AQA A Level Physics 7408 notes: Explain the photoelectric effect, define threshold frequency and work function, and use f0 = φ/h to analyse experimental observations.
1The photoelectric effect2Photoelectrons3Photoelectrons
The photoelectric effect
The photoelectric effect
When electromagnetic radiation of suitable frequency falls on a clean metal surface, electrons are emitted.
1 / 3Next ▶
Photoelectrons
1
These are called
2
photoelectrons
3
.
4
A classic demonstration uses a zinc plate mounted on a gold-leaf electroscope and given a negative charge.
5
The leaf stays raised because of the excess electrons.
6
If ultraviolet light shines on the clean plate, the leaf falls
showing that the plate is losing electrons.
◀ Previous2 / 3Next ▶
Photoelectrons
Photoelectrons
Visible light, however bright, has no effect on zinc.
If the plate is first charged positively, ultraviolet light does not discharge it,
because any emitted electrons are pulled straight back to the surface.
◀ Previous3 / 3
1Observations that the wave theory cannot explain2Observations that the wave theory cannot explain3Observations that the wave theory cannot explain
Observations that the wave theory cannot explain
Observations that the wave theory cannot explain
Threshold frequency
for each metal there is a minimum frequency f
0
.
Below it no electrons are emitted, however intense the radiation or however long the exposure.
The wave model predicts that a bright enough wave of any frequency would eventually give electrons enough energy.
1 / 3Next ▶
Observations that the wave theory cannot explain
1
No time delay
2
emission starts almost instantly (within about 10
3
−9
4
s), even for very dim light above the threshold.
5
A wave spreading its energy over many atoms would take much longer to build up the energy needed by one electron.
6
Maximum kinetic energy depends on frequency, not intensity
◀ Previous2 / 3Next ▶
Observations that the wave theory cannot explain
1
above f
2
, the maximum kinetic energy of photoelectrons increases linearly with frequency,
3
but increasing the intensity only increases the number of electrons emitted per second, not their energy.
(the photocurrent)
◀ Previous3 / 3
1The photon explanation2The photon explanation3The photon explanation
The photon explanation
The photon explanation
Einstein explained these results by treating light as a stream of photons, each carrying a quantum of energy E = hf
where h = 6.63×10⁻³⁴ J s is the Planck constant and f is the frequency in hertz.
1 / 3Next ▶
The photon explanation
1
One photon interacts with one electron, and it transfers all its energy or none of it.
2
Intensity is the number of photons arriving per second per unit area,
3
so a brighter beam provides more photons and hence more photoelectrons,
4
but each photon has the same energy as before.
5
A dim beam still delivers whole photons
so emission is immediate.
◀ Previous2 / 3Next ▶
Graph of maximum kinetic energy against photon frequency for a metal, with threshold frequency, y-intercept at minus the work function, and gradient h
The photon explanation

◀ Previous3 / 3
1Work function and threshold frequency2Work function and threshold frequency3Work function and threshold frequency4Work function and threshold frequency
Work function and threshold frequency
Work function and threshold frequency
Electrons in a metal are held by attraction to the positive ions
so a minimum energy is needed to free one from the surface.
1 / 4Next ▶
Work function and threshold frequency
1
This is the
2
work function
3
, φ (also written W): the minimum energy needed to remove an electron from the surface of a metal.
4
It is a property of the metal
typical values are 2 to 5 eV (about 3×10
5
−19
6
to 8×10
◀ Previous2 / 4Next ▶
Work function and threshold frequency
1
J).
2
If a photon has energy less than φ, the electron cannot escape and the energy is shared as heat among the lattice. Emission therefore requires hf ≥ φ. The threshold frequency f0 is the minimum frequency of radiation that causes emission, and corresponds to hf0 = φ:
3
f0 = φ / h
4
In terms of wavelength, the corresponding threshold wavelength is λ0 = hc/φ, and emission occurs only for λ ≤ λ0. For example, a metal with a low work function such as caesium (φ ≈ 2.1 eV) responds to visible light, whereas zinc (φ ≈ 4.3 eV) requires ultraviolet.
◀ Previous3 / 4Next ▶
Graph of maximum photoelectron kinetic energy against frequency for sodium, with threshold frequency and work function marked
Work function and threshold frequency
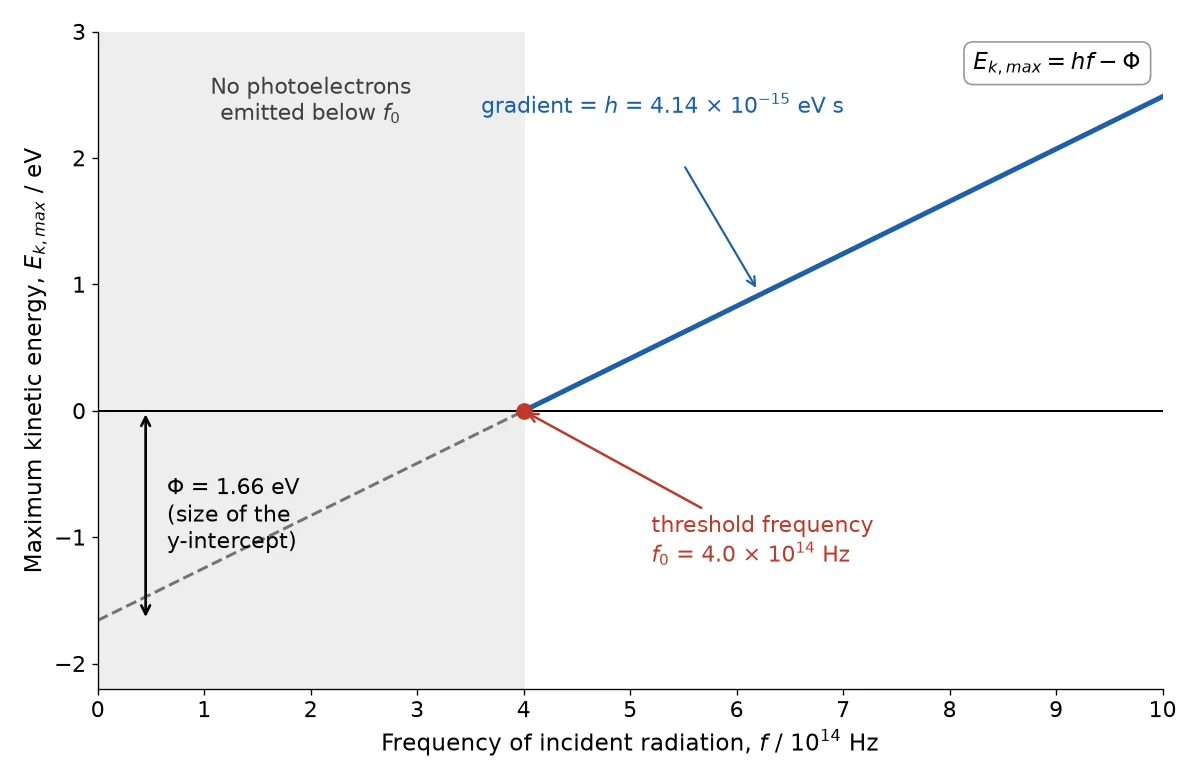
◀ Previous4 / 4
1Graphs and the energy balance2Graphs and the energy balance3Graphs and the energy balance
Graphs and the energy balance
1
Where the photon energy exceeds the work function, the excess becomes kinetic energy of the electron.
2
1
3
The most energetic electrons come from the surface and have maximum kinetic energy E
4
k(max)
5
= hf − φ (developed in the next lesson).
6
2
1 / 3Next ▶
Graphs and the energy balance
Graphs and the energy balance
A graph of E
against f is a straight line with gradient h, intercept on the frequency axis at f
0
and intercept on the energy axis at −φ.
3
Different metals give parallel lines of the same gradient h, displaced along the frequency axis because they have different thresholds.
◀ Previous2 / 3Next ▶
Graphs and the energy balance
Graphs and the energy balance
4
A graph of photocurrent against intensity (at fixed frequency above f
) is a straight line through the origin,
since the current is proportional to the number of photons per second.
◀ Previous3 / 3
1Linking to other topics2Linking to other topics
Linking to other topics
1
The photoelectric effect is key evidence for the particle nature of light and so connects to wave-particle duality (de Broglie wavelength and electron diffraction) and to photon energy in line spectra. It uses the electronvolt as a convenient unit: 1 eV = 1.60×10⁻¹⁹ J. Practical applications include photodiodes, light meters and the image sensors in cameras.
2
Alkali metals such as sodium have thresholds in the visible range because their surface electrons are weakly held.
3
Transition metals such as zinc need ultraviolet
because the attraction between their surface electrons and positive ions is much stronger.
4
Electrons in a metal can be pictured as trapped in an energy well, and the work function is the energy needed to reach the top of it.
5
The stopping potential is the potential difference that just stops photoelectrons from crossing to the collector plate.
6
Changing the intensity alters the photoelectric current but leaves the stopping potential unchanged.
1 / 2Next ▶
Linking to other topics
1
At a fixed intensity, a higher frequency means each photon carries more energy but fewer photons arrive per second
so the current falls.
2
Most photoelectrons are emitted with less than the maximum kinetic energy.
◀ Previous2 / 2
1Worked examples2Worked examples3Worked examples4Worked examples
Worked examples
Worked examples
Worked example 1. The work function of sodium is 2.3 eV. Calculate its threshold frequency and threshold wavelength. (h = 6.63×10⁻³⁴ J s, c = 3.00×10⁸ m s−1, 1 eV = 1.60×10⁻¹⁹ J)
φ = 2.3 × 1.60×10−19 = 3.68×10⁻¹⁹ J.
f0 = φ/h = 3.68×10⁻¹⁹ / 6.63×10−34 = 5.55×10¹⁴ Hz.
λ0 = c/f0 = 3.00×10⁸ / 5.55×1014 = 5.4×10⁻⁷ m (540 nm). Radiation with wavelength shorter than 540 nm (green and beyond) will cause emission.
Worked example 2. Light of frequency 8.0×10¹⁴ Hz falls on zinc (φ = 6.9×10⁻¹⁹ J). Will photoelectrons be emitted? Explain, and say what happens if the intensity is doubled.
Photon energy E = hf = 6.63×10−34 × 8.0×1014 = 5.3×10⁻¹⁹ J.
1 / 4Next ▶
Worked examples
1
E (5.3×10⁻¹⁹ J) is less than φ (6.9×10⁻¹⁹ J)
so no electrons are emitted. Equivalent check: f0 = 6.9×10⁻¹⁹ / 6.63×10−34 = 1.04×10¹⁵ Hzwhich is greater than 8.0×10¹⁴ Hz.
2
Doubling the intensity doubles the number of photons per second but each photon still has too little energy
so there is still no emission.
3
Worked example 3. A photocell is illuminated by ultraviolet light of wavelength 250 nm on a metal with threshold wavelength 330 nm. Show that photoelectrons are emitted.
4
Emission needs λ ≤ λ0. Since 250 nm <
330 nm, emission occurs.
5
Check with energies: E = hc/λ = (6.63×10−34 × 3.00×108) / 250×10−9 = 7.96×10⁻¹⁹ J
φ = hc/λ0 = 6.03×10⁻¹⁹ J. E exceeds φ.
6
What the symbols mean:
◀ Previous2 / 4Next ▶
Worked examples
Worked examples
E = photon energy (J) · h = 6.63 × 10
−34
J s · c = 3.00 × 10
8
m s
−1
◀ Previous3 / 4Next ▶
Worked examples
Worked examples
· λ = wavelength (m)
◀ Previous4 / 4
Key terms
| Term | Meaning |
|---|---|
| Photoelectron | An electron emitted from a surface by the photoelectric effect. |
| Photon | A quantum of electromagnetic radiation with energy E = hf. |
| Work function (φ) | The minimum energy needed to remove an electron from the surface of a metal. |
| Threshold frequency (f0) | The minimum frequency of radiation that causes photoemission: f0 = φ/h. |
| Intensity | The energy (or number of photons) arriving per unit time per unit area. |
| Planck constant (h) | 6.63×10⁻³⁴ J s, relating photon energy to frequency. |
1Avoid these mistakes2Avoid these mistakes3Avoid these mistakes
Avoid these mistakes
1Avoid this
Believing that a more intense beam of low-frequency light can eventually free electrons. Only photon energy decides whether emission occurs.Avoid this
2Avoid this
Saying the work function depends on the incident light. It is a property of the metal surface only.Avoid this
3Avoid this
Confusing threshold frequency with threshold wavelength: emission needs frequency above fAvoid this
1 / 3Next ▶
Avoid these mistakes
0Avoid this
but wavelength below λAvoid this
.Avoid this
4Avoid this
Stating that increasing intensity increases the electrons’ kinetic energy. It increases the number emitted per second.Avoid this
5Avoid this
◀ Previous2 / 3Next ▶
Avoid these mistakes
Forgetting to convert eV to joules (multiply by 1.60×10Avoid this
−19Avoid this
) before dividing by h.Avoid this
◀ Previous3 / 3