Curriculum
Edexcel IAL Physics (IAS & A2)
1. Mechanics and Materials
0/71
2. Waves and Electricity
0/108
3. Practical Skills in Physics I
0/52
-
3. Practical Skills in Physics I
 Preview
-
3.1.1 Identifying Apparatus
Preview
-
3.1.1 Identifying Apparatus - Check yourself
 Preview
-
3.1.2 Range and Resolution of Instruments
Preview
-
3.1.2 Range and Resolution of Instruments - Check yourself
Preview
-
3.1.3 Calibrating Instruments
Preview
-
3.1.3 Calibrating Instruments - Check yourself
Preview
-
3.1.4 Measuring Variables
Preview
-
3.1.4 Measuring Variables - Check yourself
Preview
-
3.1.5 Control Variables and Fair Tests
Preview
-
3.1.5 Control Variables and Fair Tests - Check yourself
Preview
-
3.1.6 Repeat Readings
Preview
-
3.1.6 Repeat Readings - Check yourself
Preview
-
3.1.7 Health and Safety
Preview
-
3.1.7 Health and Safety - Check yourself
Preview
-
3.1.8 Data Collection
Preview
-
3.1.8 Data Collection - Check yourself
Preview
-
3.1.9 Uncertainty and Systematic Errors
Preview
-
3.1.9 Uncertainty and Systematic Errors - Check yourself
Preview
-
3.1.10 Wider Implications
Preview
-
3.1.10 Wider Implications - Check yourself
Preview
-
3.2.1 Number of Readings
Preview
-
3.2.1 Number of Readings - Check yourself
Preview
-
3.2.2 Range of Measurements
Preview
-
3.2.2 Range of Measurements - Check yourself
Preview
-
3.2.3 Significant Figures
Preview
-
3.2.3 Significant Figures - Check yourself
Preview
-
3.2.4 Anomalous Readings
Preview
-
3.2.4 Anomalous Readings - Check yourself
Preview
-
3.2.5 Using a Micrometer
Preview
-
3.2.5 Using a Micrometer - Check yourself
Preview
-
3.2.6 Evaluating Experiments
Preview
-
3.2.6 Evaluating Experiments - Check yourself
Preview
-
3.3.1 Calculations using Experimental Data
Preview
-
3.3.1 Calculations using Experimental Data - Check yourself
Preview
-
3.3.2 Plotting Graphs
Preview
-
3.3.2 Plotting Graphs - Check yourself
Preview
-
3.3.3 Using Units Correctly
Preview
-
3.3.3 Using Units Correctly - Check yourself
Preview
-
3.3.4 Identifying Graphical Relationships
Preview
-
3.3.4 Identifying Graphical Relationships - Check yourself
Preview
-
3.3.5 Interpreting Graphs
Preview
-
3.3.5 Interpreting Graphs - Check yourself
Preview
-
3.3.6 Reducing Errors
Preview
-
3.3.6 Reducing Errors - Check yourself
Preview
-
3.3.7 Suggesting Improvements
Preview
-
3.3.7 Suggesting Improvements - Check yourself
Preview
-
3.3.8 Uncertainties
Preview
-
3.3.8 Uncertainties - Check yourself
Preview
-
3.3.9 Determining Uncertainty
Preview
-
3.3.9 Determining Uncertainty - Check yourself
Preview
-
Edexcel International AS Physics — Complete unit: 3. Practical Skills in Physics I
Preview
4. Further Mechanics, Fields and Particles
0/90
5. Thermodynamics, Radiation, Oscillations and Cosmology
0/96
6. Practical Skills in Physics II
0/11
Text lesson
3.1.3 Calibrating Instruments
3.1.3 Calibrating Instruments — EDEXCEL IAL PHYSICS (IAS & A2) notes: Explain calibration and use calibration checks and calibration curves to correct readings.
1Calibration · Purpose · Zero check2Ageing
1Meaning · Fixed points · Uncalibrated2Other standards
1Calibration curve · When needed · Examples2Use3Course link
Calibration curve · When needed · Examples
Calibration curve
a graph used to convert measurements from one measurement scale to another.
When needed
when the instrument’s output is not proportional to the value being measured.
Examples
The e.m.f. of a thermocouple against temperature.
The resistance of a thermistor against temperature.
1 / 3Next ▶
Use
Use
a curve of voltage against temperature can act as a temperature sensor.
◀ Previous2 / 3Next ▶
Colorimetry calibration curve
Course link
 ⤢ Enlarge
Course link
the calibration curve is used in Core Practical 12, calibrating a thermistor in a potential divider as a thermostat.
◀ Previous3 / 3
1Making a calibration graph2Making a calibration graph3Straight line4Validity
Making a calibration graph
1
1
2
Place the sensor and the reference instrument in the same conditions.
3
2
4
Record at least five pairs of values across the whole range to be used.
5
3
6
Plot the sensor reading against the true value.
1 / 4Next ▶
Making a calibration graph
Making a calibration graph
4
Draw the best-fit line or curve.
5
Read the true value from the graph for any later sensor reading.
◀ Previous2 / 4Next ▶
Straight line
Straight line
its equation y = mx + c can be used to convert directly.
◀ Previous3 / 4Next ▶
Colorimeter and blank calibration
Validity
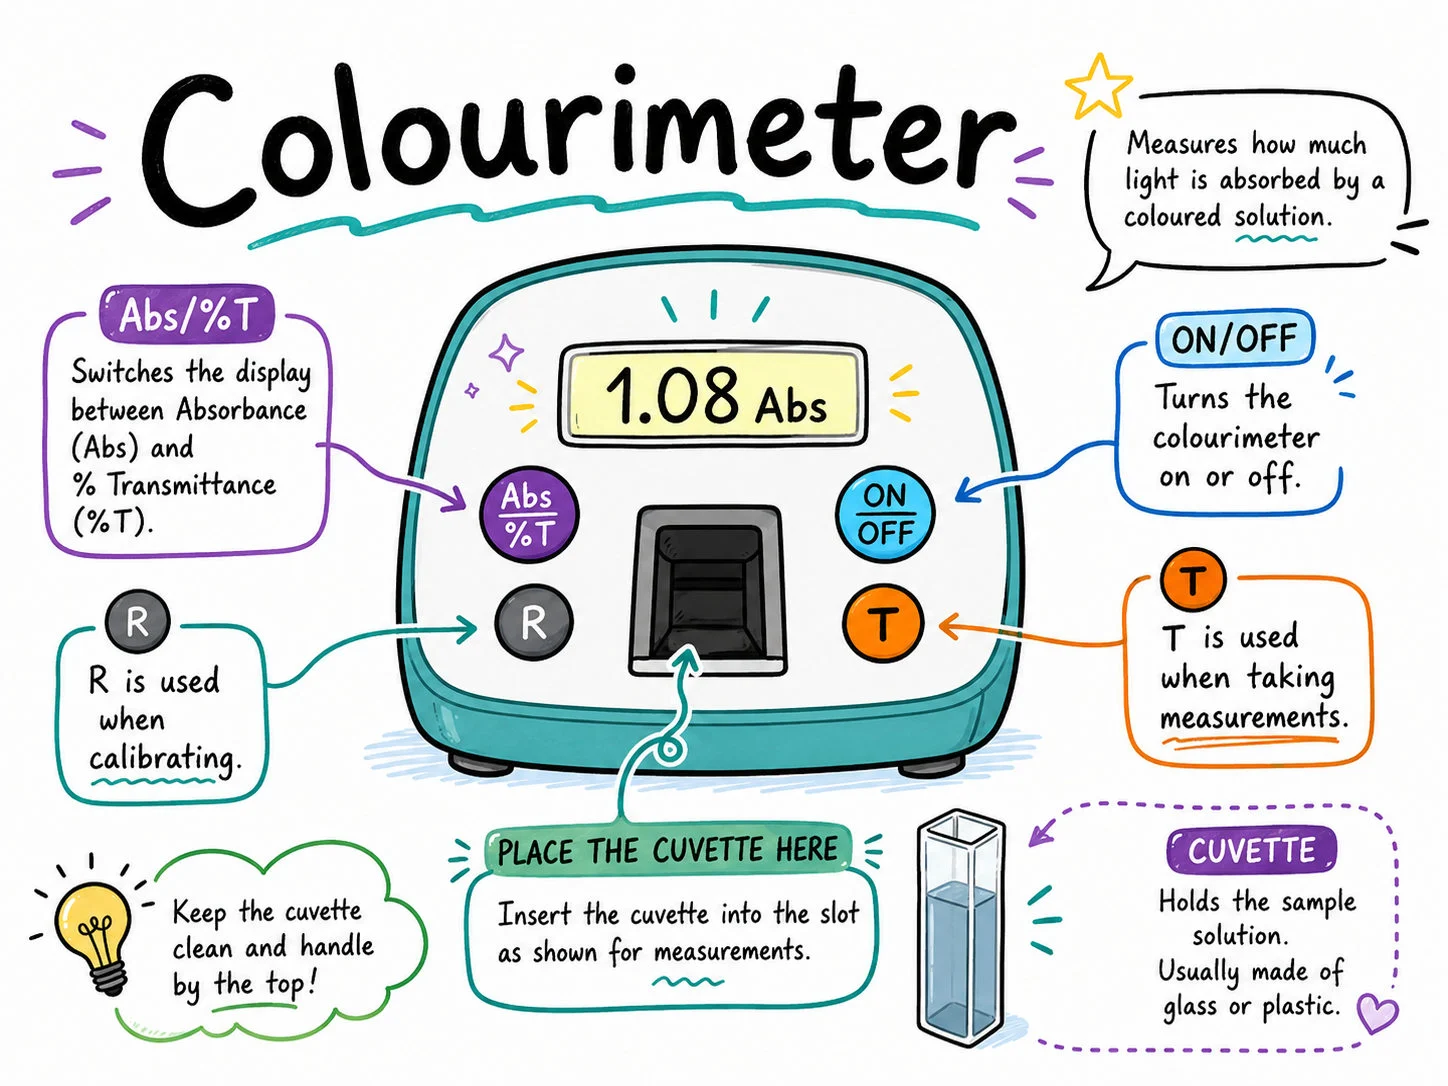 ⤢ Enlarge
Validity
use the graph only within the range and conditions in which it was made.
◀ Previous4 / 4
1Correcting systematic errors2Correcting systematic errors
Correcting systematic errors
Consistent offset
correct each result by that amount.
Proportional scale error
a multiplying correction factor is needed.
Voltmeter example
a meter reading always above the true value has a systematic error, and its calibration curve does not pass through the origin.
Repeats
averaging reduces random error but cannot remove a systematic one.
1 / 2Next ▶
Graph of thermometer reading error against true temperature, with a dashed zero line and an uncalibrated line crossing zero at 50 °C
Correcting systematic errors

◀ Previous2 / 2
1Zero or scale errors · Electrical sensors · Drift2Before and after
1Calibration of Measuring Apparatus
- Checking experimental equipment against certified scientific standards eliminates systematic zero errors and confirms scale linearity across the operating range.
2Instrument Resolution and Absolute Uncertainty
- The resolution of measuring equipment sets the absolute limit of reading uncertainty.
- (such as a micrometer reading to 0.01 mm for wire diameter or a ruler reading to 1 mm for wire length)
3Experimental Variables and Control
- In investigating material properties like Young’s modulus, the independent variable is manipulated while control variables like temperature and specimen length are held constant.
4Minimizing Percentage Uncertainty
- Operating at larger measured quantities or higher electrical power input values reduces percentage uncertainty,
- as percentage uncertainty equals * 100%.
- (absolute uncertainty / measured value)
5Control variable
- A quantity kept the same to make the test fair
6Young modulus
- Ratio of stress to strain for a material, E = σ/ε.
7Independent variable
- The variable deliberately changed, here time
8Dependent variable
- The variable measured, here temperature
9Potential difference
- Work done by a unit charge passing through a component.
10Significant figures
- Digits carrying meaningful information in a number.
11Apparatus
- The equipment needed to carry out an experiment.
12Variable
- A factor that can change in an investigation.
13Resolution
- Smallest change an instrument can detect.
14Length
- Resistance is directly proportional to the length of a wire.
15Uncertainty
- An estimate of the range in which the true value is expected to lie.
16Micrometer
- An instrument measuring very small lengths to 0.01 mm.
- Safety
- Keep electrical equipment away from water; wipe up spills; do not look directly at a bright strobe or lamp
Key terms
| Term | Meaning |
|---|---|
| Calibration | Comparing an instrument with a known standard and correcting or marking its scale. |
| Calibration curve | A graph converting an instrument’s reading to the true value. |
| Fixed point | A reproducible reference condition such as the melting point of ice. |
| Systematic error | An error that shifts all readings in the same way. |
| Zero error | A non-zero reading when the true value is zero. |
1Avoid these mistakes2Avoid these mistakes