Curriculum
Chemistry 2e
Unit 1: Essential Ideas
0/14
-
Unit 1 overview: Essential Ideas
 Text lessonPreview
-
1.1 Chemistry in Context
Text lessonPreview
-
1.1 Chemistry in Context - Check yourself
 6 questionsPreview
-
1.2 Phases and Classification of Matter
Text lessonPreview
-
1.2 Phases and Classification of Matter - Check yourself
6 questionsPreview
-
1.3 Physical and Chemical Properties
Text lessonPreview
-
1.3 Physical and Chemical Properties - Check yourself
6 questionsPreview
-
1.4 Measurements
Text lessonPreview
-
1.4 Measurements - Check yourself
6 questionsPreview
-
1.5 Measurement Uncertainty, Accuracy, and Precision
Text lessonPreview
-
1.5 Measurement Uncertainty, Accuracy, and Precision - Check yourself
6 questionsPreview
-
1.6 Mathematical Treatment of Measurement Results
Text lessonPreview
-
1.6 Mathematical Treatment of Measurement Results - Check yourself
6 questionsPreview
-
Unit 1 review quiz: Essential Ideas
10 questionsPreview
Unit 2: Atoms, Molecules, and Ions
0/16
-
Unit 2 overview: Atoms, Molecules, and Ions
Text lessonPreview
-
2.1 Early Ideas in Atomic Theory
Text lessonPreview
-
2.1 Early Ideas in Atomic Theory - Check yourself
6 questionsPreview
-
2.2 Evolution of Atomic Theory
Text lessonPreview
-
2.2 Evolution of Atomic Theory - Check yourself
6 questionsPreview
-
2.3 Atomic Structure and Symbolism
Text lessonPreview
-
2.3 Atomic Structure and Symbolism - Check yourself
6 questionsPreview
-
2.4 Chemical Formulas
Text lessonPreview
-
2.4 Chemical Formulas - Check yourself
6 questionsPreview
-
2.5 The Periodic Table
Text lessonPreview
-
2.5 The Periodic Table - Check yourself
6 questionsPreview
-
2.6 Ionic and Molecular Compounds
Text lessonPreview
-
2.6 Ionic and Molecular Compounds - Check yourself
6 questionsPreview
-
2.7 Chemical Nomenclature
Text lessonPreview
-
2.7 Chemical Nomenclature - Check yourself
6 questionsPreview
-
Unit 2 review quiz: Atoms, Molecules, and Ions
10 questionsPreview
Unit 3: Composition of Substances and Solutions
0/10
-
Unit 3 overview: Composition of Substances and Solutions
Text lessonPreview
-
3.1 Formula Mass and the Mole Concept
Text lessonPreview
-
3.1 Formula Mass and the Mole Concept - Check yourself
6 questionsPreview
-
3.2 Determining Empirical and Molecular Formulas
Text lessonPreview
-
3.2 Determining Empirical and Molecular Formulas - Check yourself
6 questionsPreview
-
3.3 Molarity
Text lessonPreview
-
3.3 Molarity - Check yourself
6 questionsPreview
-
3.4 Other Units for Solution Concentrations
Text lessonPreview
-
3.4 Other Units for Solution Concentrations - Check yourself
6 questionsPreview
-
Unit 3 review quiz: Composition of Substances and Solutions
10 questionsPreview
Unit 4: Stoichiometry of Chemical Reactions
0/12
-
Unit 4 overview: Stoichiometry of Chemical Reactions
Text lessonPreview
-
4.1 Writing and Balancing Chemical Equations
Text lessonPreview
-
4.1 Writing and Balancing Chemical Equations - Check yourself
6 questionsPreview
-
4.2 Classifying Chemical Reactions
Text lessonPreview
-
4.2 Classifying Chemical Reactions - Check yourself
6 questionsPreview
-
4.3 Reaction Stoichiometry
Text lessonPreview
-
4.3 Reaction Stoichiometry - Check yourself
6 questionsPreview
-
4.4 Reaction Yields
Text lessonPreview
-
4.4 Reaction Yields - Check yourself
6 questionsPreview
-
4.5 Quantitative Chemical Analysis
Text lessonPreview
-
4.5 Quantitative Chemical Analysis - Check yourself
6 questionsPreview
-
Unit 4 review quiz: Stoichiometry of Chemical Reactions
10 questionsPreview
Unit 5: Thermochemistry
0/8
-
Unit 5 overview: Thermochemistry
Text lessonPreview
-
5.1 Energy Basics
Text lessonPreview
-
5.1 Energy Basics - Check yourself
6 questionsPreview
-
5.2 Calorimetry
Text lessonPreview
-
5.2 Calorimetry - Check yourself
7 questionsPreview
-
5.3 Enthalpy
Text lessonPreview
-
5.3 Enthalpy - Check yourself
6 questionsPreview
-
Unit 5 review quiz: Thermochemistry
10 questionsPreview
Unit 6: Electronic Structure and Periodic Properties of Elements
0/12
-
Unit 6 overview: Electronic Structure and Periodic Properties of Elements
Text lessonPreview
-
6.1 Electromagnetic Energy
Text lessonPreview
-
6.1 Electromagnetic Energy - Check yourself
6 questionsPreview
-
6.2 The Bohr Model
Text lessonPreview
-
6.2 The Bohr Model - Check yourself
6 questionsPreview
-
6.3 Development of Quantum Theory
Text lessonPreview
-
6.3 Development of Quantum Theory - Check yourself
6 questionsPreview
-
6.4 Electronic Structure of Atoms (Electron Configurations)
Text lessonPreview
-
6.4 Electronic Structure of Atoms (Electron Configurations) - Check yourself
6 questionsPreview
-
6.5 Periodic Variations in Element Properties
Text lessonPreview
-
6.5 Periodic Variations in Element Properties - Check yourself
6 questionsPreview
-
Unit 6 review quiz: Electronic Structure and Periodic Properties of Elements
10 questionsPreview
Unit 7: Chemical Bonding and Molecular Geometry
0/14
-
Unit 7 overview: Chemical Bonding and Molecular Geometry
Text lessonPreview
-
7.1 Ionic Bonding
Text lessonPreview
-
7.1 Ionic Bonding - Check yourself
6 questionsPreview
-
7.2 Covalent Bonding
Text lessonPreview
-
7.2 Covalent Bonding - Check yourself
6 questionsPreview
-
7.3 Lewis Symbols and Structures
Text lessonPreview
-
7.3 Lewis Symbols and Structures - Check yourself
6 questionsPreview
-
7.4 Formal Charges and Resonance
Text lessonPreview
-
7.4 Formal Charges and Resonance - Check yourself
6 questionsPreview
-
7.5 Strengths of Ionic and Covalent Bonds
Text lessonPreview
-
7.5 Strengths of Ionic and Covalent Bonds - Check yourself
6 questionsPreview
-
7.6 Molecular Structure and Polarity
Text lessonPreview
-
7.6 Molecular Structure and Polarity - Check yourself
6 questionsPreview
-
Unit 7 review quiz: Chemical Bonding and Molecular Geometry
10 questionsPreview
Unit 8: Advanced Theories of Covalent Bonding
0/10
-
Unit 8 overview: Advanced Theories of Covalent Bonding
Text lessonPreview
-
8.1 Valence Bond Theory
Text lessonPreview
-
8.1 Valence Bond Theory - Check yourself
6 questionsPreview
-
8.2 Hybrid Atomic Orbitals
Text lessonPreview
-
8.2 Hybrid Atomic Orbitals - Check yourself
6 questionsPreview
-
8.3 Multiple Bonds
Text lessonPreview
-
8.3 Multiple Bonds - Check yourself
6 questionsPreview
-
8.4 Molecular Orbital Theory
Text lessonPreview
-
8.4 Molecular Orbital Theory - Check yourself
6 questionsPreview
-
Unit 8 review quiz: Advanced Theories of Covalent Bonding
10 questionsPreview
Unit 9: Gases
0/23
-
Unit 9 overview: Gases
Text lessonPreview
-
9.1 Gas Pressure
Text lessonPreview
-
9.1 Gas Pressure - Check yourself
6 questionsPreview
-
9.2 Relating Pressure, Volume, Amount, and Temperature: The Ideal Gas Law
Text lessonPreview
-
9.2 Relating Pressure, Volume, Amount, and Temperature: The Ideal Gas Law - Check yourself
6 questionsPreview
-
9.3 Stoichiometry of Gaseous Substances, Mixtures, and Reactions
Text lessonPreview
-
9.3 Stoichiometry of Gaseous Substances, Mixtures, and Reactions - Check yourself
6 questionsPreview
-
9.3 Stoichiometry of Gaseous Substances, Mixtures, and Reactions
Text lessonPreview
-
9.3 Stoichiometry of Gaseous Substances, Mixtures, and Reactions - Check yourself
6 questionsPreview
-
9.4 Effusion and Diffusion of Gases
Text lessonPreview
-
9.4 Effusion and Diffusion of Gases - Check yourself
6 questionsPreview
-
9.4 Effusion and Diffusion of Gases
Text lessonPreview
-
9.4 Effusion and Diffusion of Gases - Check yourself
6 questionsPreview
-
Unit 9 review quiz: Gases
10 questionsPreview
-
9.5 The Kinetic-Molecular Theory
Text lessonPreview
-
9.5 The Kinetic-Molecular Theory - Check yourself
6 questionsPreview
-
9.5 The Kinetic-Molecular Theory
Text lessonPreview
-
9.5 The Kinetic-Molecular Theory - Check yourself
6 questionsPreview
-
9.6 Non-Ideal Gas Behavior
Text lessonPreview
-
9.6 Non-Ideal Gas Behavior - Check yourself
6 questionsPreview
-
9.6 Non-Ideal Gas Behavior
Text lessonPreview
-
9.6 Non-Ideal Gas Behavior - Check yourself
6 questionsPreview
-
Unit 9 review quiz: Gases
10 questionsPreview
Unit 10: Liquids and Solids
0/28
-
Unit 10 overview: Liquids and Solids
Text lessonPreview
-
10.1 Intermolecular Forces
Text lessonPreview
-
Unit 10 overview: Liquids and Solids
Text lessonPreview
-
10.1 Intermolecular Forces
Text lessonPreview
-
10.1 Intermolecular Forces - Check yourself
6 questionsPreview
-
10.1 Intermolecular Forces - Check yourself
6 questionsPreview
-
10.2 Properties of Liquids
Text lessonPreview
-
10.2 Properties of Liquids - Check yourself
6 questionsPreview
-
10.2 Properties of Liquids
Text lessonPreview
-
10.2 Properties of Liquids - Check yourself
6 questionsPreview
-
10.3 Phase Transitions
Text lessonPreview
-
10.3 Phase Transitions - Check yourself
6 questionsPreview
-
10.3 Phase Transitions
Text lessonPreview
-
10.3 Phase Transitions - Check yourself
6 questionsPreview
-
10.4 Phase Diagrams
Text lessonPreview
-
10.4 Phase Diagrams
Text lessonPreview
-
10.4 Phase Diagrams - Check yourself
6 questionsPreview
-
10.4 Phase Diagrams - Check yourself
6 questionsPreview
-
10.5 The Solid State of Matter
Text lessonPreview
-
10.5 The Solid State of Matter
Text lessonPreview
-
10.5 The Solid State of Matter - Check yourself
6 questionsPreview
-
10.5 The Solid State of Matter - Check yourself
6 questionsPreview
-
10.6 Lattice Structures in Crystalline Solids
Text lessonPreview
-
10.6 Lattice Structures in Crystalline Solids
Text lessonPreview
-
10.6 Lattice Structures in Crystalline Solids - Check yourself
6 questionsPreview
-
10.6 Lattice Structures in Crystalline Solids - Check yourself
6 questionsPreview
-
Unit 10 review quiz: Liquids and Solids
10 questionsPreview
-
Unit 10 review quiz: Liquids and Solids
10 questionsPreview
Unit 11: Solutions and Colloids
0/24
-
Unit 11 overview: Solutions and Colloids
Text lessonPreview
-
11.1 The Dissolution Process
Text lessonPreview
-
Unit 11 overview: Solutions and Colloids
Text lessonPreview
-
11.1 The Dissolution Process
Text lessonPreview
-
11.1 The Dissolution Process - Check yourself
6 questionsPreview
-
11.1 The Dissolution Process - Check yourself
6 questionsPreview
-
11.2 Electrolytes
Text lessonPreview
-
11.2 Electrolytes - Check yourself
6 questionsPreview
-
11.2 Electrolytes
Text lessonPreview
-
11.2 Electrolytes - Check yourself
6 questionsPreview
-
11.3 Solubility
Text lessonPreview
-
11.3 Solubility - Check yourself
6 questionsPreview
-
11.3 Solubility
Text lessonPreview
-
11.3 Solubility - Check yourself
6 questionsPreview
-
11.4 Colligative Properties
Text lessonPreview
-
11.4 Colligative Properties - Check yourself
6 questionsPreview
-
11.4 Colligative Properties
Text lessonPreview
-
11.4 Colligative Properties - Check yourself
6 questionsPreview
-
11.5 Colloids
Text lessonPreview
-
11.5 Colloids - Check yourself
6 questionsPreview
-
11.5 Colloids
Text lessonPreview
-
11.5 Colloids - Check yourself
6 questionsPreview
-
Unit 11 review quiz: Solutions and Colloids
10 questionsPreview
-
Unit 11 review quiz: Solutions and Colloids
10 questionsPreview
Unit 12: Kinetics
0/32
-
Unit 12 overview: Kinetics
Text lessonPreview
-
12.1 Chemical Reaction Rates
Text lessonPreview
-
12.1 Chemical Reaction Rates - Check yourself
6 questionsPreview
-
Unit 12 overview: Kinetics
Text lessonPreview
-
12.1 Chemical Reaction Rates
Text lessonPreview
-
12.1 Chemical Reaction Rates - Check yourself
6 questionsPreview
-
12.2 Factors Affecting Reaction Rates
Text lessonPreview
-
12.2 Factors Affecting Reaction Rates - Check yourself
6 questionsPreview
-
12.2 Factors Affecting Reaction Rates
Text lessonPreview
-
12.2 Factors Affecting Reaction Rates - Check yourself
6 questionsPreview
-
12.3 Rate Laws
Text lessonPreview
-
12.3 Rate Laws - Check yourself
6 questionsPreview
-
12.3 Rate Laws
Text lessonPreview
-
12.3 Rate Laws - Check yourself
6 questionsPreview
-
12.4 Integrated Rate Laws
Text lessonPreview
-
12.4 Integrated Rate Laws - Check yourself
6 questionsPreview
-
12.4 Integrated Rate Laws
Text lessonPreview
-
12.4 Integrated Rate Laws - Check yourself
6 questionsPreview
-
12.5 Collision Theory
Text lessonPreview
-
12.5 Collision Theory - Check yourself
6 questionsPreview
-
12.5 Collision Theory
Text lessonPreview
-
Unit 12 review quiz: Kinetics
10 questionsPreview
-
12.5 Collision Theory - Check yourself
6 questionsPreview
-
12.6 Reaction Mechanisms
Text lessonPreview
-
12.6 Reaction Mechanisms - Check yourself
6 questionsPreview
-
12.6 Reaction Mechanisms
Text lessonPreview
-
12.6 Reaction Mechanisms - Check yourself
6 questionsPreview
-
12.7 Catalysis
Text lessonPreview
-
12.7 Catalysis - Check yourself
6 questionsPreview
-
12.7 Catalysis
Text lessonPreview
-
12.7 Catalysis - Check yourself
6 questionsPreview
-
Unit 12 review quiz: Kinetics
10 questionsPreview
Unit 13: Fundamental Equilibrium Concepts
0/20
-
Unit 13 overview: Fundamental Equilibrium Concepts
Text lessonPreview
-
13.1 Chemical Equilibria
Text lessonPreview
-
13.1 Chemical Equilibria - Check yourself
6 questionsPreview
-
13.1 Chemical Equilibria
Text lessonPreview
-
13.1 Chemical Equilibria - Check yourself
6 questionsPreview
-
13.2 Equilibrium Constants
Text lessonPreview
-
13.2 Equilibrium Constants - Check yourself
6 questionsPreview
-
13.2 Equilibrium Constants
Text lessonPreview
-
Unit 13 overview: Fundamental Equilibrium Concepts
Text lessonPreview
-
13.2 Equilibrium Constants - Check yourself
6 questionsPreview
-
13.3 Shifting Equilibria: Le Châtelier’s Principle
Text lessonPreview
-
13.3 Shifting Equilibria: Le Châtelier’s Principle - Check yourself
6 questionsPreview
-
13.3 Shifting Equilibria: Le Châtelier’s Principle
Text lessonPreview
-
Unit 13 review quiz: Fundamental Equilibrium Concepts
10 questionsPreview
-
13.3 Shifting Equilibria: Le Châtelier’s Principle - Check yourself
6 questionsPreview
-
13.4 Equilibrium Calculations
Text lessonPreview
-
13.4 Equilibrium Calculations - Check yourself
6 questionsPreview
-
13.4 Equilibrium Calculations
Text lessonPreview
-
13.4 Equilibrium Calculations - Check yourself
6 questionsPreview
-
Unit 13 review quiz: Fundamental Equilibrium Concepts
10 questionsPreview
Unit 14: Acid-Base Equilibria
0/32
-
Unit 14 overview: Acid-Base Equilibria
Text lessonPreview
-
14.1 Brønsted-Lowry Acids and Bases
Text lessonPreview
-
14.1 Brønsted-Lowry Acids and Bases - Check yourself
6 questionsPreview
-
14.1 Brønsted-Lowry Acids and Bases
Text lessonPreview
-
14.1 Brønsted-Lowry Acids and Bases - Check yourself
6 questionsPreview
-
14.2 pH and pOH
Text lessonPreview
-
14.2 pH and pOH - Check yourself
6 questionsPreview
-
14.2 pH and pOH
Text lessonPreview
-
14.2 pH and pOH - Check yourself
6 questionsPreview
-
14.3 Relative Strengths of Acids and Bases
Text lessonPreview
-
14.3 Relative Strengths of Acids and Bases - Check yourself
6 questionsPreview
-
14.3 Relative Strengths of Acids and Bases
Text lessonPreview
-
14.3 Relative Strengths of Acids and Bases - Check yourself
6 questionsPreview
-
14.4 Hydrolysis of Salts
Text lessonPreview
-
14.4 Hydrolysis of Salts - Check yourself
6 questionsPreview
-
Unit 14 review quiz: Acid-Base Equilibria
10 questionsPreview
-
Unit 14 overview: Acid-Base Equilibria
Text lessonPreview
-
14.4 Hydrolysis of Salts
Text lessonPreview
-
14.4 Hydrolysis of Salts - Check yourself
6 questionsPreview
-
14.5 Polyprotic Acids
Text lessonPreview
-
14.5 Polyprotic Acids - Check yourself
6 questionsPreview
-
14.5 Polyprotic Acids
Text lessonPreview
-
14.5 Polyprotic Acids - Check yourself
6 questionsPreview
-
14.6 Buffers
Text lessonPreview
-
14.6 Buffers - Check yourself
6 questionsPreview
-
14.6 Buffers
Text lessonPreview
-
14.6 Buffers - Check yourself
6 questionsPreview
-
14.7 Acid-Base Titrations
Text lessonPreview
-
14.7 Acid-Base Titrations - Check yourself
6 questionsPreview
-
14.7 Acid-Base Titrations
Text lessonPreview
-
14.7 Acid-Base Titrations - Check yourself
6 questionsPreview
-
Unit 14 review quiz: Acid-Base Equilibria
10 questionsPreview
Unit 15: Equilibria of Other Reaction Classes
0/16
-
Unit 15 overview: Equilibria of Other Reaction Classes
Text lessonPreview
-
15.1 Precipitation and Dissolution
Text lessonPreview
-
15.1 Precipitation and Dissolution - Check yourself
6 questionsPreview
-
15.1 Precipitation and Dissolution
Text lessonPreview
-
15.1 Precipitation and Dissolution - Check yourself
6 questionsPreview
-
15.2 Lewis Acids and Bases
Text lessonPreview
-
15.2 Lewis Acids and Bases - Check yourself
6 questionsPreview
-
Unit 15 review quiz: Equilibria of Other Reaction Classes
10 questionsPreview
-
Unit 15 overview: Equilibria of Other Reaction Classes
Text lessonPreview
-
15.2 Lewis Acids and Bases
Text lessonPreview
-
15.2 Lewis Acids and Bases - Check yourself
6 questionsPreview
-
15.3 Coupled Equilibria
Text lessonPreview
-
15.3 Coupled Equilibria - Check yourself
6 questionsPreview
-
15.3 Coupled Equilibria
Text lessonPreview
-
15.3 Coupled Equilibria - Check yourself
6 questionsPreview
-
Unit 15 review quiz: Equilibria of Other Reaction Classes
10 questionsPreview
Unit 16: Thermodynamics
0/20
-
Unit 16 overview: Thermodynamics
Text lessonPreview
-
16.1 Spontaneity
Text lessonPreview
-
16.1 Spontaneity - Check yourself
6 questionsPreview
-
16.1 Spontaneity
Text lessonPreview
-
16.1 Spontaneity - Check yourself
6 questionsPreview
-
16.2 Entropy
Text lessonPreview
-
16.2 Entropy - Check yourself
6 questionsPreview
-
16.2 Entropy
Text lessonPreview
-
16.2 Entropy - Check yourself
6 questionsPreview
-
Unit 16 review quiz: Thermodynamics
10 questionsPreview
-
Unit 16 overview: Thermodynamics
Text lessonPreview
-
16.3 The Second and Third Laws of Thermodynamics
Text lessonPreview
-
16.3 The Second and Third Laws of Thermodynamics - Check yourself
6 questionsPreview
-
16.3 The Second and Third Laws of Thermodynamics
Text lessonPreview
-
16.3 The Second and Third Laws of Thermodynamics - Check yourself
6 questionsPreview
-
16.4 Free Energy
Text lessonPreview
-
16.4 Free Energy - Check yourself
6 questionsPreview
-
16.4 Free Energy
Text lessonPreview
-
16.4 Free Energy - Check yourself
6 questionsPreview
-
Unit 16 review quiz: Thermodynamics
10 questionsPreview
Unit 17: Electrochemistry
0/32
-
Unit 17 overview: Electrochemistry
Text lessonPreview
-
17.1 Review of Redox Chemistry
Text lessonPreview
-
17.1 Review of Redox Chemistry - Check yourself
6 questionsPreview
-
17.1 Review of Redox Chemistry
Text lessonPreview
-
17.1 Review of Redox Chemistry - Check yourself
6 questionsPreview
-
17.2 Galvanic Cells
Text lessonPreview
-
17.2 Galvanic Cells - Check yourself
6 questionsPreview
-
17.2 Galvanic Cells
Text lessonPreview
-
17.2 Galvanic Cells - Check yourself
6 questionsPreview
-
17.3 Electrode and Cell Potentials
Text lessonPreview
-
17.3 Electrode and Cell Potentials - Check yourself
6 questionsPreview
-
17.3 Electrode and Cell Potentials
Text lessonPreview
-
17.3 Electrode and Cell Potentials - Check yourself
6 questionsPreview
-
17.4 Potential, Free Energy, and Equilibrium
Text lessonPreview
-
17.4 Potential, Free Energy, and Equilibrium - Check yourself
6 questionsPreview
-
Unit 17 review quiz: Electrochemistry
10 questionsPreview
-
Unit 17 overview: Electrochemistry
Text lessonPreview
-
17.4 Potential, Free Energy, and Equilibrium
Text lessonPreview
-
17.4 Potential, Free Energy, and Equilibrium - Check yourself
6 questionsPreview
-
17.5 Batteries and Fuel Cells
Text lessonPreview
-
17.5 Batteries and Fuel Cells - Check yourself
6 questionsPreview
-
17.5 Batteries and Fuel Cells
Text lessonPreview
-
17.5 Batteries and Fuel Cells - Check yourself
6 questionsPreview
-
17.6 Corrosion
Text lessonPreview
-
17.6 Corrosion - Check yourself
6 questionsPreview
-
17.6 Corrosion
Text lessonPreview
-
17.6 Corrosion - Check yourself
6 questionsPreview
-
17.7 Electrolysis
Text lessonPreview
-
17.7 Electrolysis - Check yourself
6 questionsPreview
-
17.7 Electrolysis
Text lessonPreview
-
17.7 Electrolysis - Check yourself
6 questionsPreview
-
Unit 17 review quiz: Electrochemistry
10 questionsPreview
Unit 18: Representative Metals, Metalloids, and Nonmetals
0/52
-
Unit 18 overview: Representative Metals, Metalloids, and Nonmetals
Text lessonPreview
-
18.1 Periodicity
Text lessonPreview
-
18.1 Periodicity - Check yourself
6 questionsPreview
-
18.1 Periodicity
Text lessonPreview
-
18.1 Periodicity - Check yourself
6 questionsPreview
-
18.2 Occurrence and Preparation of the Representative Metals
Text lessonPreview
-
18.2 Occurrence and Preparation of the Representative Metals - Check yourself
6 questionsPreview
-
18.2 Occurrence and Preparation of the Representative Metals
Text lessonPreview
-
18.2 Occurrence and Preparation of the Representative Metals - Check yourself
6 questionsPreview
-
18.3 Structure and General Properties of the Metalloids
Text lessonPreview
-
18.3 Structure and General Properties of the Metalloids - Check yourself
6 questionsPreview
-
18.3 Structure and General Properties of the Metalloids
Text lessonPreview
-
18.3 Structure and General Properties of the Metalloids - Check yourself
6 questionsPreview
-
18.4 Structure and General Properties of the Nonmetals
Text lessonPreview
-
18.4 Structure and General Properties of the Nonmetals - Check yourself
6 questionsPreview
-
18.4 Structure and General Properties of the Nonmetals
Text lessonPreview
-
18.4 Structure and General Properties of the Nonmetals - Check yourself
6 questionsPreview
-
18.5 Occurrence, Preparation, and Compounds of Hydrogen
Text lessonPreview
-
18.5 Occurrence, Preparation, and Compounds of Hydrogen - Check yourself
6 questionsPreview
-
18.5 Occurrence, Preparation, and Compounds of Hydrogen
Text lessonPreview
-
18.5 Occurrence, Preparation, and Compounds of Hydrogen - Check yourself
6 questionsPreview
-
18.6 Occurrence, Preparation, and Properties of Carbonates
Text lessonPreview
-
18.6 Occurrence, Preparation, and Properties of Carbonates - Check yourself
6 questionsPreview
-
18.6 Occurrence, Preparation, and Properties of Carbonates
Text lessonPreview
-
18.6 Occurrence, Preparation, and Properties of Carbonates - Check yourself
6 questionsPreview
-
Unit 18 review quiz: Representative Metals, Metalloids, and Nonmetals
10 questionsPreview
-
Unit 18 overview: Representative Metals, Metalloids, and Nonmetals
Text lessonPreview
-
18.7 Occurrence, Preparation, and Properties of Nitrogen
Text lessonPreview
-
18.7 Occurrence, Preparation, and Properties of Nitrogen - Check yourself
6 questionsPreview
-
18.7 Occurrence, Preparation, and Properties of Nitrogen
Text lessonPreview
-
18.7 Occurrence, Preparation, and Properties of Nitrogen - Check yourself
6 questionsPreview
-
18.8 Occurrence, Preparation, and Properties of Phosphorus
Text lessonPreview
-
18.8 Occurrence, Preparation, and Properties of Phosphorus - Check yourself
6 questionsPreview
-
18.8 Occurrence, Preparation, and Properties of Phosphorus
Text lessonPreview
-
18.8 Occurrence, Preparation, and Properties of Phosphorus - Check yourself
6 questionsPreview
-
18.9 Occurrence, Preparation, and Compounds of Oxygen
Text lessonPreview
-
18.9 Occurrence, Preparation, and Compounds of Oxygen - Check yourself
6 questionsPreview
-
18.9 Occurrence, Preparation, and Compounds of Oxygen
Text lessonPreview
-
18.9 Occurrence, Preparation, and Compounds of Oxygen - Check yourself
6 questionsPreview
-
18.10 Occurrence, Preparation, and Properties of Sulfur
Text lessonPreview
-
18.10 Occurrence, Preparation, and Properties of Sulfur - Check yourself
6 questionsPreview
-
18.10 Occurrence, Preparation, and Properties of Sulfur
Text lessonPreview
-
18.10 Occurrence, Preparation, and Properties of Sulfur - Check yourself
6 questionsPreview
-
18.11 Occurrence, Preparation, and Properties of Halogens
Text lessonPreview
-
18.11 Occurrence, Preparation, and Properties of Halogens - Check yourself
6 questionsPreview
-
18.11 Occurrence, Preparation, and Properties of Halogens
Text lessonPreview
-
18.11 Occurrence, Preparation, and Properties of Halogens - Check yourself
6 questionsPreview
-
18.12 Occurrence, Preparation, and Properties of the Noble Gases
Text lessonPreview
-
18.12 Occurrence, Preparation, and Properties of the Noble Gases - Check yourself
6 questionsPreview
-
18.12 Occurrence, Preparation, and Properties of the Noble Gases
Text lessonPreview
-
18.12 Occurrence, Preparation, and Properties of the Noble Gases - Check yourself
6 questionsPreview
-
Unit 18 review quiz: Representative Metals, Metalloids, and Nonmetals
10 questionsPreview
Unit 19: Transition Metals and Coordination Chemistry
0/16
-
Unit 19 overview: Transition Metals and Coordination Chemistry
Text lessonPreview
-
19.1 Occurrence, Preparation, and Properties of Transition Metals and Their Compounds
Text lessonPreview
-
19.1 Occurrence, Preparation, and Properties of Transition Metals and Their Compounds - Check yourself
6 questionsPreview
-
19.1 Occurrence, Preparation, and Properties of Transition Metals and Their Compounds
Text lessonPreview
-
19.1 Occurrence, Preparation, and Properties of Transition Metals and Their Compounds - Check yourself
6 questionsPreview
-
19.2 Coordination Chemistry of Transition Metals
Text lessonPreview
-
19.2 Coordination Chemistry of Transition Metals - Check yourself
6 questionsPreview
-
Unit 19 review quiz: Transition Metals and Coordination Chemistry
10 questionsPreview
-
Unit 19 overview: Transition Metals and Coordination Chemistry
Text lessonPreview
-
19.2 Coordination Chemistry of Transition Metals
Text lessonPreview
-
19.2 Coordination Chemistry of Transition Metals - Check yourself
6 questionsPreview
-
19.3 Spectroscopic and Magnetic Properties of Coordination Compounds
Text lessonPreview
-
19.3 Spectroscopic and Magnetic Properties of Coordination Compounds - Check yourself
6 questionsPreview
-
19.3 Spectroscopic and Magnetic Properties of Coordination Compounds
Text lessonPreview
-
19.3 Spectroscopic and Magnetic Properties of Coordination Compounds - Check yourself
6 questionsPreview
-
Unit 19 review quiz: Transition Metals and Coordination Chemistry
10 questionsPreview
Unit 20: Organic Chemistry
0/20
-
Unit 20 overview: Organic Chemistry
Text lessonPreview
-
20.1 Hydrocarbons
Text lessonPreview
-
20.1 Hydrocarbons - Check yourself
6 questionsPreview
-
20.1 Hydrocarbons
Text lessonPreview
-
20.1 Hydrocarbons - Check yourself
6 questionsPreview
-
20.2 Alcohols and Ethers
Text lessonPreview
-
20.2 Alcohols and Ethers - Check yourself
6 questionsPreview
-
20.2 Alcohols and Ethers
Text lessonPreview
-
20.2 Alcohols and Ethers - Check yourself
6 questionsPreview
-
Unit 20 review quiz: Organic Chemistry
10 questionsPreview
-
Unit 20 overview: Organic Chemistry
Text lessonPreview
-
20.3 Aldehydes, Ketones, Carboxylic Acids, and Esters
Text lessonPreview
-
20.3 Aldehydes, Ketones, Carboxylic Acids, and Esters - Check yourself
6 questionsPreview
-
20.3 Aldehydes, Ketones, Carboxylic Acids, and Esters
Text lessonPreview
-
20.3 Aldehydes, Ketones, Carboxylic Acids, and Esters - Check yourself
6 questionsPreview
-
20.4 Amines and Amides
Text lessonPreview
-
20.4 Amines and Amides - Check yourself
6 questionsPreview
-
20.4 Amines and Amides
Text lessonPreview
-
20.4 Amines and Amides - Check yourself
6 questionsPreview
-
Unit 20 review quiz: Organic Chemistry
10 questionsPreview
Unit 21: Nuclear Chemistry
0/28
-
Unit 21 overview: Nuclear Chemistry
Text lessonPreview
-
21.1 Nuclear Structure and Stability
Text lessonPreview
-
21.1 Nuclear Structure and Stability - Check yourself
6 questionsPreview
-
21.1 Nuclear Structure and Stability
Text lessonPreview
-
21.1 Nuclear Structure and Stability - Check yourself
6 questionsPreview
-
21.2 Nuclear Equations
Text lessonPreview
-
21.2 Nuclear Equations - Check yourself
6 questionsPreview
-
21.2 Nuclear Equations
Text lessonPreview
-
21.2 Nuclear Equations - Check yourself
6 questionsPreview
-
21.3 Radioactive Decay
Text lessonPreview
-
21.3 Radioactive Decay - Check yourself
6 questionsPreview
-
21.3 Radioactive Decay
Text lessonPreview
-
21.3 Radioactive Decay - Check yourself
6 questionsPreview
-
Unit 21 review quiz: Nuclear Chemistry
10 questionsPreview
-
Unit 21 overview: Nuclear Chemistry
Text lessonPreview
-
21.4 Transmutation and Nuclear Energy
Text lessonPreview
-
21.4 Transmutation and Nuclear Energy - Check yourself
6 questionsPreview
-
21.4 Transmutation and Nuclear Energy
Text lessonPreview
-
21.4 Transmutation and Nuclear Energy - Check yourself
6 questionsPreview
-
21.5 Uses of Radioisotopes
Text lessonPreview
-
21.5 Uses of Radioisotopes - Check yourself
6 questionsPreview
-
21.5 Uses of Radioisotopes
Text lessonPreview
-
21.5 Uses of Radioisotopes - Check yourself
6 questionsPreview
-
21.6 Biological Effects of Radiation
Text lessonPreview
-
21.6 Biological Effects of Radiation - Check yourself
6 questionsPreview
-
21.6 Biological Effects of Radiation
Text lessonPreview
-
21.6 Biological Effects of Radiation - Check yourself
6 questionsPreview
-
Unit 21 review quiz: Nuclear Chemistry
10 questionsPreview
Text lesson
10.4 Phase Diagrams
10.4 Phase Diagrams — CHEMISTRY notes: You will be able to construct and read a phase diagram, use it to find the state of a substance at a given pressure and temperature, describe the phase changes that occur as conditions change, and explain what a supercritical fluid is.
1Phase diagrams explained2Phase diagrams explained
Phase diagrams explained
Phase diagrams explained
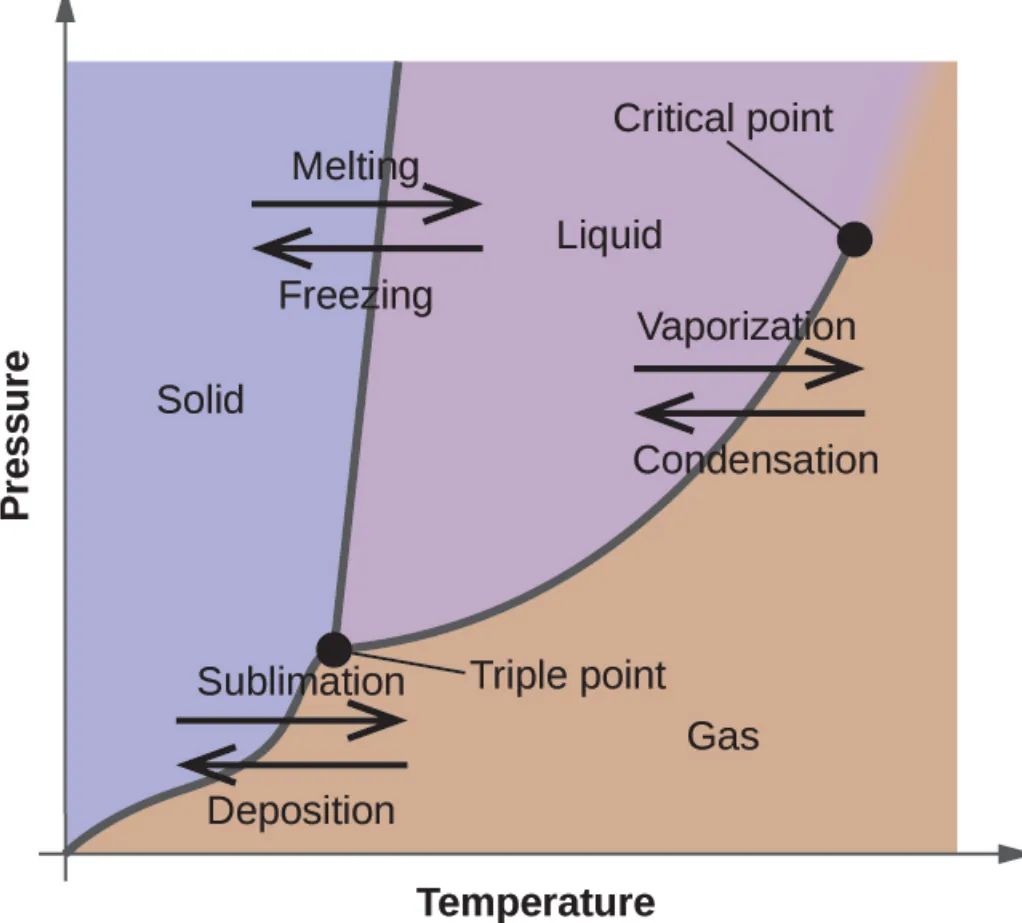
The vapor pressure of a liquid changes with temperature, and the boiling point of a liquid changes with pressure. Heating and cooling curves tell us the melting or freezing point of a substance. If we make these measurements over a wide range of pressures, we get data that can be shown on one graph called a phase diagram.
A phase diagram for a pure substance combines three curves of pressure against temperature: the liquid-gas equilibrium, the solid-liquid equilibrium and the solid-gas equilibrium.
Each curve marks the conditions at which two phases coexist.
Together the curves divide the graph into regions where only one phase is stable.
The diagram therefore tells us which physical state exists under any given pressure and temperature,
and how the phase-transition temperatures depend on pressure.(melting points, sublimation points and boiling points)
1 / 2Next ▶
A general phase diagram for a pure substance, showing the solid, liquid and gas regions separated by the three equilibrium curves. Image: OpenStax, Chemistry 2e, CC BY 4.0.
Phase diagrams explained
◀ Previous2 / 2
1Reading the phase diagram of water2Reading the phase diagram of water
The phase diagram of water, with axes not drawn to a constant scale, showing the solid, liquid and gas regions and the points that mark the triple point and the end of the liquid-vapor curve. Image: OpenStax, Chemistry 2e, CC BY 4.0.
Reading the phase diagram of water
 ⤢ Enlarge
Reading the phase diagram of water
To understand how useful these graphs are, consider the phase diagram for water. The diagram below has its pressure and temperature axes drawn to different scales on purpose
so that several important features can be seen clearly.
We can identify the physical state of water at any specified conditions by finding the matching region of the diagram.
At a pressure of 50 kPa and a temperature of −10 °C, the point lies in the ice region
so water is entirely solid.
At 50 kPa and 50 °C, the point lies in the water region
so water is entirely liquid.
At 25 kPa and 200 °C, the point lies in the gas region
so water is entirely gaseous.
The curve that runs from the triple point upward is the liquid-vapor curve.
1 / 2Next ▶
Reading the phase diagram of water
Reading the phase diagram of water
It is the same vapor pressure curve described for liquids and it separates the liquid and gas regions.
Every point on this curve gives the boiling point of water at that pressure.
For example, at 1 atm the boiling point is 100 °C.
The liquid-vapor curve ends at 374 °C and 218 atm.
Above this temperature water cannot exist as a liquid, however much pressure is applied.
The properties of water in this region are between those of a liquid and a gas, and this state is called a supercritical fluid.
◀ Previous2 / 2
1Solid-vapor curve, solid-liquid curve and the triple point2Solid-vapor curve, solid-liquid curve and the triple point3Solid-vapor curve, solid-liquid curve and the triple point
Solid-vapor curve, solid-liquid curve and the triple point
1
The solid-vapor curve shows the temperatures and pressures at which ice and water vapor are in equilibrium.
2
These pairs of values are the sublimation points (or deposition points) of water.
3
Ice has a vapor pressure of about 0.20 kPa at −10 °C.
4
If a frozen sample is placed in a vacuum with pressure below 0.20 kPa, the ice will sublime directly to vapor.
5
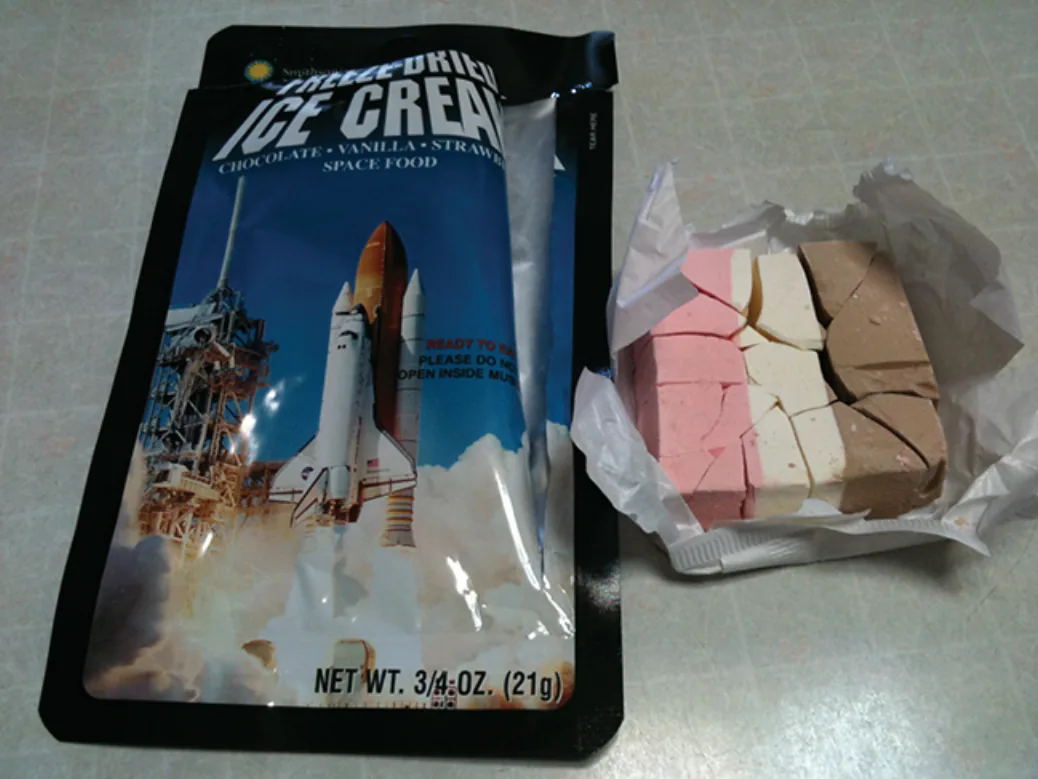
This is the principle of freeze-drying
which removes water from foods such as ice cream while keeping them solid during the process.
1 / 3Next ▶
Freeze-dried ice cream, which has been dehydrated by sublimation of its ice at pressures below the triple point of water. Image: OpenStax, Chemistry 2e, CC BY 4.0.
Solid-vapor curve, solid-liquid curve and the triple point
 ⤢ Enlarge
1
The solid-liquid curve shows the temperatures and pressures at which ice and liquid water are in equilibrium.
2
It is the melting and freezing curve of water.
3
This curve has a slightly negative slope
which means that the melting point of water falls a little as pressure rises.
4
Most substances behave the opposite way, with melting points that rise as pressure rises.
5
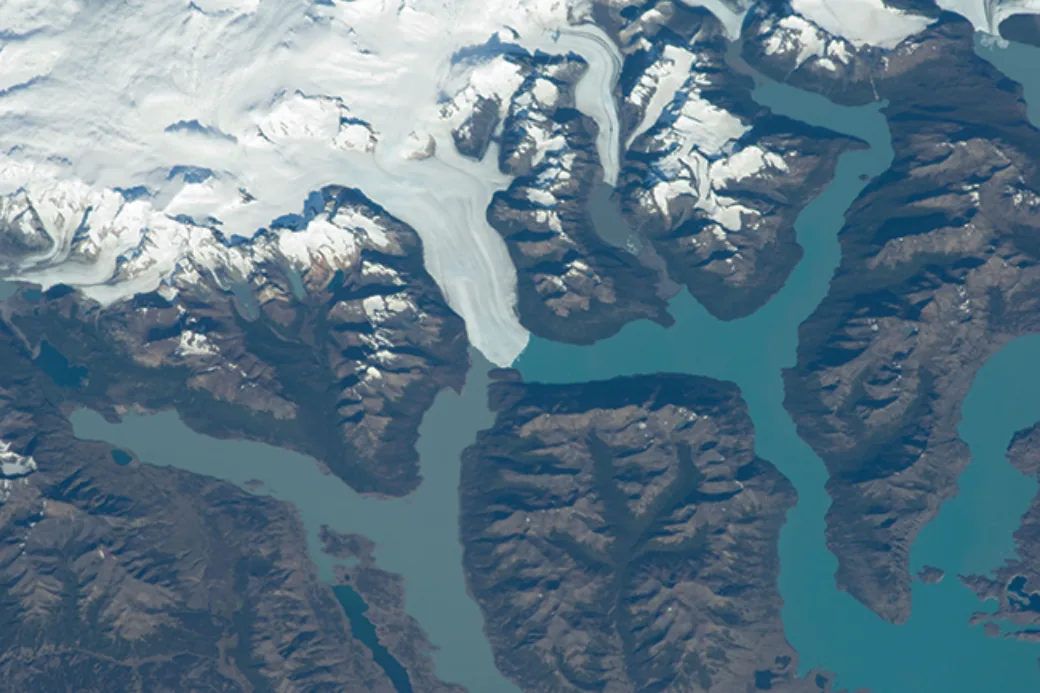
Because of this unusual property of water, the very large pressure at the base of a glacier can melt some of the ice.
6
The thin layer of liquid water formed in this way lets the glacier slide more easily.
◀ Previous2 / 3Next ▶
A satellite photograph of the advancing edge of a glacier, where the weight of the ice partly melts its base and forms a slippery layer of water. Image: OpenStax, Chemistry 2e, CC BY 4.0.
Solid-vapor curve, solid-liquid curve and the triple point
 ⤢ Enlarge
Solid-vapor curve, solid-liquid curve and the triple point
The three curves meet at one point called the triple point.
At the pressure and temperature of this point, solid, liquid and gas coexist in equilibrium.
At pressures below the triple point pressure, water cannot exist as a liquid at any temperature.
For water, the triple point is at a very low pressure
so liquid water is only found above it.
◀ Previous3 / 3
1Phase diagram of carbon dioxide2Phase diagram of carbon dioxide
Phase diagram of carbon dioxide
1
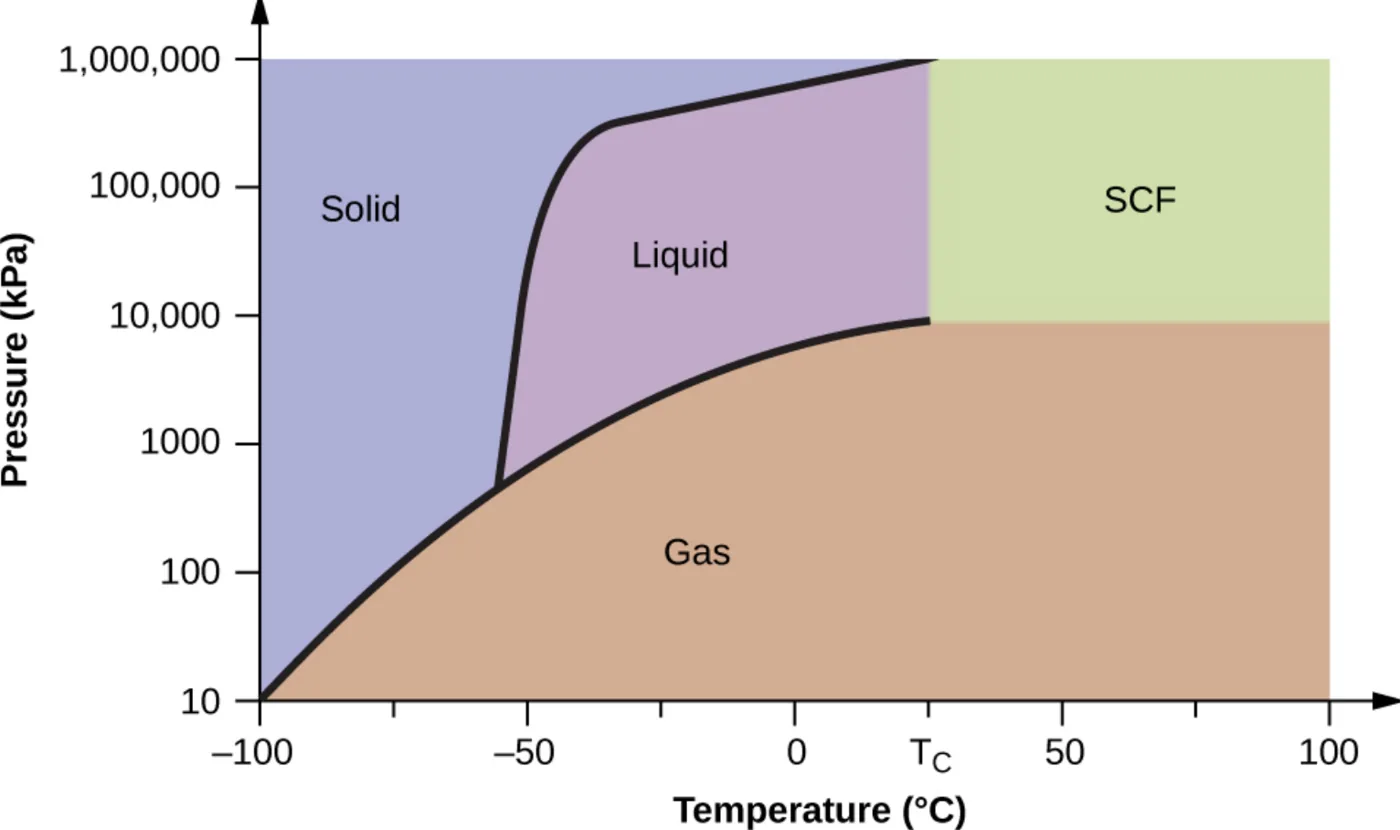
Carbon dioxide gives a different picture.
2
Its solid-liquid curve has a positive slope
so the melting point of CO2 rises with pressure, as it does for most substances.
3
Its triple point lies well above 1 atm.
4
This means that CO2 cannot exist as a liquid under normal atmospheric pressure.
5
When gaseous CO2 is cooled at 1 atm it turns directly into a solid
which is called deposition.
6
When solid CO2 is warmed at 1 atm it does not melt but sublimes to a gas.
1 / 2Next ▶
The phase diagram of carbon dioxide, drawn with a logarithmic pressure axis, showing that its triple point is above atmospheric pressure. Image: OpenStax, Chemistry 2e, CC BY 4.0.
Phase diagram of carbon dioxide
 ⤢ Enlarge
Phase diagram of carbon dioxide
Its critical point is also reached at a fairly modest temperature and pressure compared with water.
The pressure axis of this diagram is logarithmic because the pressure range is very large.
◀ Previous2 / 2
1Supercritical fluids2Supercritical fluids3Supercritical fluids
Supercritical fluids
Supercritical fluids
Consider a sample of water in a sealed container at 25 °C from which air has been removed.
When the liquid and its vapor reach equilibrium, the pressure is about 0.03 atm and a clear boundary separates the dense liquid below from the lighter gas above.
If we raise the temperature, the vapor pressure rises along the liquid-vapor curve and both phases remain.
At 374 °C the vapor pressure reaches 218 atm.
Any further rise in temperature makes the boundary disappear, and all the water becomes a single phase.
This phase is a supercritical fluid.
1 / 3Next ▶
Supercritical fluids
1
The temperature and pressure at which the boundary vanishes form the critical point.
2
The temperature above which a gas cannot be liquefied, however much pressure is applied, is the critical temperature.
3
The minimum pressure needed to liquefy a gas at its critical temperature is the critical pressure.
4
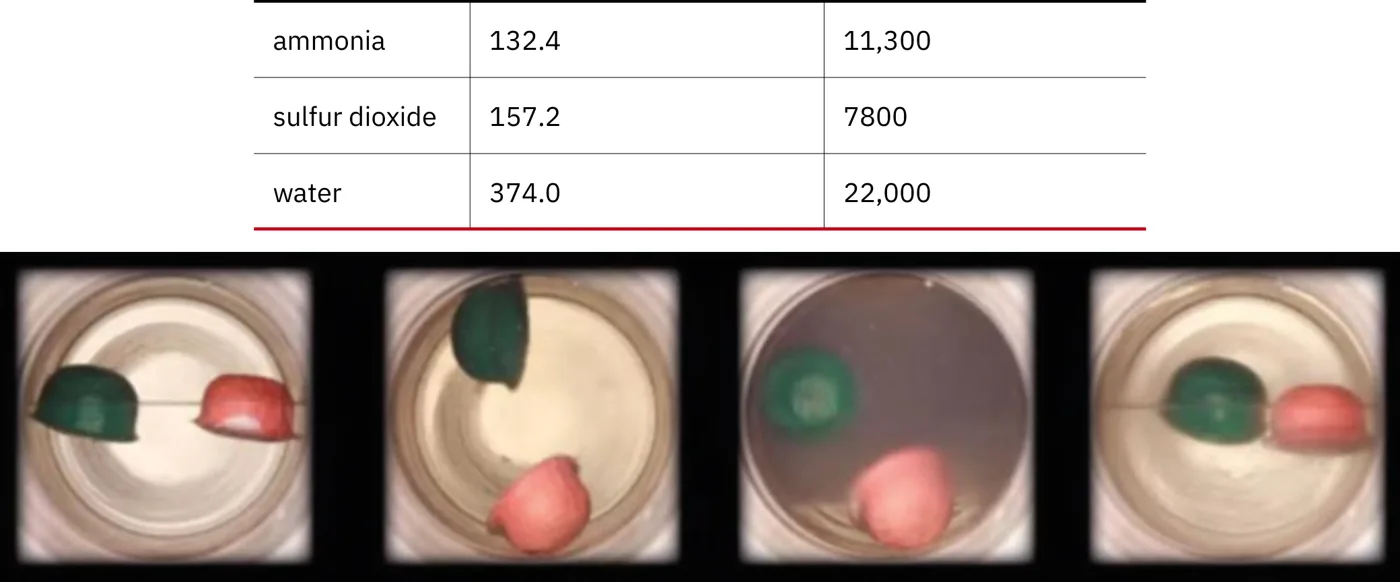
The critical values differ greatly between substances. Carbon dioxide has a critical temperature of 31.1 °C
while oxygen has one of −118.9 °Cso oxygen can only be liquefied at much lower temperatures. The table lists the critical values of some common substances.
5
A supercritical fluid fills its container like a gas
but its density is close to that of a liquid.
6
Like a liquid, it can dissolve non-volatile solutes.
| Substance | Critical temperature (°C) | Critical pressure (kPa) |
|---|---|---|
| Hydrogen | −240.0 | 1300 |
| Nitrogen | −147.2 | 3400 |
| Oxygen | −118.9 | 5000 |
| Carbon dioxide | 31.1 | 7400 |
| Ammonia | 132.4 | 11300 |
| Sulfur dioxide | 157.2 | 7800 |
| Water | 374.0 | 22000 |
◀ Previous2 / 3Next ▶
A sealed carbon dioxide container heated through its critical point to form a supercritical fluid, and then cooled so that liquid and gas separate again; colored floats show the density differences between the three states. Image: OpenStax, Chemistry 2e, CC BY 4.0.
Supercritical fluids
 ⤢ Enlarge
1
It has almost no surface tension and a very low viscosity
so it can pass into very small openings in a solid mixture and remove the soluble parts.
2
These properties make supercritical fluids useful solvents in many applications.
◀ Previous3 / 3
Observing the supercritical transition
Observing the supercritical transition
A short demonstration shows carbon dioxide passing from a liquid to a supercritical fluid as it is heated in a sealed tube, with the meniscus between the two phases disappearing at the critical point. Watching this change makes the idea of a critical point much easier to picture.
1Chemistry in everyday life: decaffeinating coffee with super2Chemistry in everyday life: decaffeinating coffee with super
Chemistry in everyday life: decaffeinating coffee with supercritical CO2
1
Many people drink decaffeinated coffee in the evening so that caffeine does not keep them awake.
2
Caffeine is moderately polar
so it dissolves well in water.
3
Hot water methods also dissolve many of the other 400-plus compounds that give coffee its taste and aroma
which spoils the flavor.
4
The solvents dichloromethane (CH2Cl2) and ethyl acetate (CH3CO2C2H5) have a polarity similar to caffeine and extract it well,
but they also remove flavor compounds, need long extraction times and are toxic,so traces may remain in the coffee.
5
Supercritical fluid extraction with carbon dioxide avoids most of these problems.
6
Above 304.2 K and 7376 kPa, CO2 is a supercritical fluid.
1 / 2Next ▶
Chemistry in everyday life: decaffeinating coffee with supercritical CO2
Chemistry in everyday life: decaffeinating coffee with supercritical CO2
Like a gas it penetrates deep into the coffee beans, and like a liquid it dissolves caffeine.
Extraction of steamed beans with supercritical CO2 removes 97–99% of the caffeine and leaves the flavor and aroma compounds intact.
Since CO2 is a gas at standard conditions, it is easily removed from the beans by lowering the pressure,
and the caffeine can be recovered from the extract and used as an additive in other foods or drugs.
CO2 is nontoxic, relatively cheap and not a pollutant.
◀ Previous2 / 2
1Example 10.11: Determining the state of water2Example 10.11: Determining the state of water3Example 10.12: Determining the state of carbon dioxide4Example 10.12: Determining the state of carbon dioxide5Example 10.13: The critical temperature of carbon dioxide
Example 10.11: Determining the state of water
Example 10.11: Determining the state of water
Use the phase diagram for water to find the state at each condition.
(a) −10 °C and 50 kPa: the point lies in the ice region
so water is a solid.
(b) 25 °C and 90 kPa: the point lies in the water region
so water is a liquid.
(c) 50 °C and 40 kPa: the point lies in the water region
so water is a liquid.
(d) 80 °C and 5 kPa: the point lies in the gas region
so water is a gas.
(e) −10 °C and 0.3 kPa: the pressure is above the 0.20 kPa vapor pressure of ice
so water is a solid.
1 / 5Next ▶
Example 10.11: Determining the state of water
1
(f) 50 °C and 0.3 kPa: the point lies in the gas region
so water is a gas.
2
Check Your Learning: Which phase changes does water undergo as temperature rises at constant pressure of 0.3 kPa, and at 50 kPa?
3
Answer: At 0.3 kPa, the pressure is below the triple point
so ice sublimes directly to vapor at about −58 °C. At 50 kPa, ice melts to liquid at 0 °C and the liquid boils at about 80 °C.
◀ Previous2 / 5Next ▶
Example 10.12: Determining the state of carbon dioxide
1
Use the phase diagram for carbon dioxide to find the state at each condition.
2
(a) −30 °C and 2000 kPa: liquid.
3
(b) −90 °C and 1000 kPa: solid.
4
(c) −60 °C and 100 kPa: gas.
5
(d) −40 °C and 1500 kPa: liquid.
6
(e) 0 °C and 100 kPa: gas.
◀ Previous3 / 5Next ▶
Example 10.12: Determining the state of carbon dioxide
Example 10.12: Determining the state of carbon dioxide
(f) 20 °C and 100 kPa: gas.
Check Your Learning: Which phase changes does CO2 undergo as its temperature rises from −100 °C at constant pressure of 1500 kPa, and at 50 kPa? At what approximate temperatures do they occur?
Answer: At 1500 kPa, CO2 melts from solid to liquid at about −55 °C and then boils from liquid to gas at about −10 °C. At 50 kPa, CO2 sublimes from solid to gas at about −60 °C.
◀ Previous4 / 5Next ▶
Example 10.13: The critical temperature of carbon dioxide
1
A CO2 fire extinguisher sloshes with liquid on a cool day at 18 °C
but on a hot day at 35 °C it appears to hold no liquid. Explain why.
2
Convert the temperatures to kelvin with T(K) = t(°C) + 273.15. The critical temperature of CO2 is 304 K (31 °C).
3
On the cool day, 18 °C is 291 K
which is below 304 Kso liquid CO2 exists in the cylinder.
4
On the hot day, 35 °C is 308 K
which is above 304 Kso no amount of pressure can liquefy the gas and no liquid is present.
5
Check Your Learning: Ammonia can be liquefied by compression at room temperature
but oxygen cannot. Why?
6
Answer: The critical temperature of ammonia is 132.4 °C (405.5 K)
which is above room temperature. The critical temperature of oxygen is −118.9 °C (154.3 K)which is below room temperatureso oxygen cannot be liquefied at room temperature.
◀ Previous5 / 5
Key terms
| Term | Meaning |
|---|---|
| Phase diagram | A graph of pressure against temperature that shows which physical state a substance has under each condition and how its phase-transition temperatures change with pressure. |
| Liquid-vapor curve | The curve on a phase diagram where liquid and gas coexist in equilibrium; it gives the boiling point at each pressure. |
| Solid-liquid curve | The curve on a phase diagram where ice and liquid coexist; it gives the melting point at each pressure. |
| Solid-vapor curve | The curve on a phase diagram where solid and gas coexist; it gives the sublimation or deposition temperature at each pressure. |
| Sublimation | The direct change of a solid into a gas without passing through the liquid state. |
| Deposition | The direct change of a gas into a solid without passing through the liquid state. |
| Freeze-drying | A preservation method in which frozen material is placed at a pressure below the vapor pressure of its ice, so that the ice sublimes and the material dries. |
| Triple point | The unique pressure and temperature at which solid, liquid and gas coexist in equilibrium. |
| Critical point | The temperature and pressure above which the liquid and gas phases become one phase. |
| Supercritical fluid | A phase of matter above the critical temperature and critical pressure, with properties between those of a liquid and a gas. |
| Critical temperature | The temperature above which a gas cannot be liquefied by any amount of pressure. |
| Critical pressure | The pressure needed to liquefy a gas at its critical temperature. |
1Avoid these mistakes2Avoid these mistakes3Avoid these mistakes4Avoid these mistakes
Avoid these mistakes
1Avoid this
Reading the water diagram as if its axes were drawn to the same scale.Avoid this
The axes are deliberately unequal, so distances on the graph do not show true size of change.Avoid this
2Avoid this
Assuming that water always melts at a higher temperature when pressure increases.Avoid this
Water’s solid-liquid curve slopes slightly negative, so its melting point falls as pressure rises.Avoid this
1 / 4Next ▶
Avoid these mistakes
3Avoid this
Thinking that carbon dioxide melts at 1 atm. Its triple point is above 1 atm, so solid COAvoid this
sublimes at atmospheric pressure.Avoid this
4Avoid this
Believing that a gas can be liquefied at any temperature by adding pressure.Avoid this
A gas above its critical temperature cannot be liquefied, however large the pressure.Avoid this
◀ Previous2 / 4Next ▶
Avoid these mistakes
5Avoid this
Confusing the critical point with the triple point.Avoid this
The critical point is where liquid and gas become one phase; the triple point is where solid, liquid and gas coexist.Avoid this
6Avoid this
Forgetting to convert Celsius to kelvin (T(K) = t(°C) + 273.15) when comparing a temperature with a critical temperature given in kelvin.Avoid this
7Avoid this
◀ Previous3 / 4Next ▶
Avoid these mistakes
Assuming that a supercritical fluid is simply a dense gas.Avoid this
It fills its container like a gas but has a density close to a liquid and dissolves nonvolatile solutes.Avoid this
◀ Previous4 / 4