Curriculum
Chemistry 2e
Unit 1: Essential Ideas
0/14
Unit 2: Atoms, Molecules, and Ions
0/16
Unit 3: Composition of Substances and Solutions
0/10
Unit 4: Stoichiometry of Chemical Reactions
0/12
Unit 5: Thermochemistry
0/8
Unit 6: Electronic Structure and Periodic Properties of Elements
0/12
-
Unit 6 overview: Electronic Structure and Periodic Properties of Elements
 Preview
-
6.1 Electromagnetic Energy
Preview
-
6.1 Electromagnetic Energy - Check yourself
 Preview
-
6.2 The Bohr Model
Preview
-
6.2 The Bohr Model - Check yourself
Preview
-
6.3 Development of Quantum Theory
Preview
-
6.3 Development of Quantum Theory - Check yourself
Preview
-
6.4 Electronic Structure of Atoms (Electron Configurations)
Preview
-
6.4 Electronic Structure of Atoms (Electron Configurations) - Check yourself
Preview
-
6.5 Periodic Variations in Element Properties
Preview
-
6.5 Periodic Variations in Element Properties - Check yourself
Preview
-
Unit 6 review quiz: Electronic Structure and Periodic Properties of Elements
Preview
Unit 7: Chemical Bonding and Molecular Geometry
0/14
Unit 8: Advanced Theories of Covalent Bonding
0/10
Unit 9: Gases
0/23
Unit 10: Liquids and Solids
0/28
Unit 11: Solutions and Colloids
0/24
Unit 12: Kinetics
0/32
Unit 13: Fundamental Equilibrium Concepts
0/20
Unit 14: Acid-Base Equilibria
0/32
Unit 15: Equilibria of Other Reaction Classes
0/16
Unit 16: Thermodynamics
0/20
Unit 17: Electrochemistry
0/32
Unit 18: Representative Metals, Metalloids, and Nonmetals
0/52
Unit 19: Transition Metals and Coordination Chemistry
0/16
Unit 20: Organic Chemistry
0/20
Unit 21: Nuclear Chemistry
0/28
Text lesson
6.1 Electromagnetic Energy
6.1 Electromagnetic Energy — CHEMISTRY notes: You will be able to describe waves and their properties, calculate the frequency, wavelength and energy of light, and explain why light behaves as both a wave and a particle.
1
Explain the basic behavior of waves, including travelling waves and standing waves.
2
Describe the wave nature of light.
3
Use the appropriate equations to calculate frequency, wavelength and energy of light.
4
Distinguish between line and continuous emission spectra.
5
Describe the particle nature of light.
The nature of light
has been debated since ancient times.
In the seventeenth century Isaac Newton used lenses and prisms to show that white light is a mixture of the colors of the rainbow.
He explained his results with a particle, or corpuscular, model in which light consists of tiny fast-moving particles.
At the same time Christiaan Huygens
showed that reflection and refraction could be explained by treating light as a wave travelling through a hypothetical medium called luminiferous aether, which was believed to fill all of space.
In the early nineteenth century Thomas Young passed light through two narrow, closely spaced slits and observed interference patterns that only a wave model could explain.
1
Later in the nineteenth century James Clerk Maxwell developed his theory of electromagnetic radiation and showed that visible light is only one part of a wide spectrum of electromagnetic waves.
2
After this the particle view of light was largely abandoned.
3
By 1900 physicists saw the universe as two separate domains: matter, described by Newton’s laws of motion (classical mechanics), and electromagnetic radiation, described by Maxwell’s equations (classical electrodynamics).
4
A few observations
could not be explained by either framework, and these failures eventually led to wave-particle duality, the modern idea that matter and radiation both show wave and particle behavior.
1
Electromagnetic radiation matters in chemistry because it can be used to infer the energies of electrons in atoms and molecules.
2
Radio waves from a mobile phone, the X-rays used by dentists, the energy that heats food in a microwave oven, the radiant heat of a red-hot object and the light from a television screen are all forms of electromagnetic radiation that behave like waves.
A wave
is an oscillation, a repeated movement up and down or back and forth, that carries energy from one point in space to another.
Waves
are common.
When you shake one end of a rope, energy travels along the rope while each piece of rope only moves up and down in place.
A pebble dropped in a pond sends ripples across the surface, and the rapid expansion of air in a lightning strike produces sound waves (thunder) that can be heard miles away.
In every case kinetic energy
moves through the medium (rope, water or air) while the medium itself stays essentially where it is.
1
A stadium crowd doing the wave shows the same idea.
2
Fans in one section stand, raise their arms and sit down, and the neighboring sections copy them in turn.
The pattern
can travel around a large stadium in seconds, yet no fan leaves his or her seat.
Only the pattern
moves.
do not need a medium at all.
As Maxwell showed, they consist of an electric field and a magnetic field that oscillate in step with each other.
Electromagnetic waves
Both fields are perpendicular to each other and to the direction the wave travels.
In a vacuum every electromagnetic wave
moves at the same speed, the speed of light:
1
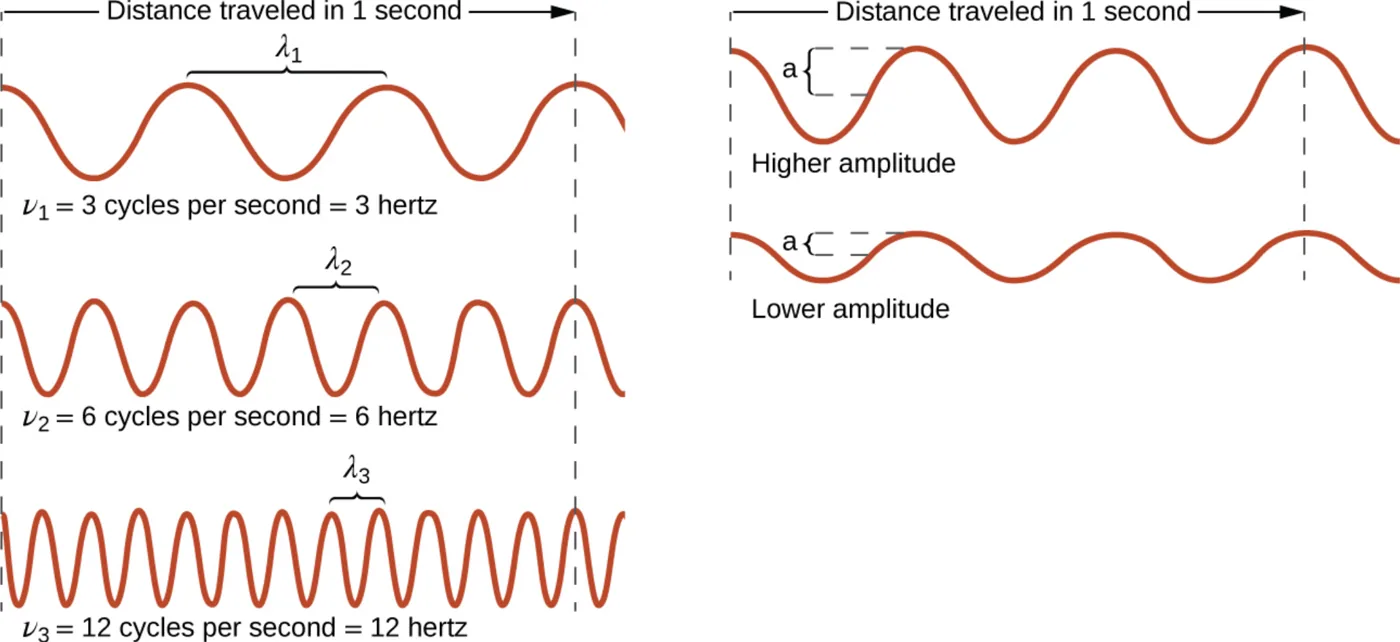
Wavelength (λ,
lowercase Greek lambda) is the distance between two consecutive peaks or two consecutive troughs. Its SI unit is the meter (m), although nanometers (nm) are common for visible light.
2
Frequency (ν,
lowercase Greek nu) is the number of wave cycles that pass a fixed point in one second. One cycle is one complete wavelength. Its unit is the hertz (Hz), which equals one cycle per second, or s−1. Megahertz (1 MHz = 1 × 10⁶ Hz) and gigahertz (1 GHz = 1 × 10⁹ Hz) are common multiples.
3
Amplitude
is the size of the wave’s displacement, measured as half the height from a peak to a trough. For light, amplitude is related to intensity, which we perceive as brightness. For sound, it is related to loudness.
The diagram below
shows sine waves of different wavelengths and amplitudes.
The wave with the shortest wavelength
has the highest frequency.
1
The product of a wave’s wavelength and its frequency gives the speed of the wave, λν.
2
For electromagnetic radiation in a vacuum this speed is fixed at c, so:
Symbols
c is the speed of light (m/s), λ is the wavelength (m), and ν is the frequency (s−1 or Hz).
Because c is constant,
wavelength and frequency are inversely proportional.
When the wavelength gets longer, the frequency gets smaller, and when the wavelength gets shorter, the frequency gets larger.
Since the energy of a photon also rises with frequency, short-wavelength radiation carries more energy per photon.
1
Electromagnetic waves cover an enormous range of wavelengths, from kilometers (103 m) down to picometers (10−12 m).
2
This whole range is the electromagnetic spectrum.
3
Visible light
is only a small part of it, and each color of visible light corresponds to a particular band of frequencies and wavelengths.
4
Different regions of the spectrum
are usually described in different units for practical and historical reasons.
5
Radio waves
are normally given as frequencies in megahertz, while visible light is normally given as wavelengths in nanometers or angstroms (1 Å = 0.1 nm).
6
The diagram below arranges the regions in order of decreasing frequency and increasing wavelength, from cosmic rays to radio waves, with an example of each region.

Many important technologies use the radio region of the spectrum, which runs from about 3 kHz to 300 GHz.
At the low-frequency, long-wavelength end are AM (amplitude modulation) radio signals, between 540 and 2830 kHz, which can travel long distances.
FM (frequency modulation) radio signals use higher frequencies, 87.5 to 108.0 MHz.
1
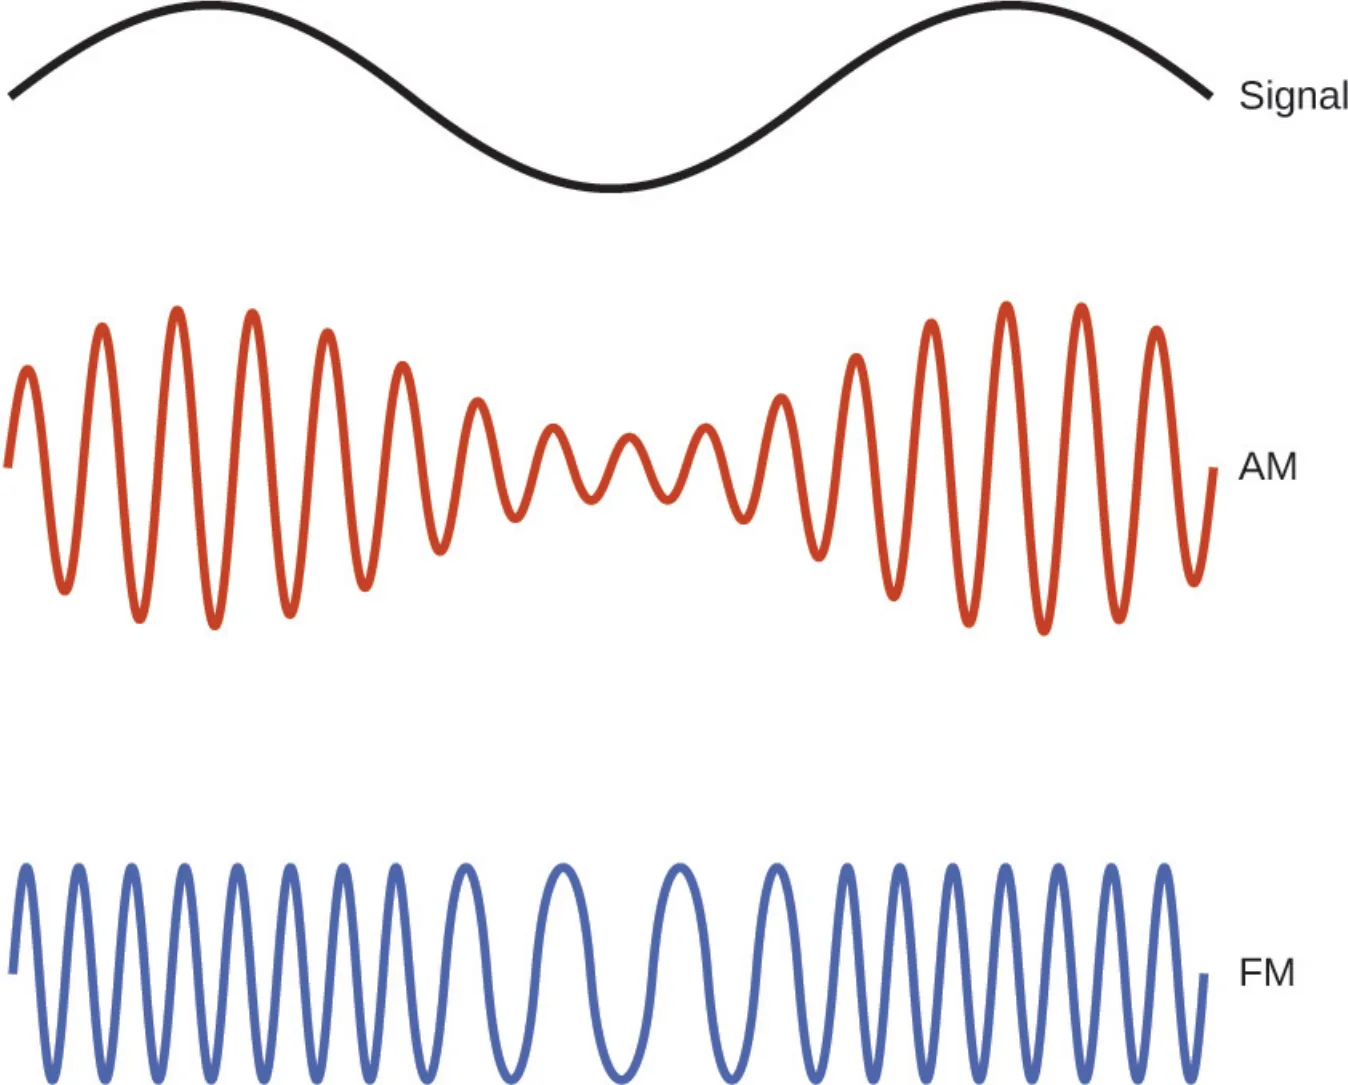
The two methods encode information differently.
2
In AM radio the information is carried by changing the amplitude of the wave.
3
In FM radio the amplitude stays constant and the instantaneous frequency is changed instead.
4
The diagram below
shows a signal and the AM and FM waves that carry it.

Other services use other radio frequencies.
Fourth-generation (4G) cellular telephone signals are about 880 MHz.
GPS signals operate at 1.228 GHz and 1.575 GHz.
Local wireless networks (Wi-Fi) use 2.4 to 5 GHz, and highway toll sensors use 5.8 GHz.
These frequencies are chosen partly because such waves are not absorbed much by common building materials.
When two or more waves meet, they interfere with one another.
Light passing through two narrow slits that are close together, about one wavelength apart, forms a pattern of bright and dark bands called fringes.
Each slit acts as a new source of waves, and the two sets of waves overlap at the screen.
Where a peak from one slit meets a trough from the other, the waves cancel.
This is destructive interference,
and it produces a dark region.
Where two peaks (or two troughs) meet, the waves reinforce each other.
This is constructive interference,
and it produces a bright region.
1
The fringe spacing depends on the wavelength.
Shorter-wavelength light,
such as blue light, gives fringes that are more closely spaced than longer-wavelength light passing through the same slits.
3
Interference patterns of this kind cannot be explained by particles moving under the laws of classical mechanics.
The same effect
is visible when two stones are dropped close together in a pond and their ripples overlap.

moves through space.
A standing wave,
also called a stationary wave, stays inside a fixed region.
Standing waves
are important for understanding the electronic structure of atoms and molecules.
Not every wave
The simplest example
is a string held fixed at both ends, like a guitar string.
The diagram below
shows the four lowest-energy standing waves of such a string: the fundamental wave and its first three harmonics.
Only some waves
can exist on a string held at both ends.
The ends cannot
move, so the string must contain a whole number, n, of half-wavelengths between them.
This restriction is called quantization
only certain discrete values are allowed from a range of values that would be possible otherwise.
The points on the string between the ends that never move are called nodes.
A string with n half-wavelengths has n − 1 nodes.
The energy of a standing wave of a given amplitude rises as n increases, so the energy depends on the number of nodes, and it generally goes up as the number of nodes goes up.

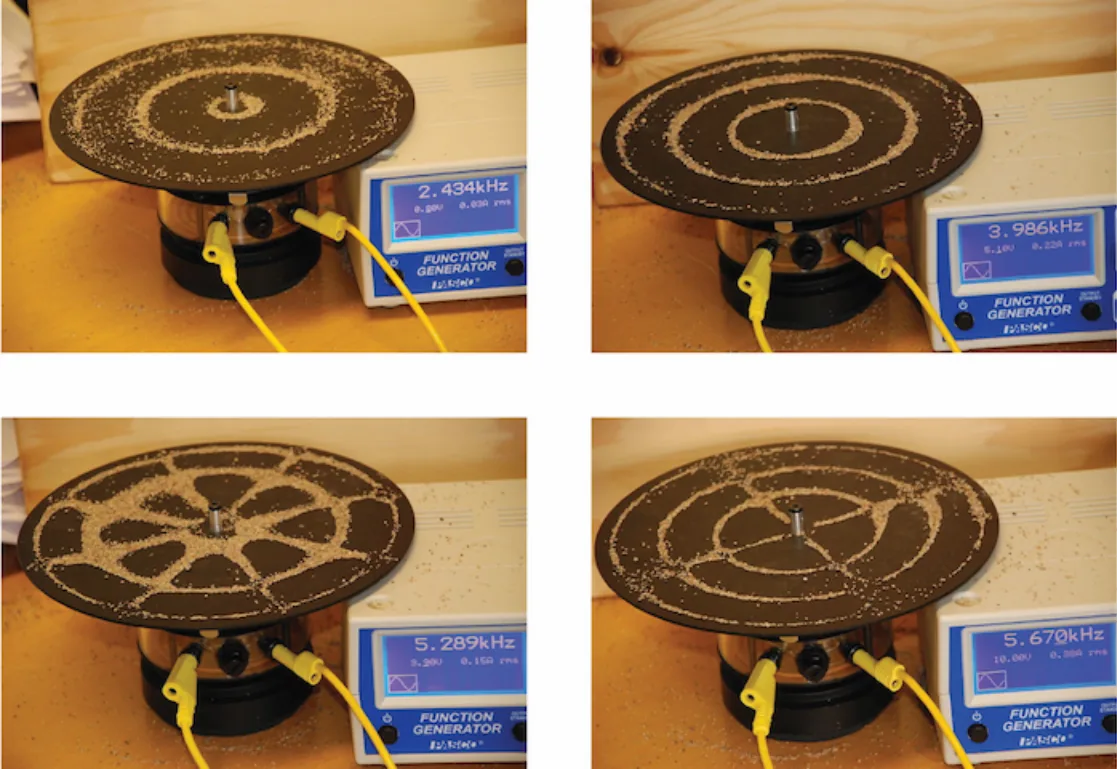
occur in two dimensions.
The diagram below
shows the vibration patterns of a drum head.
The vibration amplitudes cannot be seen directly, so the drum was dusted with powder that collects where the surface is not moving.
Standing waves also
In two dimensions the nodes
are lines rather than points.
Circular nodes
are called radial nodes and straight lines running out from the center are called angular nodes.
In three dimensions nodes
are surfaces.
1
A link to learning recommends a video of a singer whose voice makes a kettle drum vibrate in different patterns.
2
The idea
is the same as the drum above: a higher-energy vibration creates more nodal circles.
have wavelengths of roughly 0.01 to 10 nm.
These wavelengths are close to the spacing between atoms in a crystalline solid, so X-rays are scattered by the crystal.
The scattered rays interfere constructively and destructively and produce a diffraction pattern.
X-rays
Measuring that pattern allows chemists to determine the positions of atoms in a crystal.
This method,
X-ray diffraction, underlies powerful techniques for finding molecular structures.
Dorothy Crowfoot Hodgkin
was one of the pioneers who applied X-ray crystallography to biochemical substances.
She was born in Cairo,
Egypt, in 1910 to British parents and was drawn to chemistry early.
At age 11 she entered a prestigious English grammar school, where she was one of two girls allowed to study chemistry.
On her sixteenth birthday her mother
gave her a book on X-ray crystallography, which shaped her career.
She studied at Oxford,
graduating with first-class honors in 1932, and then moved to Cambridge for her doctorate, which she earned in 1937.
At Cambridge she recognized that X-ray crystallography could determine the structures of proteins.
1
Over her career Hodgkin determined the structures of several important biomolecules, including cholesterol iodide, penicillin and vitamin B12.
2
She received the 1964 Nobel Prize in Chemistry for using X-ray techniques to find the structures of biochemical substances.
3
In 1969 she led a team that determined the structure of insulin.
4
This made it possible to produce insulin on a large scale and greatly improved the treatment of patients with diabetes.
5
She continued to work with scientists around the world and received many other awards until her death in 1993.
1
In the late nineteenth century, electric lighting was being developed commercially, and designers needed to know how much light different sources emit at each wavelength.
2
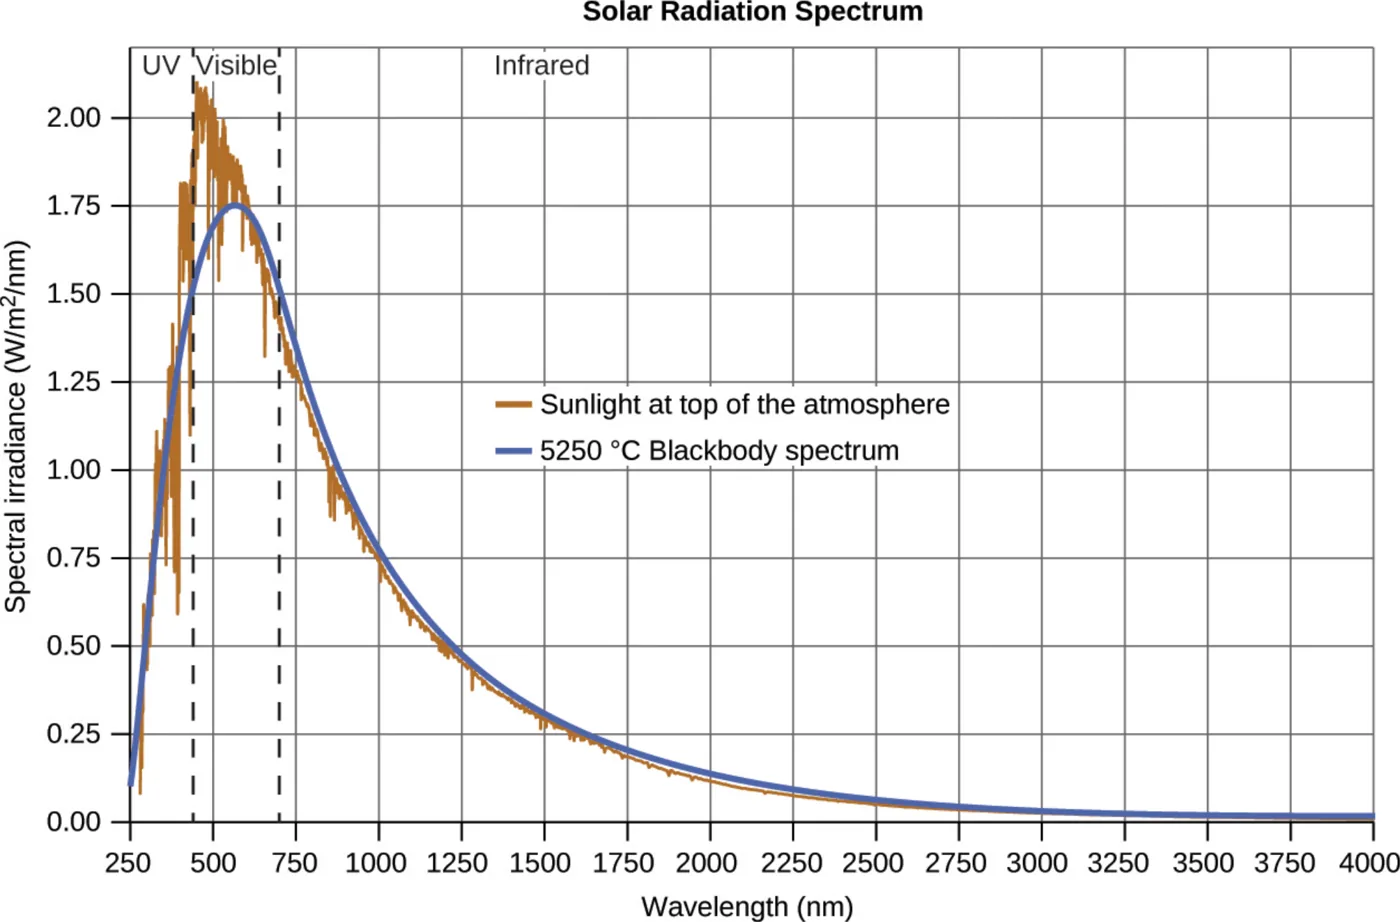
Sunlight is a broad continuous spectrum.
3
Its intensity is greatest in the visible region, falls off quickly toward shorter ultraviolet wavelengths and more slowly toward longer infrared wavelengths.
4
The diagram below
compares measured sunlight at the top of the atmosphere with the curve for a blackbody at 5250 °C.
A blackbody
is an ideal emitter that approximates many materials when they are heated.
It is ideal in the same way an ideal gas is a simple model that works well for real gases at moderate pressures and temperatures.
A metal oven with a small hole is a good practical approximation.
Light leaving the hole can be measured with a spectrometer to give intensity at each wavelength.
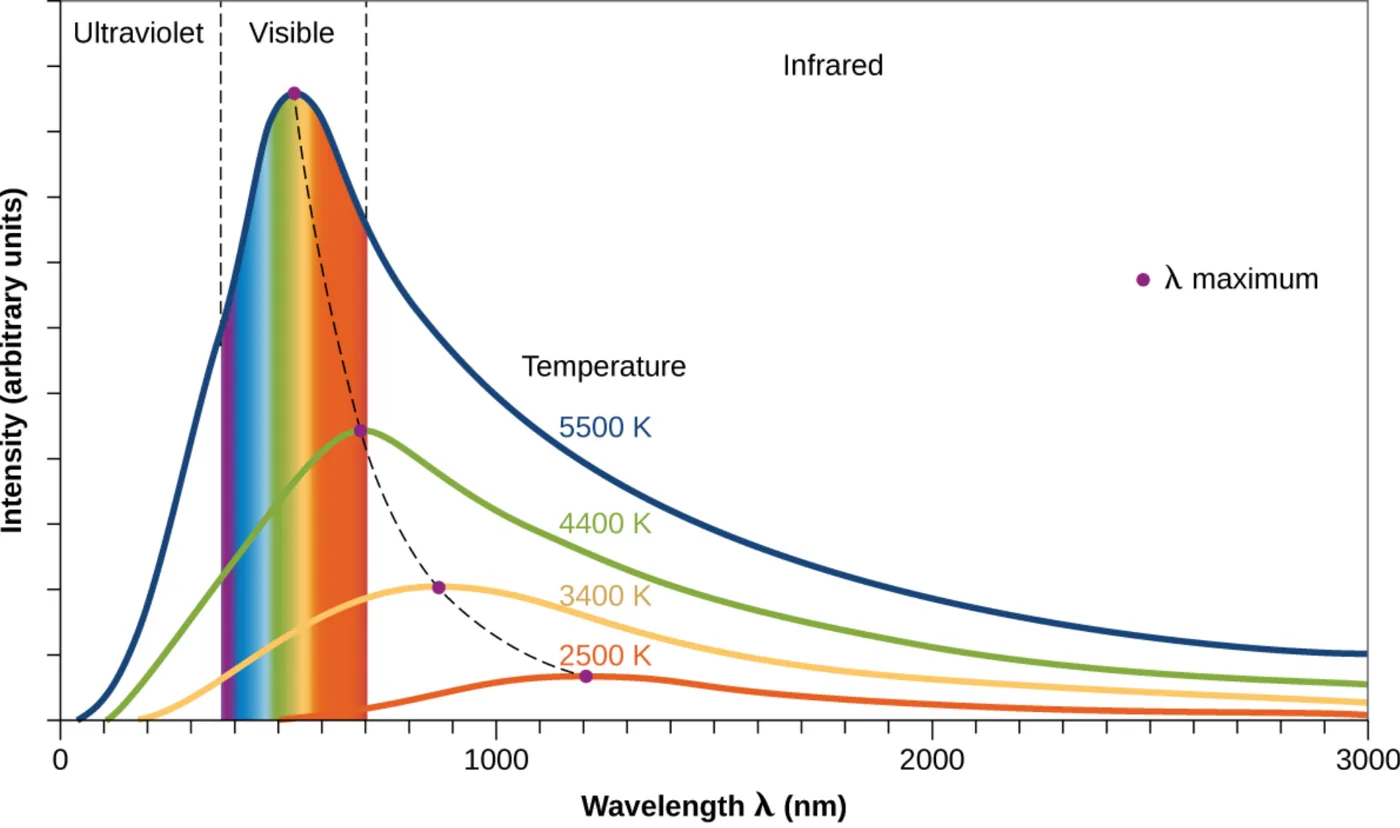
Each blackbody curve depends only on temperature.
As the temperature rises, the wavelength of maximum intensity, λmax, shifts to shorter wavelengths.
That is why metal glows dull red when heated, then brighter red, and eventually white at very high temperatures, when all visible wavelengths are emitted strongly.
The diagram below
shows blackbody curves at four temperatures.
1
Classical theory predicted the curves correctly at long wavelengths but failed at short wavelengths.
2
It predicted that intensity grows without limit as wavelength shrinks, which would mean that objects at room temperature should emit large amounts of ultraviolet light.
3
This failure was called the ultraviolet catastrophe.
4
In about 1900 Max Planck derived an expression that matched the experimental curves exactly.
5
He assumed that the vibrating atoms in the oven could only have certain discrete energies for each frequency, not any value in a continuous range.
6
This quantization made the intensity fall off at short wavelengths, as observed.
1
The constant that appears in Planck’s expression is named Planck’s constant, h.
2
Its value is very small, so quantization is hard to see in everyday objects:
1
Symbols
E is the energy of one quantum (J), h is Planck’s constant (J s), and ν is the frequency (s−1).
2
Planck himself
was uneasy about the assumption of quantized energies because he could not explain it physically.
1
The next paradox concerned the photoelectric effect.
2
When light of sufficiently high frequency shines on the clean surface of a metal, electrons are ejected.
3
Light below a threshold frequency ejects nothing, however bright it is.
4
The kinetic energy of the ejected electrons does not depend on the brightness of the light.
5
It increases with the frequency of the light.
6
The number of electrons ejected does increase with brightness.
7
Classical wave theory
could not explain this, because it predicts that a wave’s energy depends on its intensity (amplitude), not its frequency.
In 1905 Albert Einstein resolved the paradox by applying Planck’s quantization to light itself.
Light
is a stream of particles, now called photons, and the energy of each photon is set by its frequency through Planck’s relation, E = hν.
A photon
must have at least the threshold energy to free an electron from the metal.
Any extra energy
becomes the kinetic energy of the ejected electron.
Brightness corresponds to the number of photons arriving each second, so brighter light ejects more electrons without changing their energy.
(Einstein received the Nobel Prize for this work, not for his theories of relativity.)
1
Light therefore behaves like a wave in interference and like a particle in the photoelectric effect.
2
This dual behavior is called wave-particle duality.
3
The diagram below shows the threshold behavior
photons below the threshold frequency eject no electrons, and above it the electron kinetic energy rises linearly with photon energy.

1
A link to learning points to a simulation in which you can change the light intensity, the light frequency and the type of metal to see how each affects the ejected electrons.
2
Doing this
lets you confirm for yourself that frequency controls the energy and intensity controls the number.
1
Another paradox concerned the light emitted by atoms and molecules.
2
Solids, liquids and dense gases that are heated give off light with a continuous range of energies, so they show a continuous spectrum with no gaps.
3
Most light from stars, including the sun, is produced this way.
4
A prism splits sunlight into all the visible colors.
5
Sunlight also contains ultraviolet and infrared light, which cannot be seen.
6
Incandescent solids such as the tungsten filament of a light bulb emit a continuous spectrum that can often be approximated by a blackbody curve at a suitable temperature.
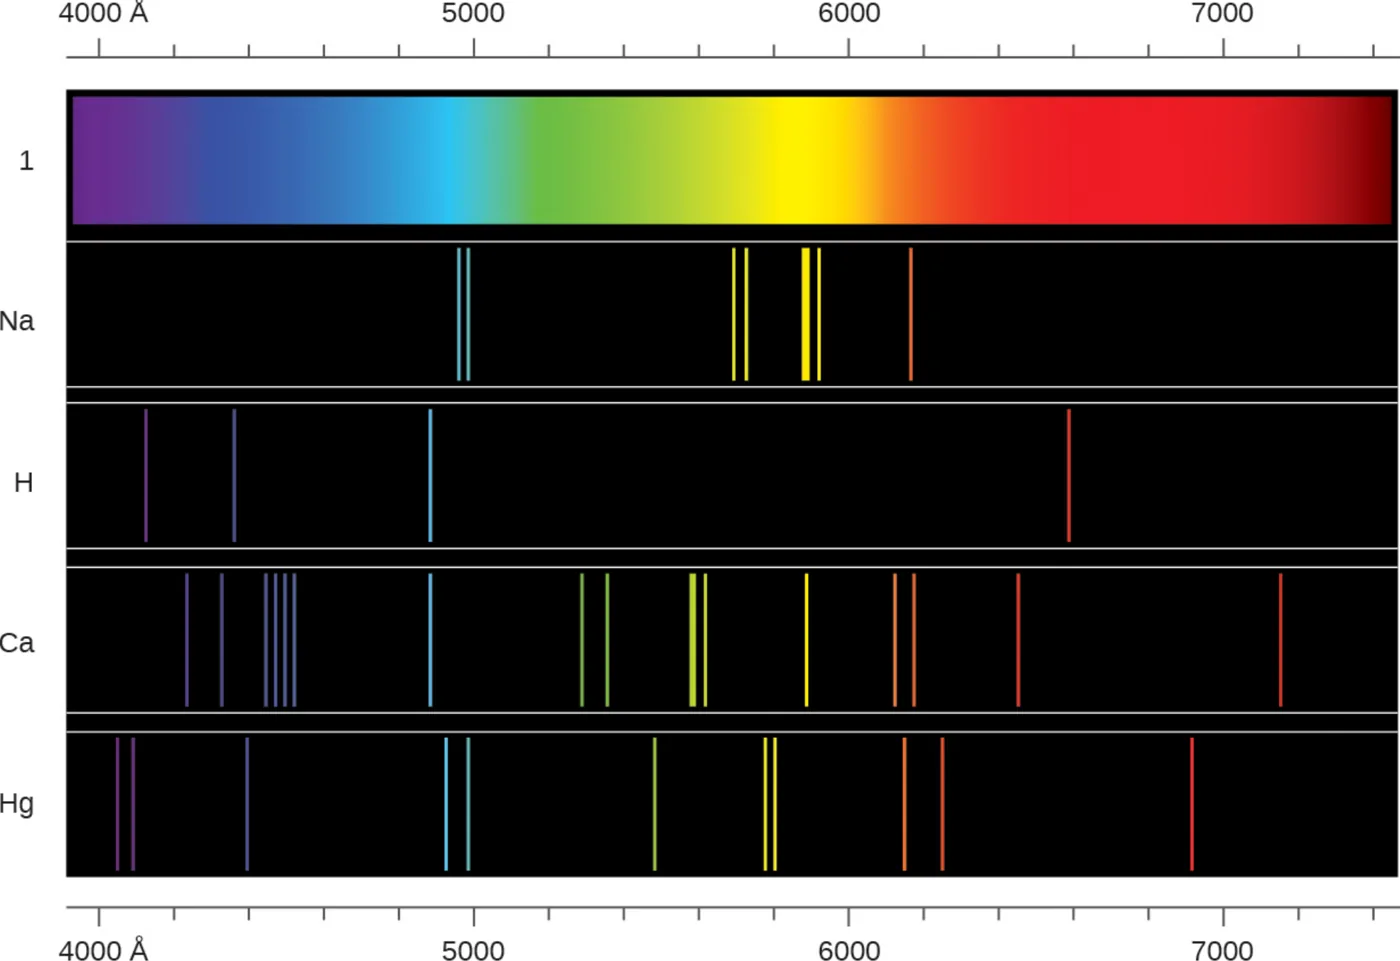
A line spectrum
is different.
It consists of discrete,
very narrow lines at specific wavelengths, separated by dark regions.
A gas at low pressure
produces a line spectrum when an electric current passes through it or when it is heated.
Fluorescent lights and neon signs work this way.
Each element has its own characteristic set of lines, and molecules also give line spectra, although these are usually much more complicated.
The diagram below
compares a continuous white-light spectrum with the line spectra of excited sodium, hydrogen, calcium and mercury.

1
Each emission line is a single wavelength, so the light from a gas consists of photons with a set of discrete energies.
2
When an electric discharge passes through hydrogen gas at low pressure, the H2 molecules split into hydrogen atoms and the gas glows blue-pink.
3
A prism shows that this light has four visible wavelengths.
Classical electromagnetic theory predicted only continuous spectra, so line spectra were a puzzle.
In 1885 Johann Balmer
found an empirical equation that relates the four visible hydrogen wavelengths to whole numbers.
In it, k is a constant and n is an integer greater than 2:
Other hydrogen lines
were later found in the ultraviolet and infrared.
Johannes Rydberg generalized Balmer’s work with a formula that predicts all of hydrogen’s emission lines:
Symbols
λ is the wavelength (m), n1 and n2 are integers, and R∞ is the Rydberg constant, 1.097 × 10⁷ m−1.
Setting n1 = 2 and n2 = 3 gives λ ≈ 656 nm, a visible red line.
Because spectroscopy in the nineteenth century was very precise, the hydrogen wavelengths gave the Rydberg constant to high accuracy.
Niels Bohr’s 1913 explanation of emission spectra finally convinced scientists to abandon classical physics and led to modern quantum mechanics.
Solution
1
rearrange c = λν to give ν = c/λ.
2
Since c
is in m/s, convert the wavelength first: 589 nm = 589 × 10−9 m = 5.89 × 10⁻⁷ m.
3
Then ν = (2.998 × 10⁸ m/s)/(5.89 × 10−7 m) = 5.09 × 10¹⁴ s−1.
4
The frequency is 5.09 × 10¹⁴ Hz.
Check your learning
One frequency used for cellular telephone signals in the United States is 850 MHz. What is the wavelength in meters of these radio waves?
Answer
λ = c/ν = (2.998 × 10⁸ m/s)/(8.50 × 108 s−1) = 0.353 m, which is 35.3 cm.
Solution
1
use the form of Planck’s equation that contains wavelength, E = hc/λ, and express the wavelength in meters so that the units match. λ = 640 nm = 6.40 × 10⁻⁷ m.
2
Then E = (6.626 × 10⁻³⁴ J s)(2.998 × 10⁸ m/s)/(6.40 × 10−7 m) = 3.10 × 10⁻¹⁹ J.
3
One photon of this light carries 3.10 × 10⁻¹⁹ J.
Check your learning
Microwave ovens use a frequency of about 3 × 10⁹ Hz, which heats water molecules in food. What is the energy of one photon of these microwaves?
Answer
E = hν = (6.626 × 10⁻³⁴ J s)(3 × 10⁹ s−1) = 2 × 10⁻²⁴ J.
Solution
1
(a) False.
2
Brightness has no effect on the kinetic energy of the ejected electrons.
3
Only the energy of each photon, which depends on its frequency, sets the kinetic energy.
4
The corrected statement is that increasing the brightness has no effect on the kinetic energy.
5
(b) False.
6
Frequency
is proportional to energy and inversely proportional to wavelength, so increasing the frequency, not the wavelength, increases the kinetic energy.
7
Frequencies above the threshold transfer the excess energy to the electrons.
8
(c) True.
9
Brighter light delivers more photons per second, so more collisions occur and more electrons are ejected.
10
(d) True when the threshold is taken into account.
11
Below the threshold frequency no electrons are emitted.
12
Once the frequency
is above the threshold, electrons are emitted, but raising the frequency further does not increase the number ejected.
Check your learning
Calculate the threshold energy, in kJ/mol, for electrons in aluminum, given that the lowest-frequency photon that produces the photoelectric effect has a frequency of 9.87 × 10¹⁴ Hz.
Answer
The energy of one photon at the threshold is E = hν = (6.626 × 10⁻³⁴ J s)(9.87 × 10¹⁴ s−1) = 6.54 × 10⁻¹⁹ J. Multiplying by Avogadro’s number, 6.022 × 10²³ mol−1, gives 3.94 × 10⁵ J/mol, or 394 kJ/mol.
Using the wavelength in nanometers directly in c = λν
The wavelength must be converted to meters, so 589 nm becomes 5.89 × 10⁻⁷ m.
Thinking that a longer wavelength means a higher frequency
The two are inversely proportional, so a longer wavelength always means a lower frequency.
Saying that a brighter light increases the kinetic energy of photoelectrons
Brightness increases the number of electrons ejected, while frequency determines their kinetic energy.
Forgetting the threshold in the photoelectric effect
Light below the threshold frequency ejects no electrons, no matter how intense it is.
Counting nodes incorrectly on a standing wave
A string with n half-wavelengths has n − 1 nodes, and the two fixed ends are not counted.
Confusing continuous and line spectra
A hot solid gives a continuous spectrum, while a low-pressure excited gas gives discrete lines.
Using the Rydberg formula with n1 greater than n2, or treating n1 and n2 as non-integers
The integers must satisfy n1 < n2.