Curriculum
Chemistry 2e
Unit 1: Essential Ideas
0/14
-
Unit 1 overview: Essential Ideas
 Text lessonPreview
-
1.1 Chemistry in Context
Text lessonPreview
-
1.1 Chemistry in Context - Check yourself
 6 questionsPreview
-
1.2 Phases and Classification of Matter
Text lessonPreview
-
1.2 Phases and Classification of Matter - Check yourself
6 questionsPreview
-
1.3 Physical and Chemical Properties
Text lessonPreview
-
1.3 Physical and Chemical Properties - Check yourself
6 questionsPreview
-
1.4 Measurements
Text lessonPreview
-
1.4 Measurements - Check yourself
6 questionsPreview
-
1.5 Measurement Uncertainty, Accuracy, and Precision
Text lessonPreview
-
1.5 Measurement Uncertainty, Accuracy, and Precision - Check yourself
6 questionsPreview
-
1.6 Mathematical Treatment of Measurement Results
Text lessonPreview
-
1.6 Mathematical Treatment of Measurement Results - Check yourself
6 questionsPreview
-
Unit 1 review quiz: Essential Ideas
10 questionsPreview
Unit 2: Atoms, Molecules, and Ions
0/16
-
Unit 2 overview: Atoms, Molecules, and Ions
Text lessonPreview
-
2.1 Early Ideas in Atomic Theory
Text lessonPreview
-
2.1 Early Ideas in Atomic Theory - Check yourself
6 questionsPreview
-
2.2 Evolution of Atomic Theory
Text lessonPreview
-
2.2 Evolution of Atomic Theory - Check yourself
6 questionsPreview
-
2.3 Atomic Structure and Symbolism
Text lessonPreview
-
2.3 Atomic Structure and Symbolism - Check yourself
6 questionsPreview
-
2.4 Chemical Formulas
Text lessonPreview
-
2.4 Chemical Formulas - Check yourself
6 questionsPreview
-
2.5 The Periodic Table
Text lessonPreview
-
2.5 The Periodic Table - Check yourself
6 questionsPreview
-
2.6 Ionic and Molecular Compounds
Text lessonPreview
-
2.6 Ionic and Molecular Compounds - Check yourself
6 questionsPreview
-
2.7 Chemical Nomenclature
Text lessonPreview
-
2.7 Chemical Nomenclature - Check yourself
6 questionsPreview
-
Unit 2 review quiz: Atoms, Molecules, and Ions
10 questionsPreview
Unit 3: Composition of Substances and Solutions
0/10
-
Unit 3 overview: Composition of Substances and Solutions
Text lessonPreview
-
3.1 Formula Mass and the Mole Concept
Text lessonPreview
-
3.1 Formula Mass and the Mole Concept - Check yourself
6 questionsPreview
-
3.2 Determining Empirical and Molecular Formulas
Text lessonPreview
-
3.2 Determining Empirical and Molecular Formulas - Check yourself
6 questionsPreview
-
3.3 Molarity
Text lessonPreview
-
3.3 Molarity - Check yourself
6 questionsPreview
-
3.4 Other Units for Solution Concentrations
Text lessonPreview
-
3.4 Other Units for Solution Concentrations - Check yourself
6 questionsPreview
-
Unit 3 review quiz: Composition of Substances and Solutions
10 questionsPreview
Unit 4: Stoichiometry of Chemical Reactions
0/12
-
Unit 4 overview: Stoichiometry of Chemical Reactions
Text lessonPreview
-
4.1 Writing and Balancing Chemical Equations
Text lessonPreview
-
4.1 Writing and Balancing Chemical Equations - Check yourself
6 questionsPreview
-
4.2 Classifying Chemical Reactions
Text lessonPreview
-
4.2 Classifying Chemical Reactions - Check yourself
6 questionsPreview
-
4.3 Reaction Stoichiometry
Text lessonPreview
-
4.3 Reaction Stoichiometry - Check yourself
6 questionsPreview
-
4.4 Reaction Yields
Text lessonPreview
-
4.4 Reaction Yields - Check yourself
6 questionsPreview
-
4.5 Quantitative Chemical Analysis
Text lessonPreview
-
4.5 Quantitative Chemical Analysis - Check yourself
6 questionsPreview
-
Unit 4 review quiz: Stoichiometry of Chemical Reactions
10 questionsPreview
Unit 5: Thermochemistry
0/8
-
Unit 5 overview: Thermochemistry
Text lessonPreview
-
5.1 Energy Basics
Text lessonPreview
-
5.1 Energy Basics - Check yourself
6 questionsPreview
-
5.2 Calorimetry
Text lessonPreview
-
5.2 Calorimetry - Check yourself
7 questionsPreview
-
5.3 Enthalpy
Text lessonPreview
-
5.3 Enthalpy - Check yourself
6 questionsPreview
-
Unit 5 review quiz: Thermochemistry
10 questionsPreview
Unit 6: Electronic Structure and Periodic Properties of Elements
0/12
-
Unit 6 overview: Electronic Structure and Periodic Properties of Elements
Text lessonPreview
-
6.1 Electromagnetic Energy
Text lessonPreview
-
6.1 Electromagnetic Energy - Check yourself
6 questionsPreview
-
6.2 The Bohr Model
Text lessonPreview
-
6.2 The Bohr Model - Check yourself
6 questionsPreview
-
6.3 Development of Quantum Theory
Text lessonPreview
-
6.3 Development of Quantum Theory - Check yourself
6 questionsPreview
-
6.4 Electronic Structure of Atoms (Electron Configurations)
Text lessonPreview
-
6.4 Electronic Structure of Atoms (Electron Configurations) - Check yourself
6 questionsPreview
-
6.5 Periodic Variations in Element Properties
Text lessonPreview
-
6.5 Periodic Variations in Element Properties - Check yourself
6 questionsPreview
-
Unit 6 review quiz: Electronic Structure and Periodic Properties of Elements
10 questionsPreview
Unit 7: Chemical Bonding and Molecular Geometry
0/14
-
Unit 7 overview: Chemical Bonding and Molecular Geometry
Text lessonPreview
-
7.1 Ionic Bonding
Text lessonPreview
-
7.1 Ionic Bonding - Check yourself
6 questionsPreview
-
7.2 Covalent Bonding
Text lessonPreview
-
7.2 Covalent Bonding - Check yourself
6 questionsPreview
-
7.3 Lewis Symbols and Structures
Text lessonPreview
-
7.3 Lewis Symbols and Structures - Check yourself
6 questionsPreview
-
7.4 Formal Charges and Resonance
Text lessonPreview
-
7.4 Formal Charges and Resonance - Check yourself
6 questionsPreview
-
7.5 Strengths of Ionic and Covalent Bonds
Text lessonPreview
-
7.5 Strengths of Ionic and Covalent Bonds - Check yourself
6 questionsPreview
-
7.6 Molecular Structure and Polarity
Text lessonPreview
-
7.6 Molecular Structure and Polarity - Check yourself
6 questionsPreview
-
Unit 7 review quiz: Chemical Bonding and Molecular Geometry
10 questionsPreview
Unit 8: Advanced Theories of Covalent Bonding
0/10
-
Unit 8 overview: Advanced Theories of Covalent Bonding
Text lessonPreview
-
8.1 Valence Bond Theory
Text lessonPreview
-
8.1 Valence Bond Theory - Check yourself
6 questionsPreview
-
8.2 Hybrid Atomic Orbitals
Text lessonPreview
-
8.2 Hybrid Atomic Orbitals - Check yourself
6 questionsPreview
-
8.3 Multiple Bonds
Text lessonPreview
-
8.3 Multiple Bonds - Check yourself
6 questionsPreview
-
8.4 Molecular Orbital Theory
Text lessonPreview
-
8.4 Molecular Orbital Theory - Check yourself
6 questionsPreview
-
Unit 8 review quiz: Advanced Theories of Covalent Bonding
10 questionsPreview
Unit 9: Gases
0/23
-
Unit 9 overview: Gases
Text lessonPreview
-
9.1 Gas Pressure
Text lessonPreview
-
9.1 Gas Pressure - Check yourself
6 questionsPreview
-
9.2 Relating Pressure, Volume, Amount, and Temperature: The Ideal Gas Law
Text lessonPreview
-
9.2 Relating Pressure, Volume, Amount, and Temperature: The Ideal Gas Law - Check yourself
6 questionsPreview
-
9.3 Stoichiometry of Gaseous Substances, Mixtures, and Reactions
Text lessonPreview
-
9.3 Stoichiometry of Gaseous Substances, Mixtures, and Reactions - Check yourself
6 questionsPreview
-
9.3 Stoichiometry of Gaseous Substances, Mixtures, and Reactions
Text lessonPreview
-
9.3 Stoichiometry of Gaseous Substances, Mixtures, and Reactions - Check yourself
6 questionsPreview
-
9.4 Effusion and Diffusion of Gases
Text lessonPreview
-
9.4 Effusion and Diffusion of Gases - Check yourself
6 questionsPreview
-
9.4 Effusion and Diffusion of Gases
Text lessonPreview
-
9.4 Effusion and Diffusion of Gases - Check yourself
6 questionsPreview
-
Unit 9 review quiz: Gases
10 questionsPreview
-
9.5 The Kinetic-Molecular Theory
Text lessonPreview
-
9.5 The Kinetic-Molecular Theory - Check yourself
6 questionsPreview
-
9.5 The Kinetic-Molecular Theory
Text lessonPreview
-
9.5 The Kinetic-Molecular Theory - Check yourself
6 questionsPreview
-
9.6 Non-Ideal Gas Behavior
Text lessonPreview
-
9.6 Non-Ideal Gas Behavior - Check yourself
6 questionsPreview
-
9.6 Non-Ideal Gas Behavior
Text lessonPreview
-
9.6 Non-Ideal Gas Behavior - Check yourself
6 questionsPreview
-
Unit 9 review quiz: Gases
10 questionsPreview
Unit 10: Liquids and Solids
0/28
-
Unit 10 overview: Liquids and Solids
Text lessonPreview
-
10.1 Intermolecular Forces
Text lessonPreview
-
Unit 10 overview: Liquids and Solids
Text lessonPreview
-
10.1 Intermolecular Forces
Text lessonPreview
-
10.1 Intermolecular Forces - Check yourself
6 questionsPreview
-
10.1 Intermolecular Forces - Check yourself
6 questionsPreview
-
10.2 Properties of Liquids
Text lessonPreview
-
10.2 Properties of Liquids - Check yourself
6 questionsPreview
-
10.2 Properties of Liquids
Text lessonPreview
-
10.2 Properties of Liquids - Check yourself
6 questionsPreview
-
10.3 Phase Transitions
Text lessonPreview
-
10.3 Phase Transitions - Check yourself
6 questionsPreview
-
10.3 Phase Transitions
Text lessonPreview
-
10.3 Phase Transitions - Check yourself
6 questionsPreview
-
10.4 Phase Diagrams
Text lessonPreview
-
10.4 Phase Diagrams
Text lessonPreview
-
10.4 Phase Diagrams - Check yourself
6 questionsPreview
-
10.4 Phase Diagrams - Check yourself
6 questionsPreview
-
10.5 The Solid State of Matter
Text lessonPreview
-
10.5 The Solid State of Matter
Text lessonPreview
-
10.5 The Solid State of Matter - Check yourself
6 questionsPreview
-
10.5 The Solid State of Matter - Check yourself
6 questionsPreview
-
10.6 Lattice Structures in Crystalline Solids
Text lessonPreview
-
10.6 Lattice Structures in Crystalline Solids
Text lessonPreview
-
10.6 Lattice Structures in Crystalline Solids - Check yourself
6 questionsPreview
-
10.6 Lattice Structures in Crystalline Solids - Check yourself
6 questionsPreview
-
Unit 10 review quiz: Liquids and Solids
10 questionsPreview
-
Unit 10 review quiz: Liquids and Solids
10 questionsPreview
Unit 11: Solutions and Colloids
0/24
-
Unit 11 overview: Solutions and Colloids
Text lessonPreview
-
11.1 The Dissolution Process
Text lessonPreview
-
Unit 11 overview: Solutions and Colloids
Text lessonPreview
-
11.1 The Dissolution Process
Text lessonPreview
-
11.1 The Dissolution Process - Check yourself
6 questionsPreview
-
11.1 The Dissolution Process - Check yourself
6 questionsPreview
-
11.2 Electrolytes
Text lessonPreview
-
11.2 Electrolytes - Check yourself
6 questionsPreview
-
11.2 Electrolytes
Text lessonPreview
-
11.2 Electrolytes - Check yourself
6 questionsPreview
-
11.3 Solubility
Text lessonPreview
-
11.3 Solubility - Check yourself
6 questionsPreview
-
11.3 Solubility
Text lessonPreview
-
11.3 Solubility - Check yourself
6 questionsPreview
-
11.4 Colligative Properties
Text lessonPreview
-
11.4 Colligative Properties - Check yourself
6 questionsPreview
-
11.4 Colligative Properties
Text lessonPreview
-
11.4 Colligative Properties - Check yourself
6 questionsPreview
-
11.5 Colloids
Text lessonPreview
-
11.5 Colloids - Check yourself
6 questionsPreview
-
11.5 Colloids
Text lessonPreview
-
11.5 Colloids - Check yourself
6 questionsPreview
-
Unit 11 review quiz: Solutions and Colloids
10 questionsPreview
-
Unit 11 review quiz: Solutions and Colloids
10 questionsPreview
Unit 12: Kinetics
0/32
-
Unit 12 overview: Kinetics
Text lessonPreview
-
12.1 Chemical Reaction Rates
Text lessonPreview
-
12.1 Chemical Reaction Rates - Check yourself
6 questionsPreview
-
Unit 12 overview: Kinetics
Text lessonPreview
-
12.1 Chemical Reaction Rates
Text lessonPreview
-
12.1 Chemical Reaction Rates - Check yourself
6 questionsPreview
-
12.2 Factors Affecting Reaction Rates
Text lessonPreview
-
12.2 Factors Affecting Reaction Rates - Check yourself
6 questionsPreview
-
12.2 Factors Affecting Reaction Rates
Text lessonPreview
-
12.2 Factors Affecting Reaction Rates - Check yourself
6 questionsPreview
-
12.3 Rate Laws
Text lessonPreview
-
12.3 Rate Laws - Check yourself
6 questionsPreview
-
12.3 Rate Laws
Text lessonPreview
-
12.3 Rate Laws - Check yourself
6 questionsPreview
-
12.4 Integrated Rate Laws
Text lessonPreview
-
12.4 Integrated Rate Laws - Check yourself
6 questionsPreview
-
12.4 Integrated Rate Laws
Text lessonPreview
-
12.4 Integrated Rate Laws - Check yourself
6 questionsPreview
-
12.5 Collision Theory
Text lessonPreview
-
12.5 Collision Theory - Check yourself
6 questionsPreview
-
12.5 Collision Theory
Text lessonPreview
-
Unit 12 review quiz: Kinetics
10 questionsPreview
-
12.5 Collision Theory - Check yourself
6 questionsPreview
-
12.6 Reaction Mechanisms
Text lessonPreview
-
12.6 Reaction Mechanisms - Check yourself
6 questionsPreview
-
12.6 Reaction Mechanisms
Text lessonPreview
-
12.6 Reaction Mechanisms - Check yourself
6 questionsPreview
-
12.7 Catalysis
Text lessonPreview
-
12.7 Catalysis - Check yourself
6 questionsPreview
-
12.7 Catalysis
Text lessonPreview
-
12.7 Catalysis - Check yourself
6 questionsPreview
-
Unit 12 review quiz: Kinetics
10 questionsPreview
Unit 13: Fundamental Equilibrium Concepts
0/20
-
Unit 13 overview: Fundamental Equilibrium Concepts
Text lessonPreview
-
13.1 Chemical Equilibria
Text lessonPreview
-
13.1 Chemical Equilibria - Check yourself
6 questionsPreview
-
13.1 Chemical Equilibria
Text lessonPreview
-
13.1 Chemical Equilibria - Check yourself
6 questionsPreview
-
13.2 Equilibrium Constants
Text lessonPreview
-
13.2 Equilibrium Constants - Check yourself
6 questionsPreview
-
13.2 Equilibrium Constants
Text lessonPreview
-
Unit 13 overview: Fundamental Equilibrium Concepts
Text lessonPreview
-
13.2 Equilibrium Constants - Check yourself
6 questionsPreview
-
13.3 Shifting Equilibria: Le Châtelier’s Principle
Text lessonPreview
-
13.3 Shifting Equilibria: Le Châtelier’s Principle - Check yourself
6 questionsPreview
-
13.3 Shifting Equilibria: Le Châtelier’s Principle
Text lessonPreview
-
Unit 13 review quiz: Fundamental Equilibrium Concepts
10 questionsPreview
-
13.3 Shifting Equilibria: Le Châtelier’s Principle - Check yourself
6 questionsPreview
-
13.4 Equilibrium Calculations
Text lessonPreview
-
13.4 Equilibrium Calculations - Check yourself
6 questionsPreview
-
13.4 Equilibrium Calculations
Text lessonPreview
-
13.4 Equilibrium Calculations - Check yourself
6 questionsPreview
-
Unit 13 review quiz: Fundamental Equilibrium Concepts
10 questionsPreview
Unit 14: Acid-Base Equilibria
0/32
-
Unit 14 overview: Acid-Base Equilibria
Text lessonPreview
-
14.1 Brønsted-Lowry Acids and Bases
Text lessonPreview
-
14.1 Brønsted-Lowry Acids and Bases - Check yourself
6 questionsPreview
-
14.1 Brønsted-Lowry Acids and Bases
Text lessonPreview
-
14.1 Brønsted-Lowry Acids and Bases - Check yourself
6 questionsPreview
-
14.2 pH and pOH
Text lessonPreview
-
14.2 pH and pOH - Check yourself
6 questionsPreview
-
14.2 pH and pOH
Text lessonPreview
-
14.2 pH and pOH - Check yourself
6 questionsPreview
-
14.3 Relative Strengths of Acids and Bases
Text lessonPreview
-
14.3 Relative Strengths of Acids and Bases - Check yourself
6 questionsPreview
-
14.3 Relative Strengths of Acids and Bases
Text lessonPreview
-
14.3 Relative Strengths of Acids and Bases - Check yourself
6 questionsPreview
-
14.4 Hydrolysis of Salts
Text lessonPreview
-
14.4 Hydrolysis of Salts - Check yourself
6 questionsPreview
-
Unit 14 review quiz: Acid-Base Equilibria
10 questionsPreview
-
Unit 14 overview: Acid-Base Equilibria
Text lessonPreview
-
14.4 Hydrolysis of Salts
Text lessonPreview
-
14.4 Hydrolysis of Salts - Check yourself
6 questionsPreview
-
14.5 Polyprotic Acids
Text lessonPreview
-
14.5 Polyprotic Acids - Check yourself
6 questionsPreview
-
14.5 Polyprotic Acids
Text lessonPreview
-
14.5 Polyprotic Acids - Check yourself
6 questionsPreview
-
14.6 Buffers
Text lessonPreview
-
14.6 Buffers - Check yourself
6 questionsPreview
-
14.6 Buffers
Text lessonPreview
-
14.6 Buffers - Check yourself
6 questionsPreview
-
14.7 Acid-Base Titrations
Text lessonPreview
-
14.7 Acid-Base Titrations - Check yourself
6 questionsPreview
-
14.7 Acid-Base Titrations
Text lessonPreview
-
14.7 Acid-Base Titrations - Check yourself
6 questionsPreview
-
Unit 14 review quiz: Acid-Base Equilibria
10 questionsPreview
Unit 15: Equilibria of Other Reaction Classes
0/16
-
Unit 15 overview: Equilibria of Other Reaction Classes
Text lessonPreview
-
15.1 Precipitation and Dissolution
Text lessonPreview
-
15.1 Precipitation and Dissolution - Check yourself
6 questionsPreview
-
15.1 Precipitation and Dissolution
Text lessonPreview
-
15.1 Precipitation and Dissolution - Check yourself
6 questionsPreview
-
15.2 Lewis Acids and Bases
Text lessonPreview
-
15.2 Lewis Acids and Bases - Check yourself
6 questionsPreview
-
Unit 15 review quiz: Equilibria of Other Reaction Classes
10 questionsPreview
-
Unit 15 overview: Equilibria of Other Reaction Classes
Text lessonPreview
-
15.2 Lewis Acids and Bases
Text lessonPreview
-
15.2 Lewis Acids and Bases - Check yourself
6 questionsPreview
-
15.3 Coupled Equilibria
Text lessonPreview
-
15.3 Coupled Equilibria - Check yourself
6 questionsPreview
-
15.3 Coupled Equilibria
Text lessonPreview
-
15.3 Coupled Equilibria - Check yourself
6 questionsPreview
-
Unit 15 review quiz: Equilibria of Other Reaction Classes
10 questionsPreview
Unit 16: Thermodynamics
0/20
-
Unit 16 overview: Thermodynamics
Text lessonPreview
-
16.1 Spontaneity
Text lessonPreview
-
16.1 Spontaneity - Check yourself
6 questionsPreview
-
16.1 Spontaneity
Text lessonPreview
-
16.1 Spontaneity - Check yourself
6 questionsPreview
-
16.2 Entropy
Text lessonPreview
-
16.2 Entropy - Check yourself
6 questionsPreview
-
16.2 Entropy
Text lessonPreview
-
16.2 Entropy - Check yourself
6 questionsPreview
-
Unit 16 review quiz: Thermodynamics
10 questionsPreview
-
Unit 16 overview: Thermodynamics
Text lessonPreview
-
16.3 The Second and Third Laws of Thermodynamics
Text lessonPreview
-
16.3 The Second and Third Laws of Thermodynamics - Check yourself
6 questionsPreview
-
16.3 The Second and Third Laws of Thermodynamics
Text lessonPreview
-
16.3 The Second and Third Laws of Thermodynamics - Check yourself
6 questionsPreview
-
16.4 Free Energy
Text lessonPreview
-
16.4 Free Energy - Check yourself
6 questionsPreview
-
16.4 Free Energy
Text lessonPreview
-
16.4 Free Energy - Check yourself
6 questionsPreview
-
Unit 16 review quiz: Thermodynamics
10 questionsPreview
Unit 17: Electrochemistry
0/32
-
Unit 17 overview: Electrochemistry
Text lessonPreview
-
17.1 Review of Redox Chemistry
Text lessonPreview
-
17.1 Review of Redox Chemistry - Check yourself
6 questionsPreview
-
17.1 Review of Redox Chemistry
Text lessonPreview
-
17.1 Review of Redox Chemistry - Check yourself
6 questionsPreview
-
17.2 Galvanic Cells
Text lessonPreview
-
17.2 Galvanic Cells - Check yourself
6 questionsPreview
-
17.2 Galvanic Cells
Text lessonPreview
-
17.2 Galvanic Cells - Check yourself
6 questionsPreview
-
17.3 Electrode and Cell Potentials
Text lessonPreview
-
17.3 Electrode and Cell Potentials - Check yourself
6 questionsPreview
-
17.3 Electrode and Cell Potentials
Text lessonPreview
-
17.3 Electrode and Cell Potentials - Check yourself
6 questionsPreview
-
17.4 Potential, Free Energy, and Equilibrium
Text lessonPreview
-
17.4 Potential, Free Energy, and Equilibrium - Check yourself
6 questionsPreview
-
Unit 17 review quiz: Electrochemistry
10 questionsPreview
-
Unit 17 overview: Electrochemistry
Text lessonPreview
-
17.4 Potential, Free Energy, and Equilibrium
Text lessonPreview
-
17.4 Potential, Free Energy, and Equilibrium - Check yourself
6 questionsPreview
-
17.5 Batteries and Fuel Cells
Text lessonPreview
-
17.5 Batteries and Fuel Cells - Check yourself
6 questionsPreview
-
17.5 Batteries and Fuel Cells
Text lessonPreview
-
17.5 Batteries and Fuel Cells - Check yourself
6 questionsPreview
-
17.6 Corrosion
Text lessonPreview
-
17.6 Corrosion - Check yourself
6 questionsPreview
-
17.6 Corrosion
Text lessonPreview
-
17.6 Corrosion - Check yourself
6 questionsPreview
-
17.7 Electrolysis
Text lessonPreview
-
17.7 Electrolysis - Check yourself
6 questionsPreview
-
17.7 Electrolysis
Text lessonPreview
-
17.7 Electrolysis - Check yourself
6 questionsPreview
-
Unit 17 review quiz: Electrochemistry
10 questionsPreview
Unit 18: Representative Metals, Metalloids, and Nonmetals
0/52
-
Unit 18 overview: Representative Metals, Metalloids, and Nonmetals
Text lessonPreview
-
18.1 Periodicity
Text lessonPreview
-
18.1 Periodicity - Check yourself
6 questionsPreview
-
18.1 Periodicity
Text lessonPreview
-
18.1 Periodicity - Check yourself
6 questionsPreview
-
18.2 Occurrence and Preparation of the Representative Metals
Text lessonPreview
-
18.2 Occurrence and Preparation of the Representative Metals - Check yourself
6 questionsPreview
-
18.2 Occurrence and Preparation of the Representative Metals
Text lessonPreview
-
18.2 Occurrence and Preparation of the Representative Metals - Check yourself
6 questionsPreview
-
18.3 Structure and General Properties of the Metalloids
Text lessonPreview
-
18.3 Structure and General Properties of the Metalloids - Check yourself
6 questionsPreview
-
18.3 Structure and General Properties of the Metalloids
Text lessonPreview
-
18.3 Structure and General Properties of the Metalloids - Check yourself
6 questionsPreview
-
18.4 Structure and General Properties of the Nonmetals
Text lessonPreview
-
18.4 Structure and General Properties of the Nonmetals - Check yourself
6 questionsPreview
-
18.4 Structure and General Properties of the Nonmetals
Text lessonPreview
-
18.4 Structure and General Properties of the Nonmetals - Check yourself
6 questionsPreview
-
18.5 Occurrence, Preparation, and Compounds of Hydrogen
Text lessonPreview
-
18.5 Occurrence, Preparation, and Compounds of Hydrogen - Check yourself
6 questionsPreview
-
18.5 Occurrence, Preparation, and Compounds of Hydrogen
Text lessonPreview
-
18.5 Occurrence, Preparation, and Compounds of Hydrogen - Check yourself
6 questionsPreview
-
18.6 Occurrence, Preparation, and Properties of Carbonates
Text lessonPreview
-
18.6 Occurrence, Preparation, and Properties of Carbonates - Check yourself
6 questionsPreview
-
18.6 Occurrence, Preparation, and Properties of Carbonates
Text lessonPreview
-
18.6 Occurrence, Preparation, and Properties of Carbonates - Check yourself
6 questionsPreview
-
Unit 18 review quiz: Representative Metals, Metalloids, and Nonmetals
10 questionsPreview
-
Unit 18 overview: Representative Metals, Metalloids, and Nonmetals
Text lessonPreview
-
18.7 Occurrence, Preparation, and Properties of Nitrogen
Text lessonPreview
-
18.7 Occurrence, Preparation, and Properties of Nitrogen - Check yourself
6 questionsPreview
-
18.7 Occurrence, Preparation, and Properties of Nitrogen
Text lessonPreview
-
18.7 Occurrence, Preparation, and Properties of Nitrogen - Check yourself
6 questionsPreview
-
18.8 Occurrence, Preparation, and Properties of Phosphorus
Text lessonPreview
-
18.8 Occurrence, Preparation, and Properties of Phosphorus - Check yourself
6 questionsPreview
-
18.8 Occurrence, Preparation, and Properties of Phosphorus
Text lessonPreview
-
18.8 Occurrence, Preparation, and Properties of Phosphorus - Check yourself
6 questionsPreview
-
18.9 Occurrence, Preparation, and Compounds of Oxygen
Text lessonPreview
-
18.9 Occurrence, Preparation, and Compounds of Oxygen - Check yourself
6 questionsPreview
-
18.9 Occurrence, Preparation, and Compounds of Oxygen
Text lessonPreview
-
18.9 Occurrence, Preparation, and Compounds of Oxygen - Check yourself
6 questionsPreview
-
18.10 Occurrence, Preparation, and Properties of Sulfur
Text lessonPreview
-
18.10 Occurrence, Preparation, and Properties of Sulfur - Check yourself
6 questionsPreview
-
18.10 Occurrence, Preparation, and Properties of Sulfur
Text lessonPreview
-
18.10 Occurrence, Preparation, and Properties of Sulfur - Check yourself
6 questionsPreview
-
18.11 Occurrence, Preparation, and Properties of Halogens
Text lessonPreview
-
18.11 Occurrence, Preparation, and Properties of Halogens - Check yourself
6 questionsPreview
-
18.11 Occurrence, Preparation, and Properties of Halogens
Text lessonPreview
-
18.11 Occurrence, Preparation, and Properties of Halogens - Check yourself
6 questionsPreview
-
18.12 Occurrence, Preparation, and Properties of the Noble Gases
Text lessonPreview
-
18.12 Occurrence, Preparation, and Properties of the Noble Gases - Check yourself
6 questionsPreview
-
18.12 Occurrence, Preparation, and Properties of the Noble Gases
Text lessonPreview
-
18.12 Occurrence, Preparation, and Properties of the Noble Gases - Check yourself
6 questionsPreview
-
Unit 18 review quiz: Representative Metals, Metalloids, and Nonmetals
10 questionsPreview
Unit 19: Transition Metals and Coordination Chemistry
0/16
-
Unit 19 overview: Transition Metals and Coordination Chemistry
Text lessonPreview
-
19.1 Occurrence, Preparation, and Properties of Transition Metals and Their Compounds
Text lessonPreview
-
19.1 Occurrence, Preparation, and Properties of Transition Metals and Their Compounds - Check yourself
6 questionsPreview
-
19.1 Occurrence, Preparation, and Properties of Transition Metals and Their Compounds
Text lessonPreview
-
19.1 Occurrence, Preparation, and Properties of Transition Metals and Their Compounds - Check yourself
6 questionsPreview
-
19.2 Coordination Chemistry of Transition Metals
Text lessonPreview
-
19.2 Coordination Chemistry of Transition Metals - Check yourself
6 questionsPreview
-
Unit 19 review quiz: Transition Metals and Coordination Chemistry
10 questionsPreview
-
Unit 19 overview: Transition Metals and Coordination Chemistry
Text lessonPreview
-
19.2 Coordination Chemistry of Transition Metals
Text lessonPreview
-
19.2 Coordination Chemistry of Transition Metals - Check yourself
6 questionsPreview
-
19.3 Spectroscopic and Magnetic Properties of Coordination Compounds
Text lessonPreview
-
19.3 Spectroscopic and Magnetic Properties of Coordination Compounds - Check yourself
6 questionsPreview
-
19.3 Spectroscopic and Magnetic Properties of Coordination Compounds
Text lessonPreview
-
19.3 Spectroscopic and Magnetic Properties of Coordination Compounds - Check yourself
6 questionsPreview
-
Unit 19 review quiz: Transition Metals and Coordination Chemistry
10 questionsPreview
Unit 20: Organic Chemistry
0/20
-
Unit 20 overview: Organic Chemistry
Text lessonPreview
-
20.1 Hydrocarbons
Text lessonPreview
-
20.1 Hydrocarbons - Check yourself
6 questionsPreview
-
20.1 Hydrocarbons
Text lessonPreview
-
20.1 Hydrocarbons - Check yourself
6 questionsPreview
-
20.2 Alcohols and Ethers
Text lessonPreview
-
20.2 Alcohols and Ethers - Check yourself
6 questionsPreview
-
20.2 Alcohols and Ethers
Text lessonPreview
-
20.2 Alcohols and Ethers - Check yourself
6 questionsPreview
-
Unit 20 review quiz: Organic Chemistry
10 questionsPreview
-
Unit 20 overview: Organic Chemistry
Text lessonPreview
-
20.3 Aldehydes, Ketones, Carboxylic Acids, and Esters
Text lessonPreview
-
20.3 Aldehydes, Ketones, Carboxylic Acids, and Esters - Check yourself
6 questionsPreview
-
20.3 Aldehydes, Ketones, Carboxylic Acids, and Esters
Text lessonPreview
-
20.3 Aldehydes, Ketones, Carboxylic Acids, and Esters - Check yourself
6 questionsPreview
-
20.4 Amines and Amides
Text lessonPreview
-
20.4 Amines and Amides - Check yourself
6 questionsPreview
-
20.4 Amines and Amides
Text lessonPreview
-
20.4 Amines and Amides - Check yourself
6 questionsPreview
-
Unit 20 review quiz: Organic Chemistry
10 questionsPreview
Unit 21: Nuclear Chemistry
0/28
-
Unit 21 overview: Nuclear Chemistry
Text lessonPreview
-
21.1 Nuclear Structure and Stability
Text lessonPreview
-
21.1 Nuclear Structure and Stability - Check yourself
6 questionsPreview
-
21.1 Nuclear Structure and Stability
Text lessonPreview
-
21.1 Nuclear Structure and Stability - Check yourself
6 questionsPreview
-
21.2 Nuclear Equations
Text lessonPreview
-
21.2 Nuclear Equations - Check yourself
6 questionsPreview
-
21.2 Nuclear Equations
Text lessonPreview
-
21.2 Nuclear Equations - Check yourself
6 questionsPreview
-
21.3 Radioactive Decay
Text lessonPreview
-
21.3 Radioactive Decay - Check yourself
6 questionsPreview
-
21.3 Radioactive Decay
Text lessonPreview
-
21.3 Radioactive Decay - Check yourself
6 questionsPreview
-
Unit 21 review quiz: Nuclear Chemistry
10 questionsPreview
-
Unit 21 overview: Nuclear Chemistry
Text lessonPreview
-
21.4 Transmutation and Nuclear Energy
Text lessonPreview
-
21.4 Transmutation and Nuclear Energy - Check yourself
6 questionsPreview
-
21.4 Transmutation and Nuclear Energy
Text lessonPreview
-
21.4 Transmutation and Nuclear Energy - Check yourself
6 questionsPreview
-
21.5 Uses of Radioisotopes
Text lessonPreview
-
21.5 Uses of Radioisotopes - Check yourself
6 questionsPreview
-
21.5 Uses of Radioisotopes
Text lessonPreview
-
21.5 Uses of Radioisotopes - Check yourself
6 questionsPreview
-
21.6 Biological Effects of Radiation
Text lessonPreview
-
21.6 Biological Effects of Radiation - Check yourself
6 questionsPreview
-
21.6 Biological Effects of Radiation
Text lessonPreview
-
21.6 Biological Effects of Radiation - Check yourself
6 questionsPreview
-
Unit 21 review quiz: Nuclear Chemistry
10 questionsPreview
Text lesson
14.7 Acid-Base Titrations
14.7 Acid-Base Titrations — CHEMISTRY notes: You will be able to interpret strong and weak acid titration curves, calculate the pH at the key stages of a titration, and explain how an acid-base indicator signals the end point.
Learning objectives
Learning objectives
Interpret titration curves for strong and weak acid-base systems.
Compute the pH of a sample at the important stages of a titration.
Explain the function of acid-base indicators.
1Titration curves2Titration curves3Titration curves
Titration curves
1
A titration is a quantitative method for finding the concentration of an acid or a base.
2
A known volume of the sample is reacted with a solution of known concentration, called the titrant, that is added in measured amounts.
3
Earlier chapters used titrations as a stoichiometry tool.
4
In this section we look at the chemical equilibria behind the method
which explains why some titrations work well and others do not.
5
A titration curve is a plot of a property of the solution against the volume of titrant added.
6
For acid-base titrations the pH is the most useful property,
1 / 3Next ▶
Titration curves
Titration curves
because it changes in a predictable way as the composition of the solution changes.
Monitoring the pH therefore lets us follow the progress of the reaction and locate the end point,
which is the point where the indicator signals that the reaction is complete.
The pH at any point on the curve can be calculated.
If the titrant is a strong base and the sample is a strong acid, the calculation is a stoichiometry problem: the moles of acid and base are compared, the amount left over is found,
and the pH follows from the concentration of the excess species in the total volume.
◀ Previous2 / 3Next ▶
Titration curves
Titration curves
If the sample is a weak acid, the calculation needs an equilibrium treatment before the pH can be found.
(an ICE table with the acid dissociation constant, Ka)
Both kinds of calculation are carried out in the worked examples below.
◀ Previous3 / 3
1The four stages of a titration2The four stages of a titration3The four stages of a titration4The four stages of a titration5The four stages of a titration
The four stages of a titration
1
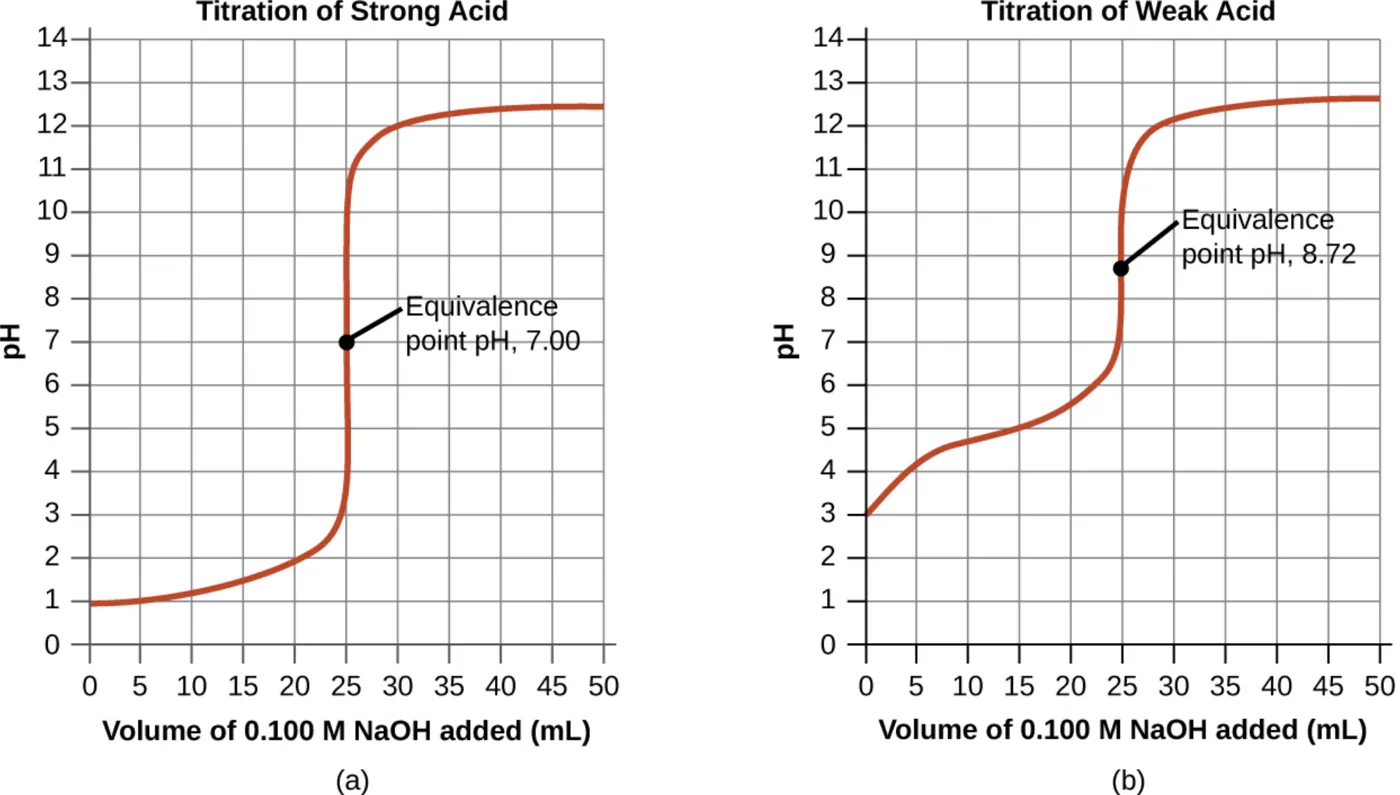
Comparing the curve for a strong acid with the curve for a weak acid, of the same concentration and the same volume, shows four stages. Each stage has its own chemistry and its own way of calculating the pH.
2
1
3
Initial state (0 mL of titrant added)
4
the pH is set by the acid in the sample alone.
5
Both samples have the same concentration
but the weak acid is only partly ionizedso it has the higher initial pH.
6
2
1 / 5Next ▶
The four stages of a titration
1
Pre-equivalence point (0 mL <
V <25 mL)
2
the pH rises gradually as titrant is added.
3
The solution contains unreacted acid together with the conjugate base produced by the reaction.
4
For a weak acid this mixture acts as a buffer.
5
3
6
25 mL)
◀ Previous2 / 5Next ▶
The four stages of a titration
The four stages of a titration
the amount of base added exactly equals the amount of acid.
The pH rises sharply here.
For the strong acid the solution becomes neutral, with pH 7.00.
For the weak acid the solution becomes basic
because its conjugate base reacts with water.
4
Postequivalence point (V >
25 mL)
◀ Previous3 / 5Next ▶
The four stages of a titration
1
the excess strong base controls the pH.
2
Both titrations are carried out with the same titrant
so both curves look alike at this stage.
3
Table 14.2 gives the pH values for the titration of 25.00 mL of 0.100 M HCl and of 25.00 mL of 0.100 M acetic acid, both with 0.100 M NaOH. The numbers show the stages clearly: the weak acid starts higher, its pH rises more slowly before the equivalence point, and its equivalence-point pH is 8.72 instead of 7.00.
4
The strong acid curve rises steeply through the equivalence point, from about pH 3.7 at 24.9 mL to about pH 10.3 at 25.1 mL. The weak acid curve shows the same jump but starts from a higher pH and reaches its equivalence point at a basic pH. The figure below plots both curves from the table.
| Volume of 0.100 M NaOH added (mL) | Moles of NaOH added | pH, 0.100 M HCl | pH, 0.100 M CH3CO2H |
|---|---|---|---|
| 0.0 | 0.0 | 1.00 | 2.87 |
| 5.0 | 0.00050 | 1.18 | 4.14 |
| 10.0 | 0.00100 | 1.37 | 4.57 |
| 15.0 | 0.00150 | 1.60 | 4.92 |
| 20.0 | 0.00200 | 1.95 | 5.35 |
| 22.0 | 0.00220 | 2.20 | 5.61 |
| 24.0 | 0.00240 | 2.69 | 6.13 |
| 24.5 | 0.00245 | 3.00 | 6.44 |
| 24.9 | 0.00249 | 3.70 | 7.14 |
| 25.0 | 0.00250 | 7.00 | 8.72 |
| 25.1 | 0.00251 | 10.30 | 10.30 |
| 25.5 | 0.00255 | 11.00 | 11.00 |
| 26.0 | 0.00260 | 11.29 | 11.29 |
| 28.0 | 0.00280 | 11.75 | 11.75 |
| 30.0 | 0.00300 | 11.96 | 11.96 |
| 35.0 | 0.00350 | 12.22 | 12.22 |
| 40.0 | 0.00400 | 12.36 | 12.36 |
| 45.0 | 0.00450 | 12.46 | 12.46 |
| 50.0 | 0.00500 | 12.52 | 12.52 |
◀ Previous4 / 5Next ▶
Two titration curves plotted together. The strong acid curve starts near pH 1 and crosses pH 7 at the equivalence point. The weak acid curve starts higher and reaches a basic equivalence point near pH 8.7. Image: OpenStax, Chemistry 2e, CC BY 4.0.
The four stages of a titration
◀ Previous5 / 5
1Acid-base indicators2Acid-base indicators3Acid-base indicators4Acid-base indicators5Acid-base indicators
Acid-base indicators
Acid-base indicators
Some organic substances change colour in dilute solution when the hydronium ion concentration reaches a particular value.
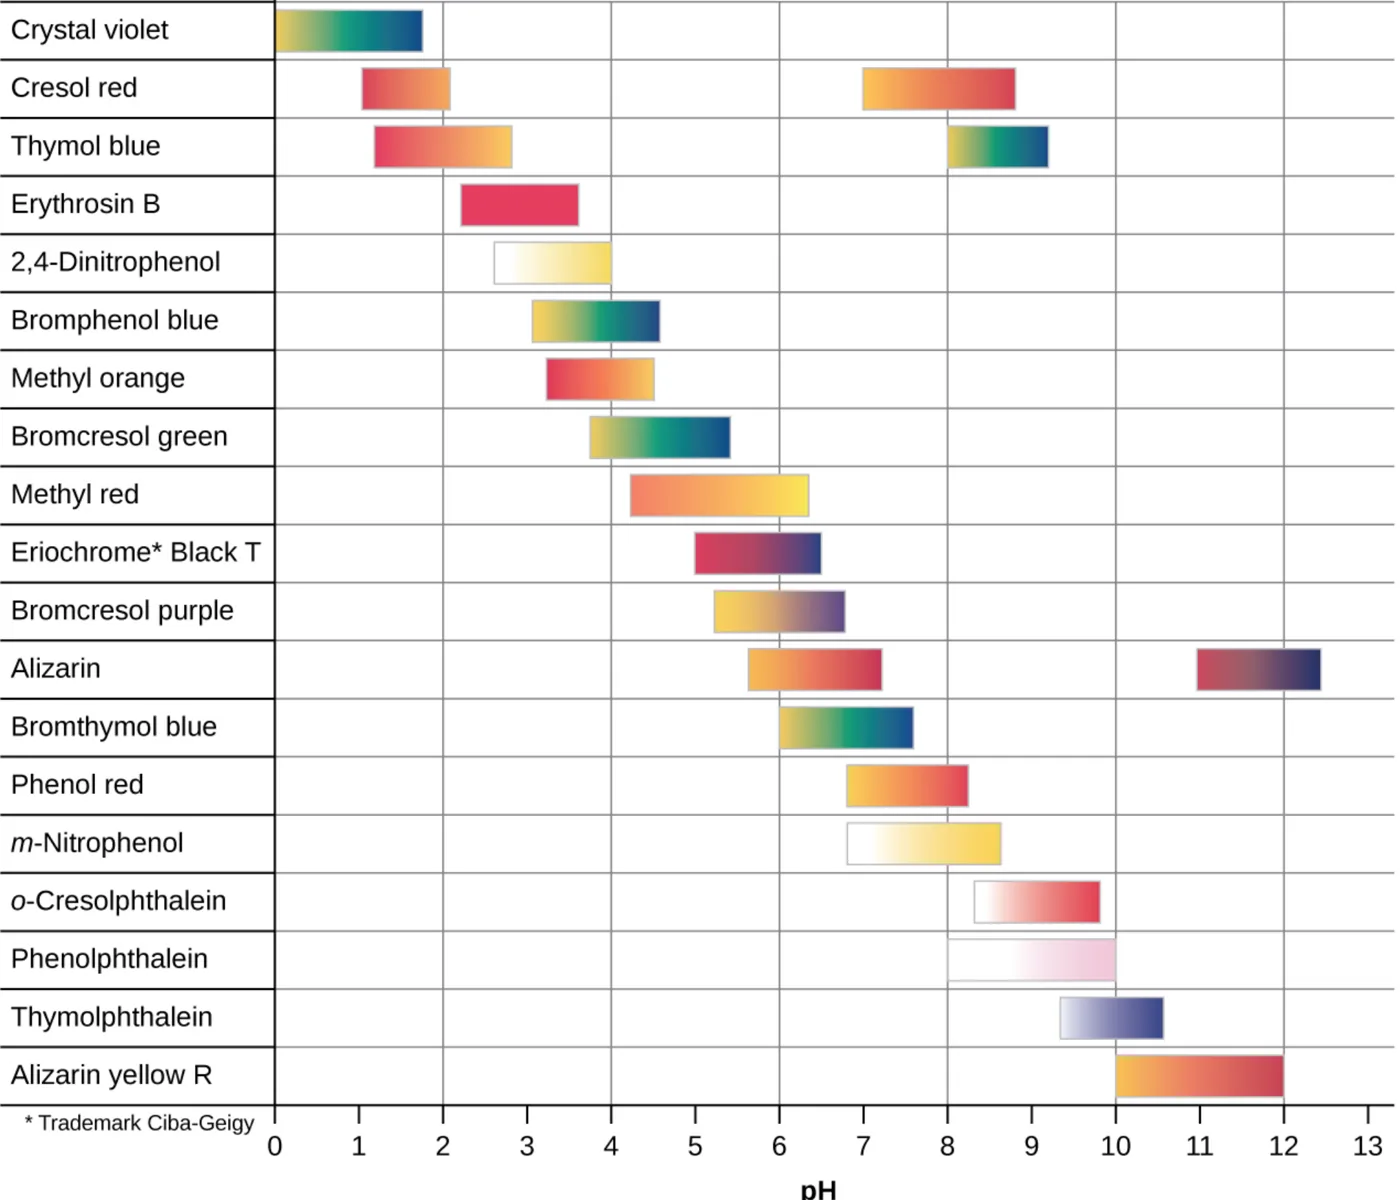
Phenolphthalein, for example, is colourless in any solution with a hydronium ion concentration above 5.0 × 10⁻⁹ M (pH below 8.3).
In more basic solutions
where the hydronium ion concentration is below 5.0 × 10⁻⁹ M (pH above 8.3), it is pink or red.
Substances of this kind
which show the pH of a solution by their colour, are called acid-base indicators.
They are either weak organic acids or weak organic bases.
Methyl orange is a weak organic acid.
1 / 5Next ▶
Acid-base indicators
1
Its equilibrium can be written as HIn ⇌ H+ + In−
where HIn is the complex undissociated molecule and In− is its anion.
2
The anion In− is yellow and the undissociated form HIn is red.
3
Adding acid raises the hydronium ion concentration, and by Le Châtelier’s principle the equilibrium shifts toward the red HIn form.
4
Adding base removes H+
so the equilibrium shifts toward the yellow In− form.
5
This is the same behaviour as a buffer.
6
The colour of an indicator solution depends on the ratio of the two species, In− and HIn.
◀ Previous2 / 5Next ▶
Acid-base indicators
1
When most of the indicator, typically about 60 to 90 percent or more, is present as In−, the solution looks yellow.
2
When most of it is present as HIn, the solution looks red.
3
The Henderson-Hasselbalch equation links the pH of an indicator solution to its composition, and therefore to its colour:
4
pH = pKa + log([In−] / [HIn])
5
Here pKa is the negative logarithm of the indicator’s acid dissociation constant
which is a dimensionless number.
6
When the pH is greater than pKa, the logarithm is positive
so the anion In− is in excess and the solution is yellow.
◀ Previous3 / 5Next ▶
Acid-base indicators
Acid-base indicators
When the pH is less than pKa, the logarithm is negative
so the acid form HIn is in excess and the solution is red.
When the pH is close to pKa, both forms are present in appreciable amounts and the colours mix
giving orange.
The colour change interval of an indicator is the range of pH values over which its colour changes.
For most indicators this interval is about pKa ± 1.
Many indicators cover different pH ranges,so the approximate pH of an unknown solution can be found by eliminating indicators that do not change colour in its range.
Universal indicators and pH paper are mixtures of indicators that show a different colour at each pH.
The figure below compares several common indicators with their colours and colour change intervals.
◀ Previous4 / 5Next ▶
A chart of several acid-base indicators, each shown as a bar over its colour change interval on a pH scale, with the colour in each range. Image: OpenStax, Chemistry 2e, CC BY 4.0.
Acid-base indicators
◀ Previous5 / 5
1Choosing an indicator for a titration2Choosing an indicator for a titration
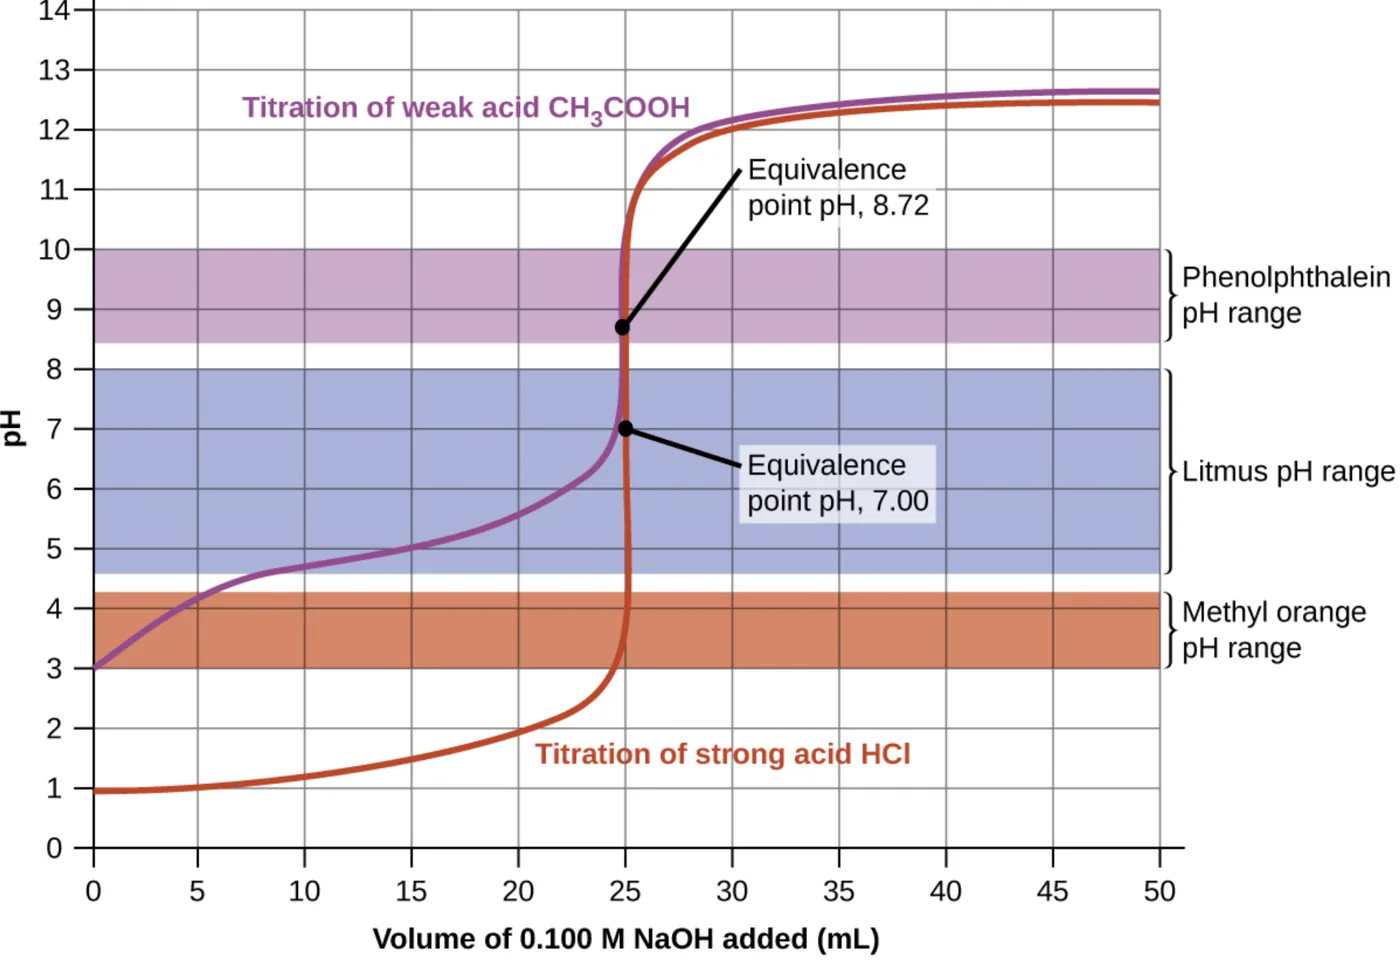
Titration curves for a strong acid and a weak acid, with the colour change intervals of three indicators marked. Only one indicator changes colour at the weak acid equivalence point. Image: OpenStax, Chemistry 2e, CC BY 4.0.
Choosing an indicator for a titration
 ⤢ Enlarge
Choosing an indicator for a titration
An indicator is only useful if its colour change happens at the steep part of the titration curve, close to the equivalence point. The figure below shows the curves for a strong acid and a weak acid, together with the colour change intervals of three indicators.
For the strong acid titration, all three indicators give a reasonably sharp change.
Methyl orange starts to turn orange when about 24 mL of titrant has been added, and it is yellow by the 25 mL equivalence point.
The end point is then read as the volume that gives a clear orange-to-yellow change.
This change is hard for most people to judge exactly.
Litmus and phenolphthalein give more accurate end points
because their colour change intervals lie inside the sharp pH jump near 25.00 mL.
1 / 2Next ▶
Choosing an indicator for a titration
Choosing an indicator for a titration
For the weak acid titration only phenolphthalein works.
Methyl orange changes colour slowly from red to orange to yellow over a volume range of about 0 to 6 mL,
so it finishes well before the equivalence point at 25 mL.
Litmus starts to change after 7 to 8 mL and finishes just before the equivalence point.
Phenolphthalein changes colour inside the abrupt pH rise at the equivalence point, from colourless to pink over a very small volume around 25 mL.
◀ Previous2 / 2
1Example 14.21: pH of titration solutions, strong acid and st2Example 14.21: pH of titration solutions, strong acid and st3Example 14.22: pH of titration solutions, weak acid and stro4Example 14.22: pH of titration solutions, weak acid and stro5Example 14.22: pH of titration solutions, weak acid and stro6Example 14.22: pH of titration solutions, weak acid and stro
Example 14.21: pH of titration solutions, strong acid and strong base
1
25.00 mL of 0.100 M HCl (a strong acid) is titrated with 0.100 M NaOH (a strong base). Find the pH after 0.00 mL, 12.50 mL, 25.00 mL and 37.50 mL of NaOH have been added.
2
(a) 0.00 mL. HCl ionizes completely
so [H3O+] = 0.100 M. pH = −log(0.100) = 1.000.
3
(b) 12.50 mL. The moles of acid are 0.02500 L × 0.100 mol/L = 2.50 × 10⁻³ mol.
4
The moles of base are 0.01250 L × 0.100 mol/L = 1.25 × 10⁻³ mol.
5
The base is the limiting reagent and is used up by the acid, leaving 1.25 × 10⁻³ mol of H3O+.
6
The total volume is 37.50 mL
so [H3O+] = 1.25 × 10⁻³ mol / 0.03750 L = 3.33 × 10⁻² M. pH = −log(0.0333) = 1.48.
1 / 6Next ▶
Example 14.21: pH of titration solutions, strong acid and strong base
1
(c) 25.00 mL. The moles of base equal the moles of acid
which is the equivalence point. The only solute is NaClwhich does not hydrolyse. The only source of H3O+ is the autoprotolysis of waterso the solution is neutral: pH = 7.00.
2
(d) 37.50 mL. The base is in excess.
3
Moles of NaOH added = 0.03750 L × 0.100 mol/L = 3.75 × 10⁻³ mol.
4
Excess OH− = 3.75 × 10⁻³ − 2.50 × 10−3 = 1.25 × 10⁻³ mol in a total volume of 62.50 mL. [OH−] = 1.25 × 10⁻³ mol / 0.06250 L = 0.0200 M. pOH = −log(0.0200) = 1.70,
so pH = 14 − 1.70 = 12.30.
5
Check your learning. 50.0 mL of 0.100 M HNO3 is titrated with 0.200 M NaOH. The answers at 0.00, 15.0, 25.0 and 40.0 mL of NaOH are pH 1.000, about 1.51, 7.00 and 12.52. At 15.0 mL, 3.00 mmol of NaOH leaves 2.00 mmol of H+ in 65.0 mL
so [H+] = 0.0308 M and pH ≈ 1.51. At 40.0 mL, 8.00 mmol of NaOH leaves 3.00 mmol of OH− in 90.0 mLso pOH = 1.48 and pH = 12.52.
◀ Previous2 / 6Next ▶
Example 14.22: pH of titration solutions, weak acid and strong base
1
25.00 mL of 0.100 M acetic acid, CH3CO2H, is titrated with 0.100 M NaOH. The acid dissociation constant of acetic acid is Ka = 1.8 × 10⁻⁵. Find the pH after 0.00 mL, 25.00 mL, 12.50 mL and 37.50 mL of NaOH have been added.
2
(a) 0.00 mL. Only the weak acid is present
so an ICE table is used.
3
Let x be the concentration of H3O+ formed.
4
Then 1.8 × 10−5 = x2 / (0.100 − x).
5
Because x is small, x2 ≈ 1.8 × 10⁻⁶ and x = 1.34 × 10⁻³ M. pH = −log(1.34 × 10⁻³) = 2.87.
6
(b) 25.00 mL. The moles of NaOH equal the moles of acetic acid (2.50 × 10⁻³ mol)
so this is the equivalence point.
◀ Previous3 / 6Next ▶
Example 14.22: pH of titration solutions, weak acid and strong base
1
The solution contains acetate ion at a concentration of 2.50 × 10⁻³ mol / 0.05000 L = 0.0500 M.
2
Acetate is a weak base, with Kb = Kw / Ka = (1.0 × 10⁻¹⁴)/ (1.8 × 10⁻⁵) = 5.6 × 10⁻¹⁰.
3
Acetate + H2O ⇌ CH3CO2H + OH−.
4
Assuming x is much less than 0.0500 M, x2 / 0.0500 = 5.6 × 10⁻¹⁰
so x = [OH−] = 5.3 × 10⁻⁶ M. pOH = 5.28 and pH = 8.72.The pH is well above 7, as expected for a weak acid titrated with a strong base.
5
(c) 12.50 mL. This is half the amount needed to reach the equivalence point
so half of the acetic acid has been converted into acetate.
6
The acid and its conjugate base are present in equal amounts.
◀ Previous4 / 6Next ▶
Example 14.22: pH of titration solutions, weak acid and strong base
Example 14.22: pH of titration solutions, weak acid and strong base
The Henderson-Hasselbalch equation then gives pH = pKa + log(1).
So at the half-equivalence point, pH = pKa = −log(1.8 × 10⁻⁵) = 4.74.
(d) 37.50 mL. This is 50 percent more titrant than needed
so the solution contains acetate and an excess of strong base.
The excess base controls the pH.
Excess OH− = 3.75 × 10⁻³ − 2.50 × 10−3 = 1.25 × 10⁻³ mol in 62.50 mL
giving [OH−] = 0.0200 M.
The contribution from acetate is negligible. pOH = 1.70 and pH = 12.30.
◀ Previous5 / 6Next ▶
Example 14.22: pH of titration solutions, weak acid and strong base
Example 14.22: pH of titration solutions, weak acid and strong base
Check your learning. 50.0 mL of 0.100 M formic acid, HCOOH, with Ka = 1.8 × 10⁻⁴, is titrated with 0.200 M NaOH.
The pH values at 0.00, 15.0, 25.0 and 30.0 mL of NaOH are 2.37, 3.92, 8.29 and 12.10.
At 15.0 mL, 3.00 mmol of NaOH converts 3.00 mmol of HCOOH into HCOO−, leaving 2.00 mmol of HCOOH.
Using pH = pKa + log(3.00 / 2.00) with pKa = 3.74 gives pH = 3.92.
At 30.0 mL, 6.00 mmol of NaOH is 1.00 mmol more than the 5.00 mmol of acid, and the excess 1.00 mmol of OH− in 80.0 mL gives pH 12.10.
◀ Previous6 / 6
Key terms
| Term | Meaning |
|---|---|
| Titration curve | A plot of a solution property, usually pH, against the volume of titrant added. |
| Titrant | The solution of known concentration that is added from a burette during a titration. |
| Equivalence point | The point at which the moles of titrant added are chemically equal to the moles of analyte in the sample. |
| End point | The point at which an indicator signals that the titration is complete, which is ideally close to the equivalence point. |
| Pre-equivalence point | The stage before the equivalence point, when the solution contains unreacted acid and its conjugate base. |
| Postequivalence point | The stage after the equivalence point, when the pH is controlled by the excess strong titrant. |
| Half-equivalence point | The point at which half of the weak acid has been neutralized, where pH equals pKa. |
| Acid-base indicator | A weak organic acid or weak organic base whose colour depends on the pH of the solution. |
| Color change interval | The range of pH values over which an indicator changes colour, usually about pKa ± 1. |
| Henderson-Hasselbalch equation | The relation pH = pKa + log([conjugate base] / [acid]), used for buffers and indicators. |
1Avoid these mistakes2Avoid these mistakes3Avoid these mistakes
Avoid these mistakes
1Avoid this
Assuming the equivalence point of every titration is at pH 7.Avoid this
Only a strong acid titrated with a strong base is neutral at equivalence.Avoid this
A weak acid gives a basic solution because its conjugate base reacts with water.Avoid this
2Avoid this
Using the total moles of acid, not the moles remaining, when the titrant is less than the equivalence volume.Avoid this
1 / 3Next ▶
Avoid these mistakes
The leftover acid is divided by the total volume, which includes the titrant.Avoid this
3Avoid this
Forgetting to add the titrant volume to the solution volume before dividing.Avoid this
For example, 37.50 mL of base with 25.00 mL of acid gives a total volume of 62.50 mL, not 25.00 mL.Avoid this
4Avoid this
Calculating pOH and then forgetting to convert it to pH with pH = 14 − pOH.Avoid this
◀ Previous2 / 3Next ▶
Avoid these mistakes
5Avoid this
Using the Henderson-Hasselbalch equation at points other than the buffer region, or at the equivalence point.Avoid this
At 12.50 mL of acetic acid it gives pH = pKa, but at 25.00 mL the pH must come from the hydrolysis of acetate.Avoid this
6Avoid this
Choosing an indicator whose colour change interval lies far from the equivalence pH.Avoid this
Methyl orange is unsuitable for a weak acid titration because it changes colour long before the equivalence point.Avoid this
◀ Previous3 / 3